
Research article · 2024 · Full text
International Journal of Advanced Biochemistry ResearchSocio-economic impact of Tribal Sub Plan (TSP) project beneficiaries
Volume 8(3S) · Pages 127–131 · DOI: 10.33545/26174693.2024.v8.i3sb.707 ↗
Research areasSouth Asian Studies and ConflictsSocial and Economic Development in India
Abstract
Author-writtenThe present study is an attempt to assess the impact of Tribal sub plan project implemented by VNMKV, Parbhani on tribals. The Village Wai was purposively selected for the present study as the TSP project was implemented in Wai village Taluka-Kalamnuri, District-Hingoli by VNMIKV, Parbhani since 2014-15. Five interventions were selected viz. sprinkler set, bullock drawn multipurpose seed cum ferti drill, improved seeds of soybean, wheat and portable drip irrigation set. Data were subject to different statistical test viz., percentage & frequencies for tabulation. Z test was applied to see the comparison between before and after situation. Pearson’s correlation coefficient (r) was also calculated to find out correlation between dependent and independent variables to see the nature of relationship existed. The variables are Educational change, Social Participation Change, Change in monthly expenditure on diet, Change in monthly expenditure on diet, Change in clothing pattern, Housing Pattern Change, Employment Change, Occupational Change, Property change, Annual Saving Change, Change in cropping area, Change in Income, Change in Productivity etc. Table 2 indicates that majority (57.50 percent) of the respondents belonged to medium category of overall socio-economic impact followed by 26.25 percent of the respondents belonged to low category and 16.25 percent belonged to high category.
Summary
Source-checkedPlain-language reading of the full paper, prepared with AI and checked against the text. Each point links to the authors' own words.
Why it matters
- Scheduled Tribes (STs) and Scheduled Castes (SCs) in India are considered disadvantaged groups due to long-term social and economic isolation and exploitation. View evidence ↗
- The Tribal Sub-Plan (TSP) was established during the Fifth Five-Year Plan (1974-79) specifically to improve the socio-economic status of tribal communities. View evidence ↗
- Tribal areas often struggle with moisture availability for crops due to irregular monsoons, making advanced irrigation technology essential for agricultural productivity. View evidence ↗
The question
- The study aimed to evaluate the socio-economic impact of the Tribal Sub Plan (TSP) project on its beneficiaries. View evidence ↗
What they did
- The study focused on Wai village in the Hingoli district, where the TSP project had been implemented by VNMKV, Parbhani since 2014-15. View evidence ↗
- The project interventions included providing sprinkler sets, portable drip irrigation, multipurpose seed cum ferti drills, and improved seeds for wheat and soybean. View evidence ↗
- The researchers randomly selected 80 project beneficiaries to compare their socio-economic status before and after the project implementation. View evidence ↗
- Data analysis involved using percentages and frequencies for tabulation, and Z-tests to determine the significance of changes between the 'before' and 'after' states. View evidence ↗
What they found
- Educational levels improved significantly (Z=1.96), with 31.25% of respondents reaching the high level category after the TSP project. View evidence ↗
- Clothing patterns showed a significant positive shift (Z=2.02), with the percentage of respondents in the medium category increasing to 58.75% from 31.25%. View evidence ↗
- Employment levels increased significantly (Z=2.97), with a notable impact observed in the high category of employment change. View evidence ↗
- A drastic positive shift in occupational status was observed (Z=2.13), with the medium category increasing from 12.50% to 77.50%. View evidence ↗
- Income levels increased significantly (Z=3.96), with the high-income category growing by 5.00% to reach 26.20% of respondents. View evidence ↗
- Overall agricultural productivity showed a statistically significant change (Z=2.07). View evidence ↗
- The overall socio-economic impact was categorized as medium for the majority (57.50%) of respondents, while 16.25% experienced a high impact. View evidence ↗
What it means
- The authors conclude that the TSP project effectively brought significant socio-economic improvements across multiple parameters, including income, education, and employment. View evidence ↗
- The authors note that changes in property and cropping area were non-significant, indicating a need for further targeted interventions in these specific areas. View evidence ↗
Visual summary
2 visualsIllustrations explain the paper; charts are replotted from the paper's own table values.
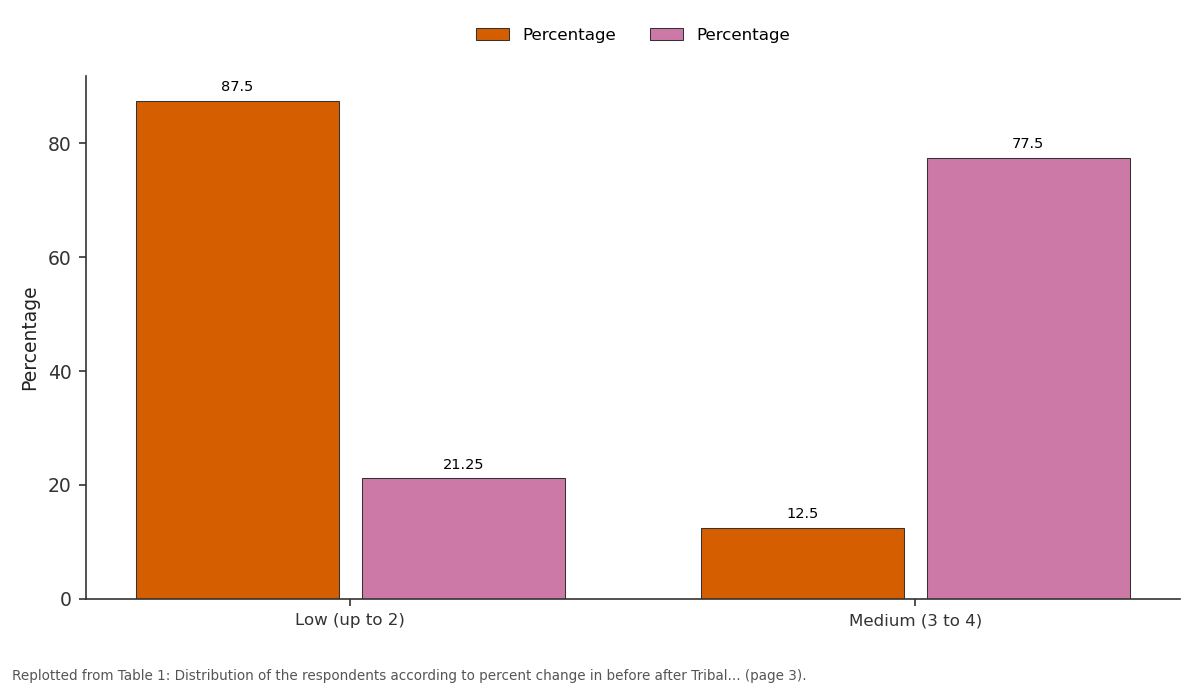
Percentage and Percentage: Low (up to 2) vs Medium (3 to 4)
Replotted from Table 1 (page 3) of the original paper. Every bar is the paper's own table value.
View source evidence ↗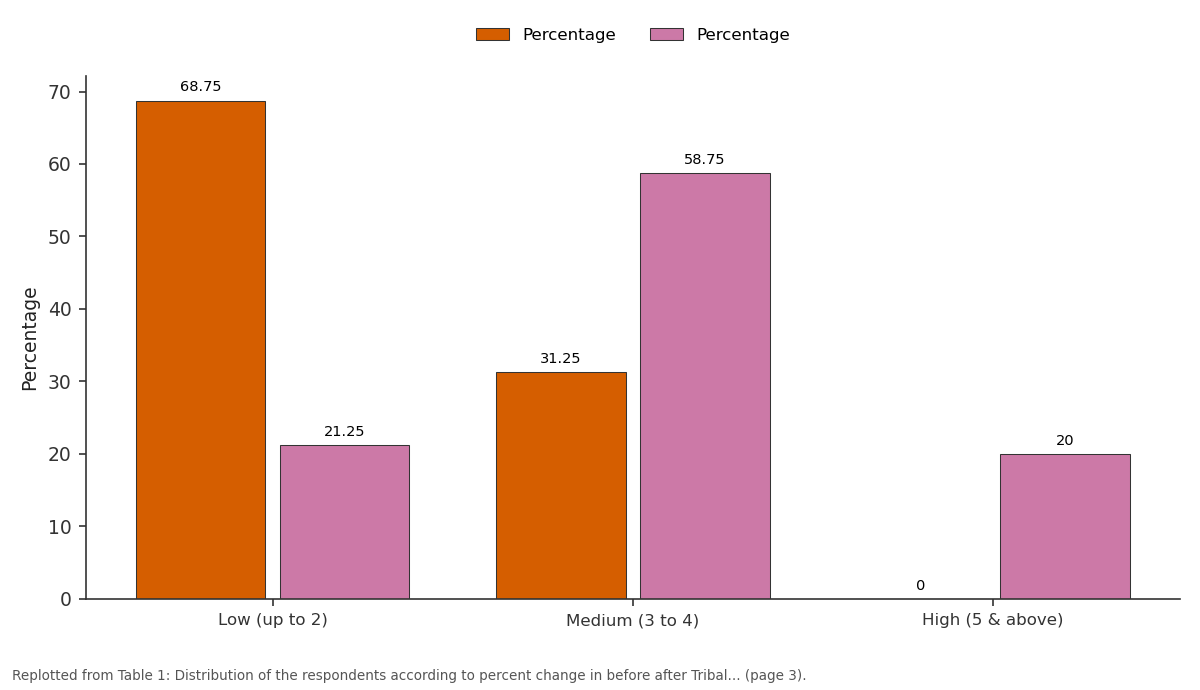
Percentage and Percentage: Low (up to 2) vs Medium (3 to 4) vs High (5 & above)
Replotted from Table 1 (page 3) of the original paper. Every bar is the paper's own table value.
View source evidence ↗Figures & tables
From the original paper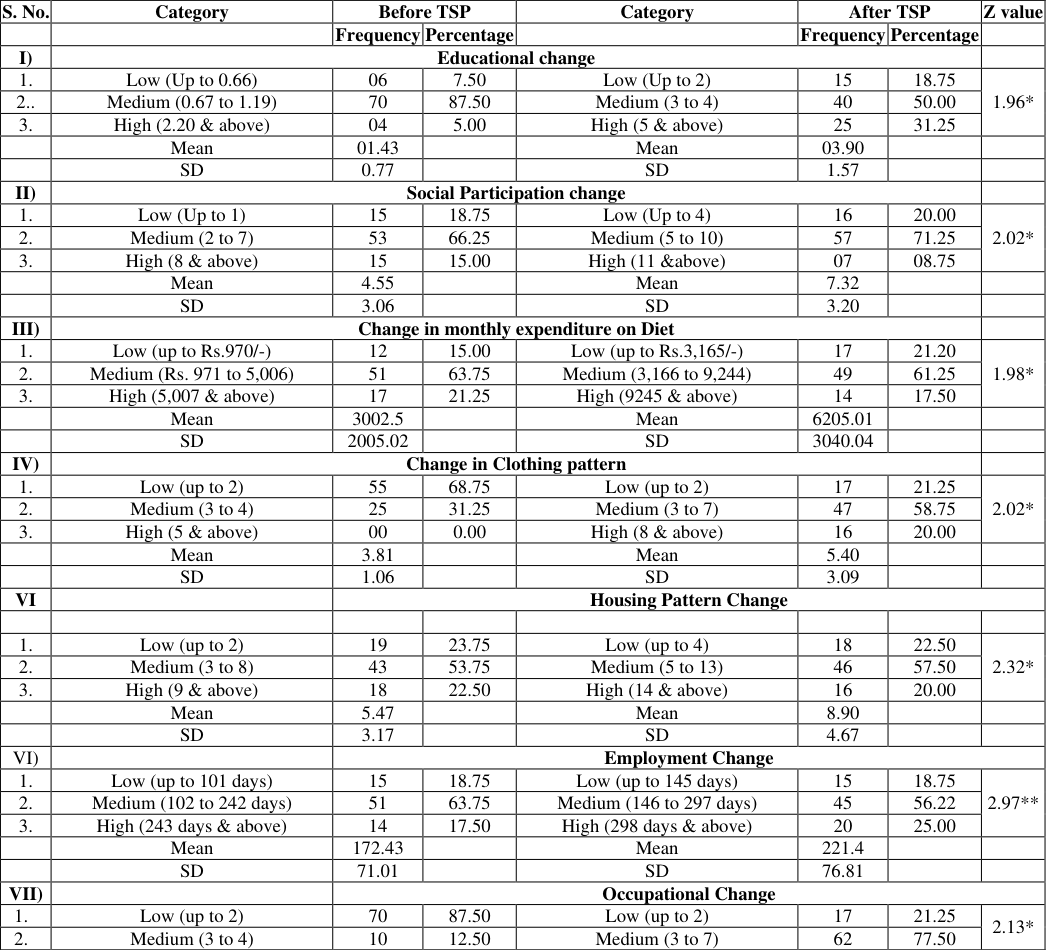 Table 1
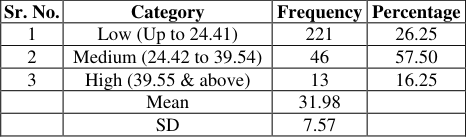 Table 2
Introduction
In India, tribal people are often called "Adivasi" and the government recognizes them as scheduled tribes (STs). Scheduled Tribes (STs) and Scheduled Castes (SCs) are the disadvantaged sections of the society due to socio-economic exploitation and isolation since times immemorial. According to the Census of 2011, the ST population in India was 104.5 million, accounting for 8.63 percent of the total population of the country. The tribal population in Maharashtra in 2011 was 10.5 million constituting 9.35 percent of the total population of the state. The state has the second largest tribal population in the country, next to Madhya Pradesh, with 10 percent of the total ST population of India. Though the ST population in India is numerically less as compared to the general population, they deserve special attention, as they are socio-economically and culturally backward and isolated from the general population. The tribes chiefly included in Maharashtra are Warli, Katkari, Gond, Bhill, Madia Gond, Rajgond, Thakar, etc. Upliftment and inclusion of tribals in mainstream development have been the cherished goal of the national policy. After 25 years of independence and by the end of the fourth Five-Year Plan (1969-1974), it was found that the Scheduled Tribes continued to lag in the mainstream development processes. In order to overcome this shortcoming, the Tribal Sub-Plan (TSP) was initiated during the Fifth Five-Year Plan (1974-79) was developed exclusively for the socio-economic upliftment of the tribal communities. Another study in ITDP Songadh in South Gujarat pointed out that multiple schemes do not necessarily mean or even seek to bring integrated Tribal Development. In the early days of TSP, the need of involving NGOs and social workers was brought out while evaluating TSP performance in Maharashtra (Kulkarni 1977: 34-43). According to Solanki et al (1980) [10] In Gujarat, there are 9 ITDP areas (including the Dang) with 43 blocks, 17 pockets and 4 clusters. The once dispersed tribes too are now covered under TSP. Separate plans for five primitive tribes are also prepared. The TASP and plans for dispersed tribes combined is known as TSP.
As regard the strategies and programmes for tribal development in India, the studies at macro level include those of Roy & Burm (1994) [9] focused on tribal development strategies in Andhra Pradesh. It was observed in these studies that the results achieved under TSP strategy are not commensurate with the expectations as well as investments made so far. The states have been adopting different methodologies for want of clear guidelines. Further, there has been too much emphasis on quantitative investments rather than qualitative achievements. The tribal development under TSP probes in to agriculture and allied activities by providing minor and medium irrigation facilities, animal husbandry, dairying, poultry and promote agricultural production and small scale industry. The arrival of monsoon is not timely. Dry spell is also common in the month of July and August, withdrawal of monsoon is also before the end of monsoon season. Under such situation, dry land agriculture experiences the problem of moisture availability for optimum crop production. Protective irrigation in kharif and judicious use of available water for irrigation through advanced irrigation technology is the need of hour particularly at technology poor tribal areas. Taking in to consideration the above facts/situation, VNMKV has operated project in tribal village by providing minor and medium irrigation facilities, animal husbandry, dairying, poultry etc. In selected village Wai, Tq. Kalamnuri, Dist. Hingoli, the method of irrigation in use was flood & productivity of the major crops grown was low. Farmers are following conventional cropping pattern of the region i.e. soyabean/ pigeon pea cotton/ wheat/ and ground nut in summer. Very few farmers were cultivating vegetables and fruit crops. The soil is light medium with undulating toporgraphy and predominant with hilly area. Present study was conducted with the following specific objectives.
Objectives
To assess the socio-economic impact of Tribal Sub Plan project beneficiaries.
Materials and Methodology
The present study is an attempt to assess the impact of Tribal sub plan project implemented by VNMKV, Parbhani on tribals. The Village Wai was purposively selected for the present study as the TSP project was implemented in Wai village Taluka-Kalamnuri, District-Hingoli by VNMIKV, Parbhani since 2014-15. Five interventions were selected viz. sprinkler set, bullock drawn multipurpose seed cum ferti drill, improved seeds of soybean, wheat and portable drip irrigation set. The village Wai is having cent percent tribal population i.e. 1538. For the assessment of impact of this projects the comparison between before and after situation was employed, 80 farmers who are beneficiaries of this project were selected randomly for present study. Interview schedule was constructed for collecting data by taking personal interviews at Wai village regarding interventions made by VNMKV. Data were subject to different statistical test viz., percentage & frequencies for tabulation. Z test was applied to see the comparison between before and after situation. Pearson's correlation coefficient (r) was also calculated to find out correlation between dependent and independent variables to see the nature of relationship existed.
Results and Discussion
Results and Discussion
Write conclusion in 100-120 following Socio-economic impact of Tribal Sub Plan (TSP) project Educational change
It was observed that before adoption of tribal sub plan majority 87.50 percent of the respondents belonged to medium level category followed by 7.50 percent respondents belonged to low level category of educational change and remaining 5.00 percent of the respondents belonged to high level category. Whereas 50.00 percent of the respondents belonged to medium level category of educational change and 31.25 percent of the respondents belonged to high level category of educational change after adoption of tribal sub plan. It is evident from table 2 that, comparative value of before adoption & after adoption of tribal plan (Z -Value) is 1.96 which was positively significant.
| Sr. No. | Category | Frequency | Percentage |
|---|---|---|---|
| 1 | Low (Up to 24.41) | 221 | 26.25 |
| 2 | Medium (24.42 to 39.54) | 46 | 57.50 |
| 3 | High (39.55 & above) | 13 | 16.25 |
| Mean | 31.98 | ||
| SD | 7.57 |
Table text extracted from the original PDF; superscript letters are shown inline. The original table image is below.
View original table image
Change in monthly expenditure on diet
In this regard before tribal sub plan, 63.75 percent respondents were found in the medium category. while 21.25 percent were in high category. After the implementation of the project 61.25 percent respondents in medium category. The Z value is 1.98 and it is significant at 5 percent level.
Change in clothing pattern
Before project regarding this aspect 68.75 percent respondents belonged to low category followed by 31.25 percent from medium category. After the implementation of the project 58.75 percent respondents were found in medium category, which clearly indicates positive impact of project. The Z value is 2.02 and it is proved significant at 0.5 percent level.
Housing Pattern Change
In medium category 53.75 percent respondents were observed before project implementation, very little change was found in this aspect because after project change increased by only 4.00 percent (i.e. 57.50 percent). Z value is 2.32 which is significant.
Employment Change
Change in employment was 63.75 per in medium category before the project and after the project it was 56.22 percent, and in low category change was not found. However, in high category impact of project was seen. Z value is 2.97 which is significant at 1 percent level.
Occupational Change
Regarding this variable change was seen in the medium category i.e. before it was 12.50 percent and after it was 77.50 percent, drastic change was observed, which again shows the positive impact of tribal sub plan where Z value is 2.13.
Property change
In respect of property change, no high change was observed at any level and Z value is 1.36 which is non significant.
Annual Saving Change
Change in annual saving was found in the medium category, before it was 71.25 percent while, after it was increased upto 80.00 percent. This is a desirable change observed due to project, Z value is 1.96 which is significant.
Change in cropping area
In medium category, before it was 78.70 percent and after it was 75.00 percent which shows no change, before it was 10.00 percent in high category and after it was 12.50 percent, it is evidence that due to impact of project this change has been observed. The Z value was 1.58 and shows non significant change.
Change in Cropping Pattern
In medium category, before project 61.25 percent change in cropping pattern and after it was seen 67.50 percent and in the high category, before it was 13.75 percent and after it was 16.25 percent. Z value is 2.22 i.e. significant.
Change in Income
As income is important variable, in high category before 21.25 percent respondents were observed and after 26.20 percent respondents were seen. Here 5.00 percent increase was observed and which indicates the impact. Z value is 3.96 which is significant at 1.00 percent level.
Change in Productivity
When overall productivity was seen, in medium category before 61.25 percent respondents were observed and after 53.75 percent were seen. Z value is 2.07 which is significant. Overall socio-economic impact of TSP Table 2 indicates that majority (57.50 percent) of the respondents belonged to medium category of overall socioeconomic impact followed by 26.25 percent of the respondents belonged to low category and 16.25 percent belonged to high category.
Conclusion
In conclusion, the implementation of the Tribal Sub Plan (TSP) project has brought about significant socio-economic changes, particularly evident in educational advancement, social participation, expenditure patterns, housing, employment, occupational shifts, annual savings, cropping practices, and income levels among tribal communities. The analysis reveals a notable improvement in various parameters post-implementation, with statistically significant Z-values indicating the efficacy of the TSP project. These positive outcomes underscore the transformative impact of targeted developmental interventions in uplifting marginalized communities. However, some areas such as property changes and cropping area show non-significant alterations, suggesting areas for further intervention or improvement strategies. Overall, the findings emphasize the importance of continued support and tailored initiatives to foster sustainable development and enhance the well-being of tribal populations.
Figures and tables from the paper
| S. No. | Category | Before TSP | — | Category | After TSP | — | Z value |
|---|---|---|---|---|---|---|---|
| Frequency | Percentage | Frequency | Percentage | ||||
| I) | Educational change | ||||||
| 1. | Low (Up to 0.66) | 06 | 7.50 | Low (Up to 2) | 15 | 18.75 | 1.96* |
| 2.. | Medium (0.67 to 1.19) | 70 | 87.50 | Medium (3 to 4) | 40 | 50.00 | |
| 3. | High (2.20 & above) | 04 | 5.00 | High (5 & above) | 25 | 31.25 | |
| Mean | 01.43 | Mean | 03.90 | ||||
| SD | 0.77 | SD | 1.57 | ||||
| II) | Social Participation change | ||||||
| 1. | Low (Up to 1) | 15 | 18.75 | Low (Up to 4) | 16 | 20.00 | 2.02* |
| 2. | Medium (2 to 7) | 53 | 66.25 | Medium (5 to 10) | 57 | 71.25 | |
| 3. | High (8 & above) | 15 | 15.00 | High (11 &above) | 07 | 08.75 | |
| Mean | 4.55 | Mean | 7.32 | ||||
| SD | 3.06 | SD | 3.20 | ||||
| III) | Change in monthly expenditure on Diet | ||||||
| 1. | Low (up to Rs.970/-) | 12 | 15.00 | Low (up to Rs.3,165/-) | 17 | 21.20 | 1.98* |
| 2. | Medium (Rs. 971 to 5,006) | 51 | 63.75 | Medium (3,166 to 9,244) | 49 | 61.25 | |
| 3. | High (5,007 & above) | 17 | 21.25 | High (9245 & above) | 14 | 17.50 | |
| Mean | 3002.5 | Mean | 6205.01 | ||||
| SD | 2005.02 | SD | 3040.04 | ||||
| IV) | Change in Clothing pattern | ||||||
| 1. | Low (up to 2) | 55 | 68.75 | Low (up to 2) | 17 | 21.25 | 2.02* |
| 2. | Medium (3 to 4) | 25 | 31.25 | Medium (3 to 7) | 47 | 58.75 | |
| 3. | High (5 & above) | 00 | 0.00 | High (8 & above) | 16 | 20.00 | |
| Mean | 3.81 | Mean | 5.40 | ||||
| SD | 1.06 | SD | 3.09 | ||||
| VI | Housing Pattern Change | ||||||
| 1. | Low (up to 2) | 19 | 23.75 | Low (up to 4) | 18 | 22.50 | 2.32* |
| 2. | Medium (3 to 8) | 43 | 53.75 | Medium (5 to 13) | 46 | 57.50 | |
| 3. | High (9 & above) | 18 | 22.50 | High (14 & above) | 16 | 20.00 | |
| Mean | 5.47 | Mean | 8.90 | ||||
| SD | 3.17 | SD | 4.67 | ||||
| VI) | Employment Change | ||||||
| 1. | Low (up to 101 days) | 15 | 18.75 | Low (up to 145 days) | 15 | 18.75 | 2.97** |
| 2. | Medium (102 to 242 days) | 51 | 63.75 | Medium (146 to 297 days) | 45 | 56.22 | |
| 3. | High (243 days & above) | 14 | 17.50 | High (298 days & above) | 20 | 25.00 | |
| Mean | 172.43 | Mean | 221.4 | ||||
| SD | 71.01 | SD | 76.81 | ||||
| VII) | Occupational Change | ||||||
| 1. | Low (up to 2) | 70 | 87.50 | Low (up to 2) | 17 | 21.25 | 2.13* |
| 2. | Medium (3 to 4) | 10 | 12.50 | Medium (3 to 7) | 62 | 77.50 |
Table text extracted from the original PDF; superscript letters are shown inline. The original table image is below.
View original table image
References
3 in the original paper- Bhatt V. Tribal Sub Plan for Korgas. Yojna. 1982;26(23).
- Gopalkrishnan NS. Impact of Welfare Schemes on Kannikars: An Empirical Study. Cochin University Law Review. 1985;DC:237-258.
- Gerstenberger D, Solanki R, Collins G. Hollow cathode metal ion lasers. IEEE Journal of Quantum Electronics. 1980 Aug;16(8):820-834.
Social Participation Change
Regarding social Participation change it was observed that before adoption of tribal sub plan majority 66.25 percent belonged to medium category and only 18.75 percent respondents were in low category. While, after adoption of tribal sub plan project 71.25 percent were in the medium category, it indicated that 20.00 percent change has been recorded in the low social participation category. In this aspect Z value is 2.02 and it is significant at 5 percent level.