
Research article · 2024 · Full text
International Journal of Agriculture Extension and Social DevelopmentEvaluation of credit flow from Karnataka Vikas Grameena Bank
Volume 7(1S) · Pages 93–96 · DOI: 10.33545/26180723.2024.v7.i1sb.396 ↗
Research areasIndian Economic and Social DevelopmentBanking Sector Performance and Management
Abstract
Author-writtenCredit plays a pivotal role in overall development of agriculture and allied activities. Growth in agriculture sector is directly influenced by flow of credit to the rural beneficiaries. The main objective of regional rural banks in India is to advance credit and other facilities, especially to small and marginal farmers, agricultural labourers, artisans and small entrepreneurs in order to develop agriculture, trade, commerce, industry and other usual productive activities in different rural areas of the country. In order to identify the pattern of the flow of finance in Karnataka Vikas Grameena Bank, both beneficiary wise and purpose wise, the techniques of Kendall’s coefficient of concordance (W) was used. The data on the flow of credit, beneficiary wise and purpose wise related to the period of 2005-06 to 2013-14. In a favorable crop year more number of farmers borrowed the funds and make investments in land development and crop production and vice-versa in a bad season. As a result the variation was relatively less. In case of beneficiary wise flow of credit, the variation in MSME was higher due to the fact, advances under government sponsored programmes as loans for MSME increased due to participation of the bank in these programmes led to higher variation. The least variation was observed in the case of SF/MF/AL because it is mandatory to meet certain fixed percent of advances under priority sector. In degree of concentration of credit, the inequality values were found to be lower, both in purpose wise and beneficiary wise in the individual years as well as in the overall period, yet the degree of inequality was found to be relatively lower in the case of flow of purpose wise credit than beneficiary wise flow of credit. It is advocated that the bank has to pay little more attention in the beneficiary wise flow of credit so as to attain greater equality in the distribution of credit.
Summary
Source-checkedPlain-language reading of the full paper, prepared with AI and checked against the text. Each point links to the authors' own words.
Why it matters
- The primary goal of RRBs is to provide credit to small farmers, laborers, artisans, and entrepreneurs to foster rural development in agriculture and industry. View evidence ↗
- A rural credit system is essential because many Indian rural families lack sufficient savings to fund their farming and economic activities. View evidence ↗
What they did
- The researchers analyzed credit flow data categorized by beneficiary and purpose for the period from 2005-06 to 2013-14. View evidence ↗
- Kendall’s coefficient of concordance (W) was used to identify patterns in the flow of finance by beneficiary and purpose. View evidence ↗
- The Gini coefficient was employed to analyze whether the bank concentrated its credit on specific purposes or beneficiaries over the study period. View evidence ↗
What they found
- Crop loans were the most common, accounting for 43.95% of borrower accounts, while artisan/craftsman/SSI units had the fewest at 1.03%. View evidence ↗
- Small farmers, marginal farmers, and agricultural laborers (SF/MF/AL) represented the largest group of borrowers at 50.50%, while MSMEs were the smallest at 5.17%. View evidence ↗
- Beneficiary-wise credit flow showed the highest variation in MSME (93.08%) and the lowest in SF/MF/AL and women beneficiaries (11.42%). View evidence ↗
- Inequality in purpose-wise credit distribution slightly decreased (0.41 to 0.39), but beneficiary-wise inequality increased from 0.48 in 2005-06 to 0.54 in 2013-14. View evidence ↗
- Over the entire study period, the overall Gini coefficients were 0.43 for purpose-wise and 0.47 for beneficiary-wise credit flow. View evidence ↗
What it means
- The authors recommend that the bank focus more on the beneficiary-wise flow of credit to achieve a more equitable distribution. View evidence ↗
Visual summary
3 visualsIllustrations explain the paper; charts are replotted from the paper's own table values.
Credit Distribution Overview
AI-generated conceptual illustration (A rural regional bank building and agricultural landscapes). It explains the idea and does not show study data.
View source evidence ↗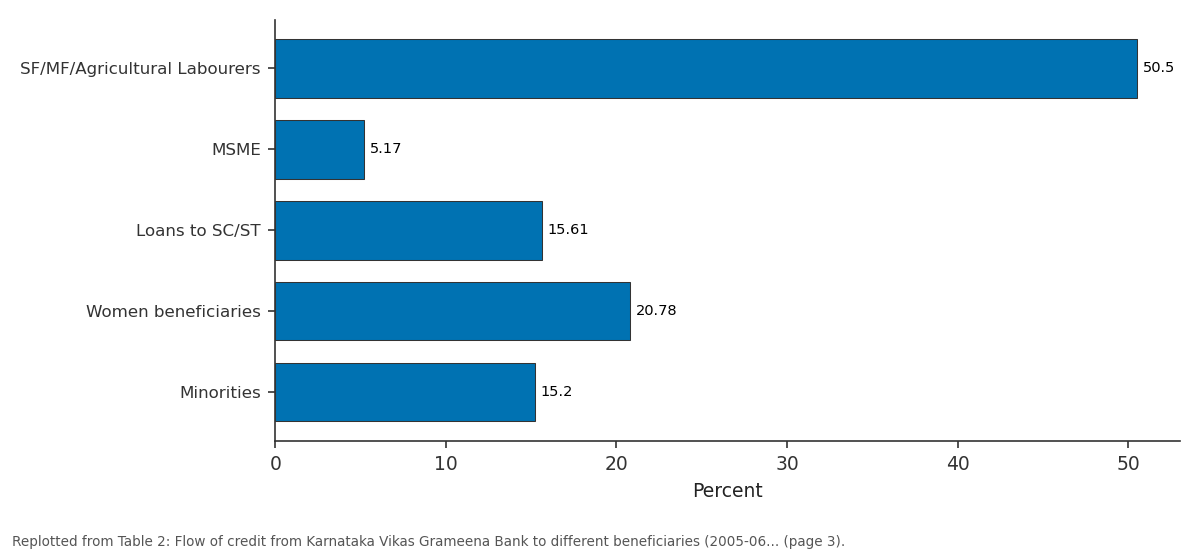
Accounts / Percent: SF/MF/Agricultural... vs MSME vs Loans to SC/ST vs Women beneficiaries vs Minorities
Replotted from Table 2 (page 3) of the original paper. Every bar is the paper's own table value.
View source evidence ↗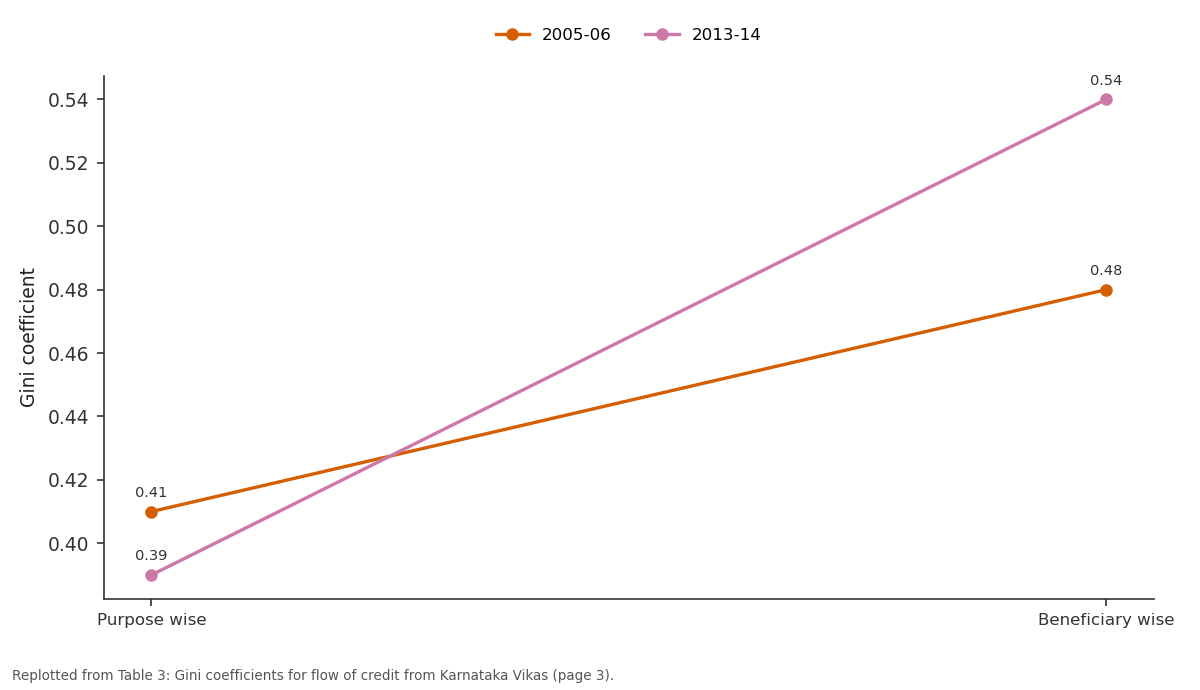
2005-06 and 2013-14: Purpose wise vs Beneficiary wise
Replotted from Table 3 (page 3) of the original paper. Every bar is the paper's own table value.
View source evidence ↗Figures & tables
From the original paper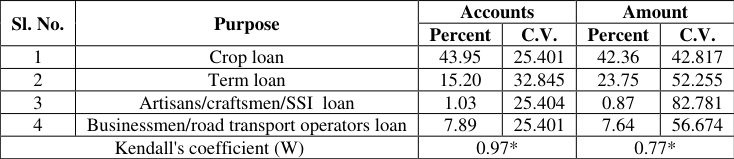 Table 1
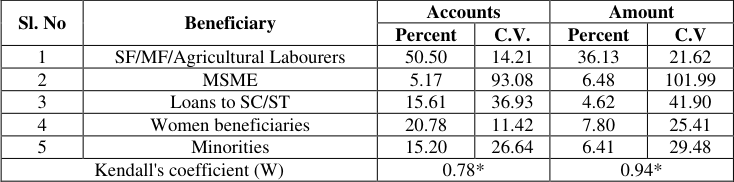 Table 2
 Table 3
Introduction
The Regional Rural Banks (RRBs) have been receiving a high degree of importance and attention in the rural credit system. The regional rural banks were established in 1975 for supplementing the commercial banks and co-operatives in supplying rural credit. The main objective of regional rural banks in India is to advance credit and other facilities, especially to small and marginal farmers, agricultural labourers, artisans and small entrepreneurs in order to develop agriculture, trade, commerce, industry and other usual productive activities in different rural areas of the country. The institutional credit system is critical for agricultural development and its role has further increased in the liberalized economic environment. Agricultural policies have been reviewed from time to time to provide adequate and timely availability of finance to this sector. Rural credit system assumes importance because for most of the Indian rural families, savings are inadequate to finance farming and other economic activities. Credit plays a curtail role in overall development of agriculture and allied activities. Growth in agriculture sector is directly influenced by flow of credit to the rural beneficiaries. The present investigation is aimed at examining the extent of flow of credit from Karnataka Vikas Grameena Bank, Dharwad to various beneficiaries and the degree of concentration on a particular borrower over the years. This would help the administrators and policy matters to bring desired changes in the allocation pattern of credit among different types of borrowers of the bank to attain equitable distribution of available credit facilities.
Methodology
In order to identify the pattern of the flow of finance in Karnataka Vikas Grameena Bank, both beneficiary wise and purpose wise, the techniques of Kendall's coefficient of concordance (W) was used. The data on the flow of credit, beneficiary wise and purpose wise related to the period of 2005-06 to 2013-14. Ranks were assigned for each year based on the magnitude of credit among the beneficiaries as well among the purposes. The Kendal's coefficient of concordance was given by. The Kendall's coefficient of concordance follows a Chisquare distribution with (n-1) degrees of freedom. The significance of this coefficient implies that there was agreement among the rankings (years) and thus no change in the pattern of loans advanced. After analyzing the pattern of flow of credit, if there was a significant high value of Kendall's coefficient of concordance, indicating that there was agreement in the ranking of different years, which implied no change in the pattern of flow of credit, both beneficiaries and purpose wise. Then over the years whether the bank has been concentrating on a particular beneficiary or particular purpose was analyzed with the help of Gini coefficient (Rao and Bhat, 1985) as given below.
Where, x i = Purpose wise / Beneficiary wise accounts y i = Credit distribution (` in lakhs)
Higher values of the coefficient indicate that there was concentration by the bank on a particular beneficiary/purpose.
Result and Discussion
As could be seen from the table 1 that the crop loan accounts (43.95%) dominated among all borrowers accounts followed by the accounts relating to term loan (15.20%), businessman/small road transport operators (7.89%) and the least was artisan/craftman/SSI unit (1.03%). This clearly showed the concern of the bank in agricultural development, especially crop output by way of financing to more number of farmers. As seen from the raw data, no particular trend was found in the purpose wise credit flow over the years. However, from 2008-09 to 2013-14, based on the year wise data, the share of crop loan and term loan accounts increased at a higher rate, whereas the businessmen/small road transport operators and artisans, craftsman and small scale industries units' accounts increased marginally. This was mainly due to the focusing on non-target group lending where in the bank advancing more to other non-target groups for non-agricultural purposes. A similar trend was observed in respect of amount of advances for various purposes. Due to decline in the borrower accounts, the advances extended to some other purposes declined on one hand, and on the other hand the focusing on non-target group lending and due to higher unit cost lending in the case of artisans, small scale industries and craftsman lead to decline in the amount advanced for these purposes. In order to know whether the bank has changed its lending operations with changed technology, Kendall's coefficient of concordance (W) was computed for both the purpose wise accounts and amount flow. The coefficients were worked out to be 0.97 and 0.77 for purpose wise accounts and amount flow respectively and found significant at one percent. This implied that there was agreement among the rankings (years) and thus no changes in the pattern of purpose wise credit flow. The study conducted by Swami (2010) [5] on post reforms period trends in deposit and credit deployments of regional rural banks in Karnataka also revealed similar results, that there was agreement among the rankings (years) and thus no change in the pattern in sector-wise credit distribution/flow by regional rural banks over the study period. Year to year variation was observed in the purpose wise flow of credit both in terms of accounts and amount as evident from the value of coefficient of variation. The variation was observed to be higher in the case of term loan accounts (15.97%) followed by crop loan, artisans/craftsmen/SSI and businessmen/road transport operators units in terms of accounts, all the revolving around 15.45 percent of variation. With regard to the amount of advances, the variation was observed to be higher in the case of artisans/craftsmen/SSI (45.79%) followed by businessmen/road transport operators (14.79%), crop loan accounts (10.20%) and least variation was seen in term loans (9.21%). The reasons for lower variation in crop loan and term loan could be attributed to influence of favorable and adverse climatic conditions related to agricultural production. In a favorable crop year more number of farmers borrowed the funds and make investments in land development and crop production and vice-versa in a bad season. As a result the variation was relatively less. On the contrary the variation in artisans/craftsmen/SSI units and business men/SRTO were very high, because these were not exposed to natural calamities on one hand and on the other, the finance was provided on a unit cost basis for these activities and also introduction of advance schemes for artisans/craftsmen/SSI units and business men/SRTO.
| Sl. No. | Purpose | Accounts | — | Amount | — |
|---|---|---|---|---|---|
| Percent | C.V. | Percent | C.V. | ||
| 1 | Crop loan | 43.95 | 25.401 | 42.36 | 42.817 |
| 2 | Term loan | 15.20 | 32.845 | 23.75 | 52.255 |
| 3 | Artisans/craftsmen/SSI loan | 1.03 | 25.404 | 0.87 | 82.781 |
| 4 | Businessmen/road transport operators loan | 7.89 | 25.401 | 7.64 | 56.674 |
| Kendall's coefficient (W) | 0.97* | 0.77* |
Table text extracted from the original PDF; superscript letters are shown inline. The original table image is below.
View original table image
Beneficiary wise flow of credit
A glance at table 2 indicated that the SF/MF/AL accounts (50.50%) were higher among the borrower accounts. This was followed by women beneficiaries (20.78%), loans to SC/ST (15.61%), minorities (15.20%) and MSME (5.17%). From 2005-06 to 2013-14 (Appendix VII), the borrower accounts of SF/MF/AL and MSME were increased at a higher rate compared to others borrowers' accounts. The higher number of SF/MF/AL accounts and MSME accounts indicated the importance given by the bank for financing the SF/MF/AL which includes agriculture and other divisions to undertake agricultural crop production activities for increasing total agricultural production, because agriculture has been the dominant sector in the Indian economy which had interlinkages with other sectors, and another reason was that very recently the bank has started advancing to non-target groups as a result the growth rate in this category was very low in the total population and due to non-viability of their operations they were not coming forward to borrow the funds for their activities because agricultural implements and other have been used by many of the farmers either by owning or hiring, thus the potential of these craftsmen or artisans has been lowered. It was observed that the amount advanced to SF/MF/AL registered an increase. The reason that could be attributed were the tradition of the bank which has been financing large number of small farmers and recent introduction of non-target groups lending increased marginally the other category beneficiaries. The minorities, loans to SC/ST and women beneficiaries www.extensionjournal.com advances increased as they succeed to make their presence felt in the rural areas due to modernization of agriculture. The advances to total weaker sections was also on increasing accounts and but slightly declined in amount, it was due to amount per unit declined but more number of new accounts were opened over the years to provide financial assistance to the weaker sections by advancing. In order to know whether the bank has changes in its lending operations to various beneficiaries with the changed circumstances, the Kendall's coefficient of concordance (W) were computed for both number of beneficiary accounts and amount of advances. The coefficients were worked out to be 0.78 and 0.94, which were found significant at one percent level. This indicated no change in the pattern of advances for different types of beneficiaries. The year to year variations in beneficiary wise flow of credit both accounts and amount were worked out. The values indicating a higher level of variation on MSME (93.08%), loans to SC/ST (36.93%), minorities (26.64%) and the least variation was observed in the case of SF/MF/AL and women beneficiaries (11.42%). In terms of variation in advances, it was highest in the case MSME (101.92%), loans to SC/ST (41.90%) and minorities (29.48%). The least variation was observed in the case of women beneficiaries (25.41%) and SF/MF/AL (21.62%). The variation in MSME was higher due to the fact that these categories get advances under government sponsored programmes as loans for MSME increased due to participation of the bank in these programmes led to higher variation. The least variation was observed in the case of SF/MF/AL because it is mandatory to meet certain fixed percent of advances under priority sector.
| Sl. No | Beneficiary | Accounts | — | Amount | — |
|---|---|---|---|---|---|
| Percent | C.V. | Percent | C.V | ||
| 1 | SF/MF/Agricultural Labourers | 50.50 | 14.21 | 36.13 | 21.62 |
| 2 | MSME | 5.17 | 93.08 | 6.48 | 101.99 |
| 3 | Loans to SC/ST | 15.61 | 36.93 | 4.62 | 41.90 |
| 4 | Women beneficiaries | 20.78 | 11.42 | 7.80 | 25.41 |
| 5 | Minorities | 15.20 | 26.64 | 6.41 | 29.48 |
| Kendall's coefficient (W) | 0.78* | 0.94* |
Table text extracted from the original PDF; superscript letters are shown inline. The original table image is below.
View original table image
Degree of concentration of credit (Gini coefficient analysis)
The Gini coefficients were worked out for both purpose wise and beneficiary wise flow of credit to know the degree of inequality in the distribution of credit among different purposes and beneficiaries, the results of which are presented in the table 3. The purpose was to know whether the bank has concentrated on a particular purpose or beneficiary for disbursement of credit. The Gini coefficient or inequality index has considered from 0.41 in the year 2005-06 to 0.39 in the year 2013-14 in case of purpose wise distribution of credit. For the beneficiary wise flow of credit the coefficients were found to be 0.48 in the year 2005-06 and 0.54 in the year 2013-14 which indicated the overall increase in the inequality. The Gini coefficients for the overall period of 2005-06 to 2013-14 worked out to be 0.43 and 0.47 for purpose wise and beneficiary wise flow of credit respectively. This clearly indicated that the bank has disbursed the credit facilities among different purposes and beneficiaries inequitably and concentrated in a particular purpose or beneficiary. These results are on par with Swamy (2014) [4] findings of the study trends, performance and disparity in the flow of institutional credit to agriculture in India and found that the Gini coefficient (index) was 0.146 (14.6%) imparting the inequality in the distribution of credit across the region in India was up to 14.56 percent during the study periods. Though the inequality values were found to be lower, both in purpose wise and beneficiary wise in the individual years as well as in the overall period, yet the degree of inequality was found to be relatively lower in the case of flow of purpose wise credit than beneficiary wise flow of credit. It is advocated that the bank has to pay little more attention in the beneficiary wise flow of credit so as to attain greater equality in the distribution of credit.
| Sl. No. | Particulars | 2005-06 | 2013-14 | 2005-06 to 2013-14 |
|---|---|---|---|---|
| 1 | Purpose wise | 0.41 | 0.39 | 0.43 |
| 2 | Beneficiary wise | 0.48 | 0.54 | 0.47 |
Table text extracted from the original PDF; superscript letters are shown inline. The original table image is below.
View original table image
Conclusion
The reasons for lower variation in crop loan and term loan could be attributed to influence of favorable and adverse climatic conditions related to agricultural production. In a favorable crop year more number of farmers borrowed the funds and make investments in land development and crop
References
4 in the original paper- Gandhimathi S. Distribution of agricultural credit in the pre and post reform period. Int. J Mngt. IT and Engg., 2012;2(9):243-253
- Rao, Aruna K, Bhat ARS, Bhatta R. A methodology to measures the efficiency of business organization. Indian Co-op. Rev. 1991;28(3):237-244.
- Swamy PSD, Chinnappa B, Umesh KB. Trends, performance and disparity in the flow of institutional credit to agriculture in India. Mysore J. Agril. Sci. 2014;48(3):443-450.
- Swami V, Chamorro-Premuzic T, Furnham A. Unanswered questions: A preliminary investigation of personality and individual difference predictors of 9/11 conspiracist beliefs. Applied cognitive psychology. 2010 Sep;24(6):749-761.