
Research article · 2024 · Full text
International Journal of Agriculture Extension and Social DevelopmentPerformance evaluation of Karnataka Vikas Grameena Bank branches
Volume 7(1S) · Pages 97–100 · DOI: 10.33545/26180723.2024.v7.i1sb.397 ↗
Research areasBanking Sector Performance and ManagementIslamic Finance and Banking StudiesAgricultural Economics and Practices
Abstract
Author-writtenKarnataka Vikas Grameena Bank branches purposively selected for the study. Scaling technique was adopted for analysis of the data. Information on twenty indicators comprising physical and financial variables were collected for the year 2013-14 from eighteen branches. The depicted seven branches were grouped under good category, five branches were under satisfactory and six under poor category. It was found that there was significant difference in the mean of the two groups’ namely good and satisfactory categories for the variables such as, deposit accounts, advance accounts and total business accounts. In case of satisfactory and poor category branches has been no significant difference. The significant difference was observed between good and poor branches for all the variables except advances accounts per employee.
Summary
Source-checkedPlain-language reading of the full paper, prepared with AI and checked against the text. Each point links to the authors' own words.
Why it matters
- Traditional performance evaluation methods like ratio analysis and audit classification are often limited because they only consider a few aspects of growth, making comprehensive conclusions difficult. View evidence ↗
- There is a need for a scaling technique that can incorporate multidimensional aspects of performance to better measure institutional efficiency. View evidence ↗
The question
- The study aims to use a scaling technique to measure the efficiency of Regional Rural Bank (RRB) branches by categorizing them as good, satisfactory, or poor. View evidence ↗
What they did
- The study applied a multidimensional scaling methodology originally developed by Aruna Rao et al. (1991) for business organizations to classify the bank branches. View evidence ↗
- A t-test was used to determine if the scale could effectively discriminate between poor-performing and good-performing branches. View evidence ↗
What they found
- Average percentile scores varied by category: good branches ranged from 84.77 to 56.28, satisfactory from 55.12 to 43.33, and poor from 33.16 to 13.62. View evidence ↗
- A significant mean difference was found between good and satisfactory branches regarding total business accounts, advance accounts, and deposit accounts. View evidence ↗
- Good and poor branches showed significant mean differences in almost all physical variables, including staff and total business accounts, except for advance accounts per employee. View evidence ↗
- No significant differences were found across any financial variables when comparing good vs. satisfactory or satisfactory vs. poor branches. View evidence ↗
- Satisfactory branches actually had higher mean values for productivity and deposit per employee than both good and poor branches. View evidence ↗
What it means
- The authors conclude that the adopted scaling methodology is an effective tool for measuring branch efficiency and categorizing performance. View evidence ↗
- The authors note that the effectiveness of this methodology depends on the exhaustive and careful selection of variables. View evidence ↗
Visual summary
2 visualsIllustrations explain the paper; charts are replotted from the paper's own table values.
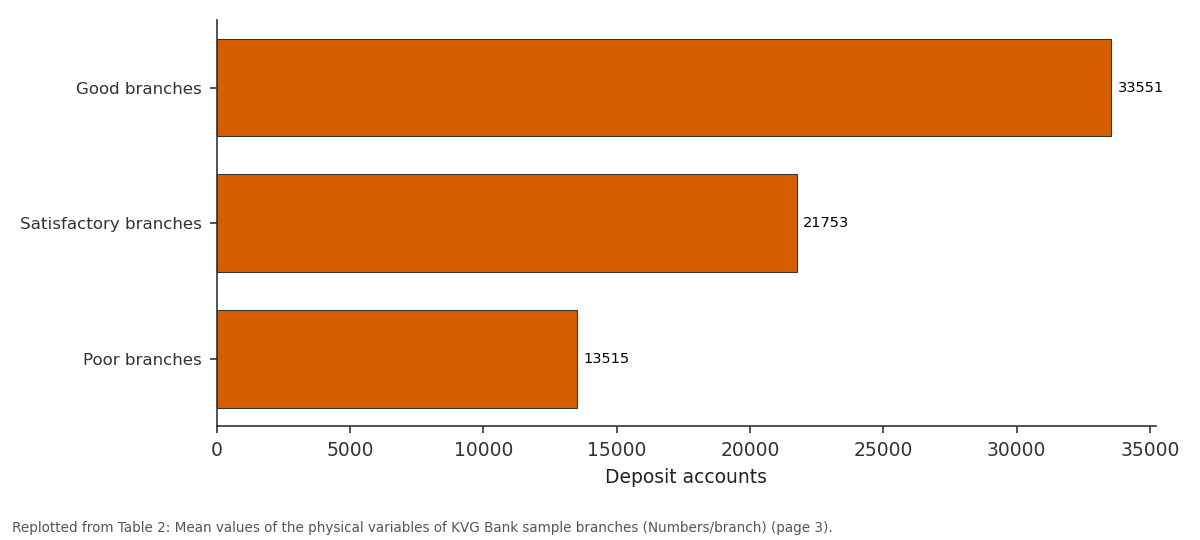
Deposit accounts: Good branches vs Satisfactory branches vs Poor branches
Replotted from Table 2 (page 3) of the original paper. Every bar is the paper's own table value.
View source evidence ↗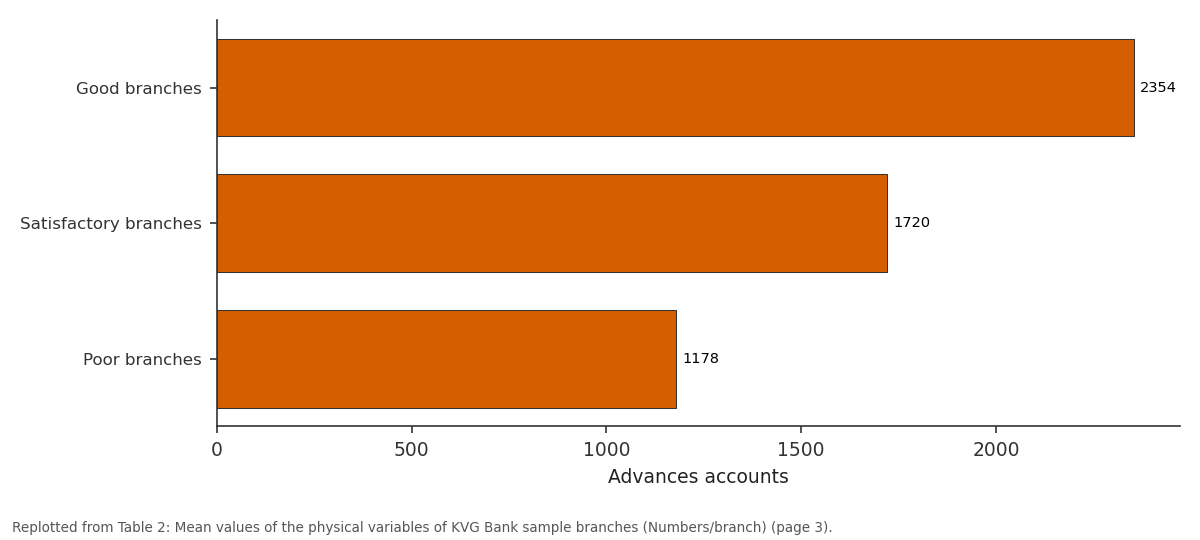
Advances accounts: Good branches vs Satisfactory branches vs Poor branches
Replotted from Table 2 (page 3) of the original paper. Every bar is the paper's own table value.
View source evidence ↗Figures & tables
From the original paper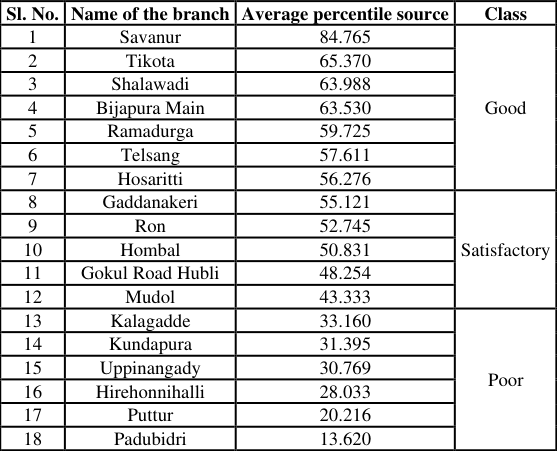 Table 1
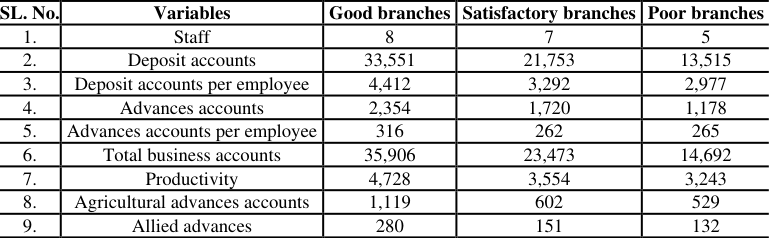 Table 2
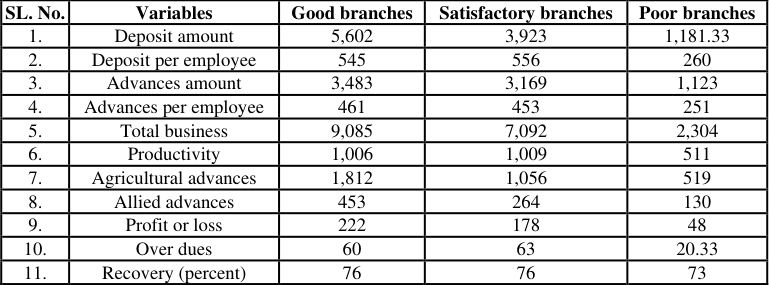 Table 3
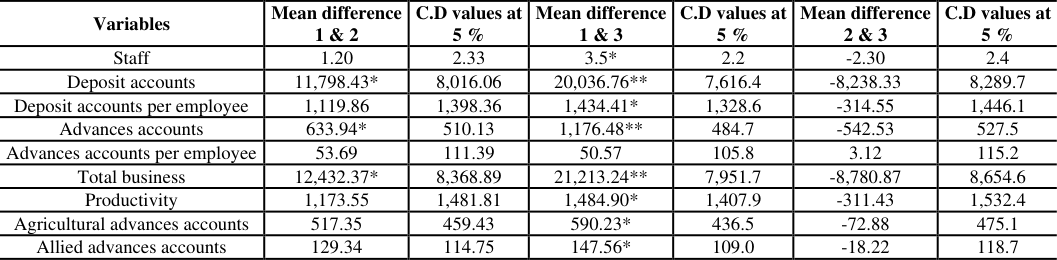 Table 4
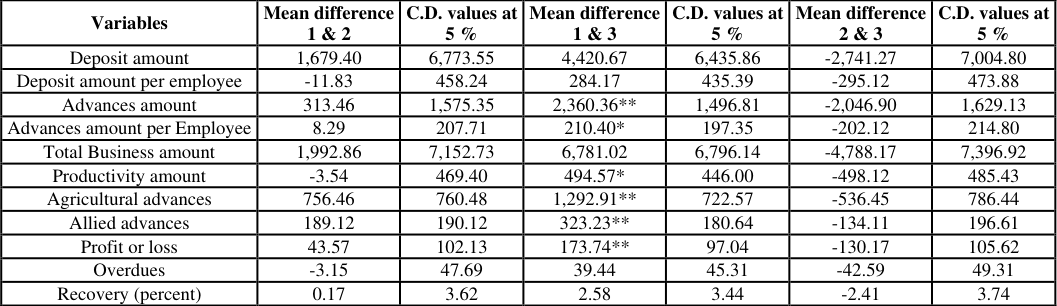 Table 5
Introduction
Generally, the ratio analysis and audit classification are the prominent methods considered for evaluation of the performance. However, these methods take into consideration only one or two aspects of growth in measuring the efficiency of institutions and it becomes very difficult to arrive at a concrete conclusion about the comprehensive performance. The above mentioned facets, necessitated to develop a methodology (scaling technique) which can incorporate multidimensional aspects of performance. The scale is expected to measure the efficiency of RRBs branches by grouping them as good, satisfactory and poor.
Materials and Methods
A sample of eighteen branches of Karnataka Vikas Grameena Bank, Dharwad, in Karnataka state were selected randomly and information on 20 development indicators both physical and financial were collected for the year 2013-14. The variables were identified based on the discussion held in the interaction session conducted by the researcher with senior officials of the bank. The scale developed (Aruna Rao et al., 1991) [5] for the purpose of measuring the performance of business organizations which incorporates multidimensional aspects of the performance has been applied to financial institutions to classify the selected branches of Karnataka Vikas Grameena Bank into good, satisfactory and poor. Let there be 'n' branches and 'K' variables which indicate the performance of the branches. The 'K' variables will be grouped into 'r' classes. The basis of classification being that within a class the variables combined together measure the particular dimension of development. Let X ij denote the realized value for i th branch for the j th variable (i=1 to n and j=1 to K). The first step in the construction of scale relates to the conversion of the realized values of each variable for each branch into percentile (or centile) scores using the assumption of normal distribution. Thus for the i th branch the realized value X ij will be transformed into a percentile score Pij by the relation.
The actual steps of computation of P ij value are as follows. a) Compute the mean M j and standard deviation r j for j th variable. b) Transform the x ij into standard normal variate Z ij by the relation.
(2) r j c) Read the area below the Z ij by referring to the table of area under normal curve. d) Compute the average percentile score for each class and let 'M ik ' denote the average score for i th branch for K th class (k = 1 to r). e) Then the scale volume for the i th branch is given by www.extensionjournal.com r r
Where, S i = Scale value for the i th branch W k = Weights attached to the k th class M k = Percentile score for each class vi. The branches can be classified into three groups, then the cutoff point can be shown as follows. a) Those branches which come under the scale value of less than mean -0.425 standard deviation can be considered as poor performing branches. b) Those branches which come under the scale values between mean -0.425 standard deviation and mean + 0.425 standard deviation can be considered as satisfactory branches. c) Those branches which fail under the scale values of more than mean + 0.425 standard deviation can be considered as good performing branches.
Here the mean and standard deviation refers to the mean scale values for 'n' branches given by RS i /n and variance E(S i -S)2/(n-1). The selected variables for all the branches were converted into standard normal variety were recorded using equation-2. Then these percentile scores of all the twenty variables were added for each branch. Thus, the branches were regrouped in descending order based on the total area for all variables of each branch and classified into three groups as good, satisfactory and poor. The't' test was carried out to find out the viability of the scale on discriminating poor performing branches with the good performing branches.
Results and Discussion
The percentile scores of branches and their classification is presented in the table They were deposit accounts and total business accounts. However, no significant difference was seen between satisfactory and poor branches with respect to any variables.
In the case of financial indicators (Table 5) four variables namely advance amount, advance amount per employee, productivity amount, agricultural advances, allied advances and profit or loss were found to be significantly discriminating the good and poor performing branches. The remaining financial variables such as deposit amount, deposit amount per employee, total business amount, overdues and recovery percent were found to be nonsignificant. No significant difference was observed between good and satisfactory branches and also in case of satisfactory and poor category branches with respect to any of the financial variables.
As shown in the table 1, seven branches were grouped under good category, five branches under satisfactory and six branches poor category based on the percentile scores. The percentile score of good category branches ranged between 84.76 to 56.27, and the satisfactory category branches had the score of 55.74 to 43.33, whereas, the poor category branches had the scores ranging between 33.16 to 13.62. The differences in the scores of different category branches could be attributed to the better performance of physical and financial variables in the case of good category branches. This was further supported by the higher mean value (Table 2 and 3) in the case of good category branches over other branches in respect of staff, deposit account per employee, deposit amount, advances amount, advances per employee, deposit accounts, outstanding advances, advances accounts per employee, total business accounts, agricultural advances accounts, allied activity advances accounts, agricultural advances amount, allied activity advances amount, overdue and recovery percentage. The deposit per employee and productivity variables had a higher mean value in the case of satisfactory branches as compared to good and poor branches. This may be related to more number of staff in good performance branches. The efficiency of the employees might have been unutilized due to lack of sufficient business in case of poor branches. www.extensionjournal.com
| SL. No. | Variables | Good branches | Satisfactory branches | Poor branches |
|---|---|---|---|---|
| 1. | Staff | 8 | 7 | 5 |
| 2. | Deposit accounts | 33,551 | 21,753 | 13,515 |
| 3. | Deposit accounts per employee | 4,412 | 3,292 | 2,977 |
| 4. | Advances accounts | 2,354 | 1,720 | 1,178 |
| 5. | Advances accounts per employee | 316 | 262 | 265 |
| 6. | Total business accounts | 35,906 | 23,473 | 14,692 |
| 7. | Productivity | 4,728 | 3,554 | 3,243 |
| 8. | Agricultural advances accounts | 1,119 | 602 | 529 |
| 9. | Allied advances | 280 | 151 | 132 |
Table text extracted from the original PDF; superscript letters are shown inline. The original table image is below.
View original table image
| Sl. No. | Name of the branch | Average percentile source | Class |
|---|---|---|---|
| 1 | Savanur | 84.765 | Good |
| 2 | Tikota | 65.370 | |
| 3 | Shalawadi | 63.988 | |
| 4 | Bijapura Main | 63.530 | |
| 5 | Ramadurga | 59.725 | |
| 6 | Telsang | 57.611 | |
| 7 | Hosaritti | 56.276 | |
| 8 | Gaddanakeri | 55.121 | Satisfactory |
| 9 | Ron | 52.745 | |
| 10 | Hombal | 50.831 | |
| 11 | Gokul Road Hubli | 48.254 | |
| 12 | Mudol | 43.333 | |
| 13 | Kalagadde | 33.160 | Poor |
| 14 | Kundapura | 31.395 | |
| 15 | Uppinangady | 30.769 | |
| 16 | Hirehonnihalli | 28.033 | |
| 17 | Puttur | 20.216 | |
| 18 | Padubidri | 13.620 |
Table text extracted from the original PDF; superscript letters are shown inline. The original table image is below.
View original table image
The 't' test was carried out to find the validity of the scale in discriminating the poor performing branches with good performing one. The results of 't' test for physical and financial variables were indicated in table 4 and 5 respectively. It was found that there was significant difference in the mean of the two groups namely good and satisfactory categories for the variables such as, deposit accounts, advance accounts and total business accounts. In case of satisfactory and poor category branches, no significant difference was observed. Significant difference was observed between good and poor branches for all the variables except advances accounts per employee. The conclusion that emerges from the study is that the methodology adopted was powerful enough to measure the efficiency of the branches and helped to categorize them into good, satisfactory and poor branches. However, the fruitfulness of the methodology depends upon the careful selections of the variables in an exhaustive manner.
Conclusion
The differences in the scores of different category branches could be attributed to the better performance of physical and financial variables in the case of good category branches. The deposit per employee and productivity variables had a higher mean value in the case of satisfactory branches as compared to good and poor branches. This may be related to more number of staff in good performance branches. The efficiency of the employees might have been unutilized due to lack of sufficient business in case of poor branches. In case of satisfactory and poor category branches, no significant difference was observed. Significant difference was observed between good and poor branches for all the variables except advances accounts per employee. The conclusion that emerges from the study is that the methodology adopted was powerful enough to measure the efficiency of the branches and helped to categorize them into good, satisfactory and poor branches. However, the fruitfulness of the methodology depends upon the careful selections of the variables in an exhaustive manner.
Figures and tables from the paper
| SL. No. | Variables | Good branches | Satisfactory branches | Poor branches |
|---|---|---|---|---|
| 1. | Deposit amount | 5,602 | 3,923 | 1,181.33 |
| 2. | Deposit per employee | 545 | 556 | 260 |
| 3. | Advances amount | 3,483 | 3,169 | 1,123 |
| 4. | Advances per employee | 461 | 453 | 251 |
| 5. | Total business | 9,085 | 7,092 | 2,304 |
| 6. | Productivity | 1,006 | 1,009 | 511 |
| 7. | Agricultural advances | 1,812 | 1,056 | 519 |
| 8. | Allied advances | 453 | 264 | 130 |
| 9. | Profit or loss | 222 | 178 | 48 |
| 10. | Over dues | 60 | 63 | 20.33 |
| 11. | Recovery (percent) | 76 | 76 | 73 |
Table text extracted from the original PDF; superscript letters are shown inline. The original table image is below.
View original table image
References
5 in the original paper- Khankhoje D, Sathye M. Efficiency of Rural Banks: The Case of India. Int. Busi. Res. 2008;1(2):140-149
- Asian J. Res. in Banking Fin. 2013;3(1):46-54.
- Madan S. Financial performance of Regional Rural Banks in India for post-merger period: An analytical study. Res. J Soc. Sci. Mngt. 2014;4(2):176-183.
- Rani N, Gaba D. Analysis of profitability and efficiency: A comparison of HDFC and ICICI. Indian J. Res. 2014;3(9):19-21.
- Rao, Aruna K, Bhat ARS, Bhatta R. A methodology to measures the efficiency of business organization. Indian Co-op. Rev. 1991;28(3):237-244.