
Research article · 2024 · Full text
International Journal of Advanced Biochemistry ResearchEffect of availability of nutrition on determining the representation of sexual behaviour by Cedrus deodara (Roxb.) G. Don
Volume 8(3) · Pages 157–165 · DOI: 10.33545/26174693.2024.v8.i3b.693 ↗
Research areasPlant Parasitism and ResistanceWeed Control and Herbicide ApplicationsPlant and animal studies
Abstract
Author-writtenIn recent years, trends in plasticity of sex expression in conifers, particularly in gymnosperms has become a very intriguing subject for research. However, due to the limited research on this subject, the mechanisms underlying unpredictable gender expression remain unknown. Cedrus deodara, predominantly characterized as monoecious and occasionally dioecious, exhibits irregular intervals in cone production, with certain populations yielding seeds after three to four years. This unpredictable reproductive behavior is influenced not only by climatic factors but also by physiological factors, the specifics of which are yet to be elucidated. The present study aims to unravel the role of biochemical factors affecting periodic cone production in Cedrus deodara. Three distinct sites namely, Cheog forest in Theog, and HFRI Campus forest in Shimla, Himachal Pradesh and Chakrata range, Uttarakhand, each representing a pure stand of the species were selected and 300 trees at each site were marked for recording reproductive behaviour of the species. Selection criteria were based on the reproductive age of Cedrus deodara, as it attains maturity when it reaches a height of 19 to 20 meters. Our findings revealed that Cedrus deodara exhibits subdioecious behaviour, characterized by the occurrence of four basic sex forms such as male trees, female trees, monoecious trees, and neutral trees. Additionally it was also found that individual trees demonstrated change in their expression of sex during each reproductive cycle. Samples from trees showing uncertainity in their expression of gender were collected for exploring the effect of total carbohydrate content and total protein content on this pattern. We found that the allocation of energy resources like carbohydrates and proteins were directly proportional to the production of seeds, the previous year.
Summary
Source-checkedPlain-language reading of the full paper, prepared with AI and checked against the text. Each point links to the authors' own words.
Why it matters
- Cedrus deodara is a conifer that typically shows monoecious or occasionally dioecious behavior, but its cone production occurs at irregular intervals, sometimes every three to four years. View evidence ↗
- The unpredictable nature of reproduction in this species is driven by both climatic and physiological factors, though the specific physiological mechanisms are not well understood. View evidence ↗
- Carbohydrates and proteins are critical nutrients that provide the energy necessary for metabolic activities and are transported to reproductive organs during cone production. View evidence ↗
The question
- The study aims to determine how biochemical factors influence the periodic production of cones in Cedrus deodara. View evidence ↗
- The researchers specifically investigated how nutrient content affects the changing reproductive behavior and the uncertain expression of sexuality in these conifers. View evidence ↗
What they did
- The study monitored 300 marked trees at three distinct sites: Cheog forest, HFRI Campus forest (Shimla), and the Chakrata range (Uttarakhand). View evidence ↗
- Reproductive behavior was recorded continuously over a three-year period from 2014 to 2016. View evidence ↗
- Samples were collected from the tips of axillary branches of different tree types, then lyophilized, powdered, and stored at -20 °C for carbohydrate and protein extraction. View evidence ↗
- Carbohydrates were estimated using the Phenol-sulphuric acid method after alkaline extraction, and proteins were estimated using Lowry's method. View evidence ↗
What they found
- The study found that Cedrus deodara exhibits subdioecious behavior, with trees appearing as male, female, monoecious, or neutral. View evidence ↗
- The levels of carbohydrates and proteins in the trees were found to be directly proportional to the change in cone production each year and the production of seeds in the previous year. View evidence ↗
- Male trees consumed fewer nutrients and less energy during reproduction than female trees, as evidenced by lower carbohydrate content in male trees compared to female trees across all sites in 2015. View evidence ↗
What it means
- The authors conclude that the primary driver for the changes in the sexual representation of the trees is the consumption of energy and utilization of nutrient reserves during reproductive development. View evidence ↗
- The authors state that a high-yield seed year depletes stored carbohydrates and proteins, which suppresses reproductive growth and leads to fewer seeds in the following year. View evidence ↗
Visual summary
1 visualsIllustrations explain the paper; they do not show study data.
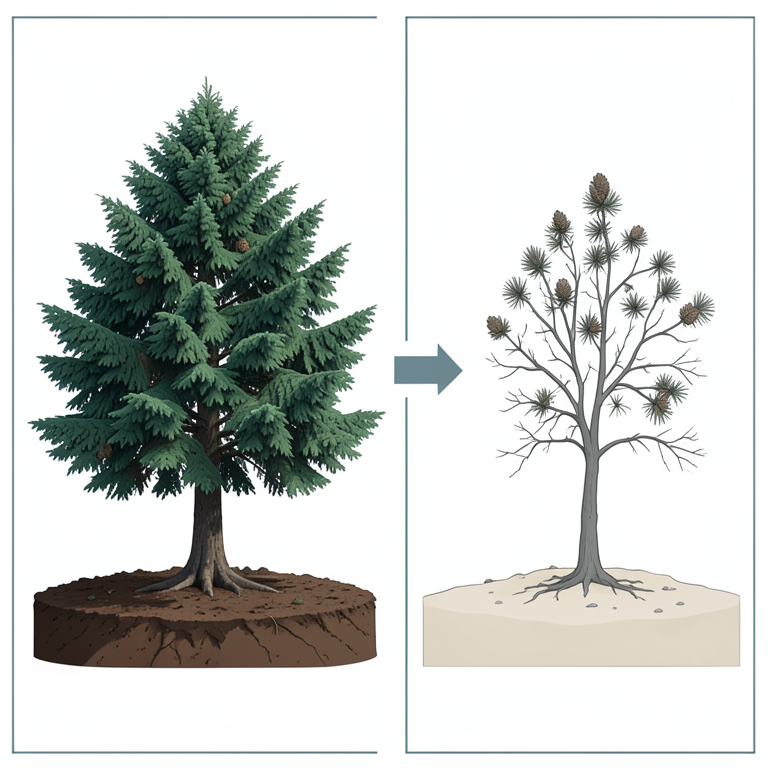
The Nutrient-Reproduction Cycle
AI-generated conceptual illustration (Deodar cedar trees (Cedrus deodara)). It explains the idea and does not show study data.
View source evidence ↗Figures & tables
From the original paper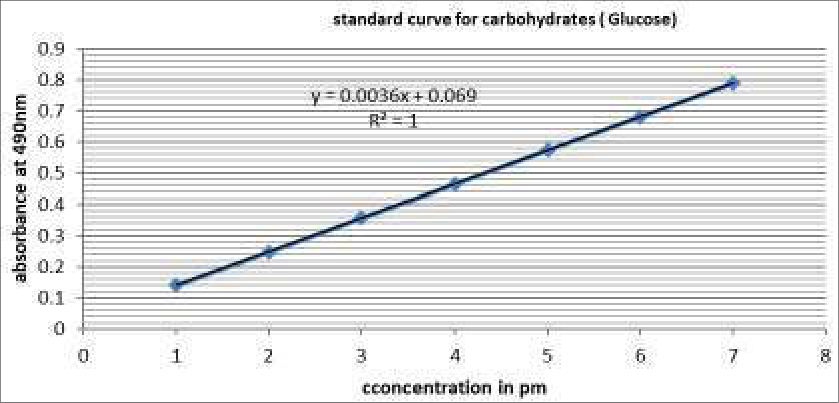 Figure 1
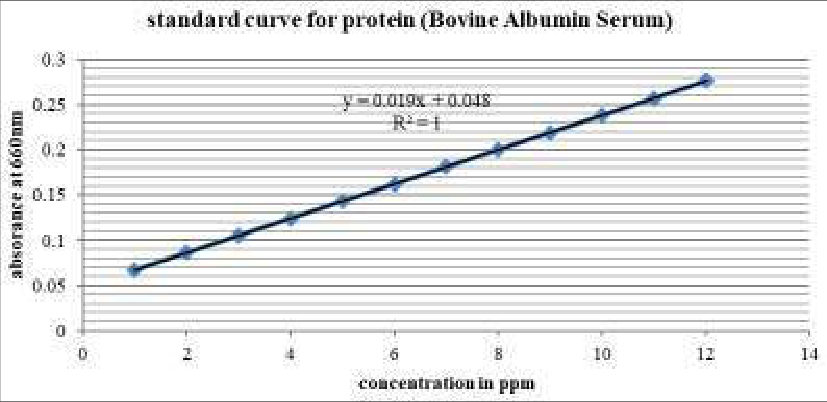 Figure 2
 Table 1
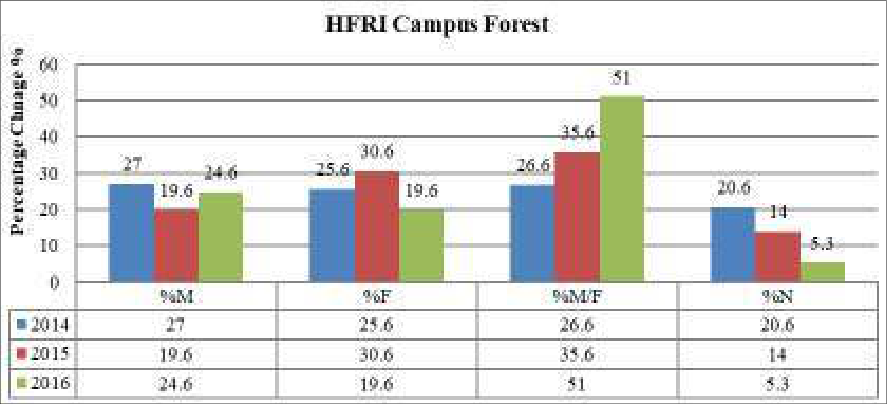 Figure 3
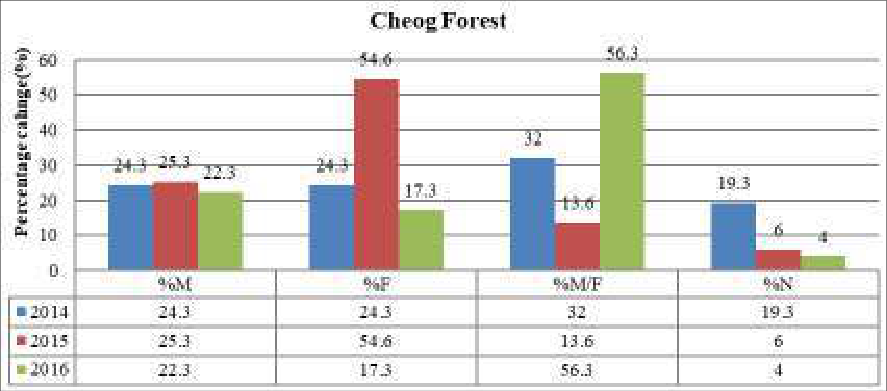 Figure 4
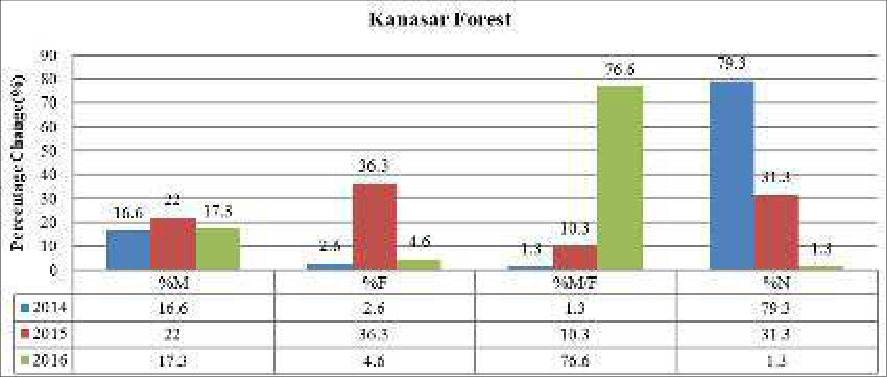 Figure 5
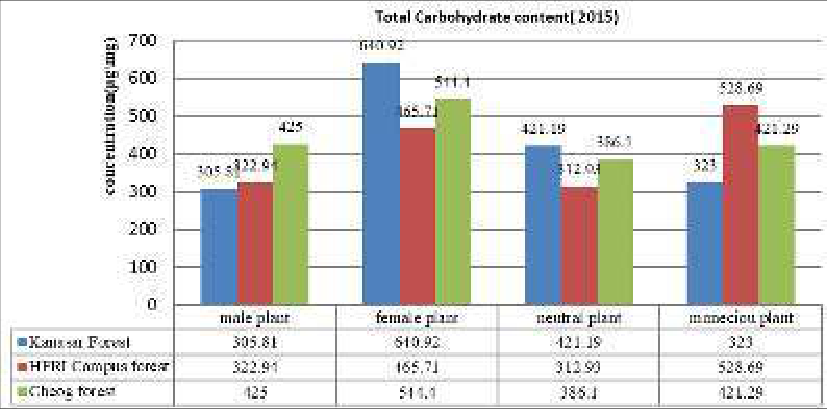 Figure 6
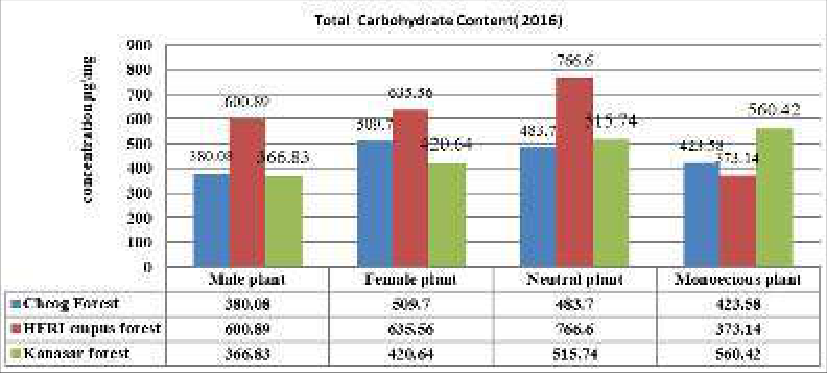 Figure 7
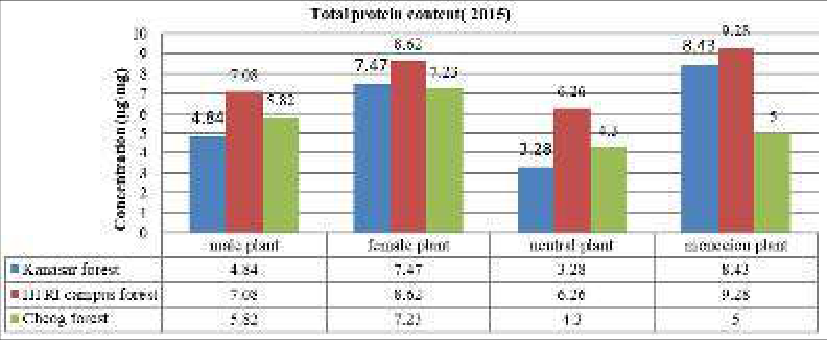 Figure 8
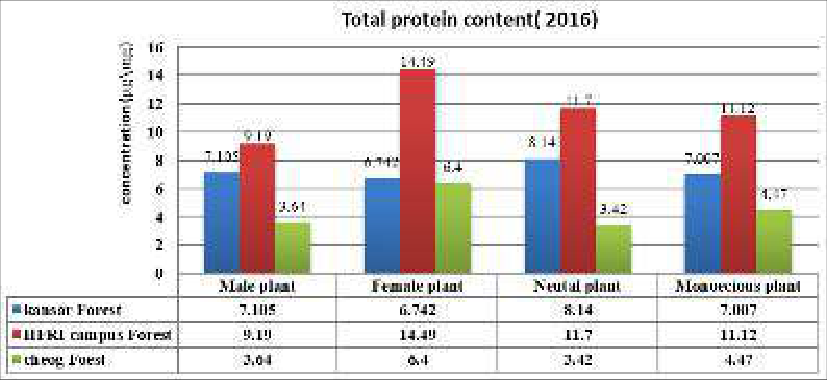 Figure 9
Introduction
Conifers are one of the most ancient tree species, found from Palaeozoic era. They were widely distributed, covering most of the earth's surface at that time. This widespread distribution resulted from the spread of colonisation of new territory, from an origin probably somewhere in Asia. The massive, catastrophic evolutionary events taking place at that time wiped out a large number of conifers. Only a few species managed to adapt and survive till this date among which most of them are large, vascular, seed bearing land plants with cone like fertile structures belonging to the division Pinophyta. Majority of the plants in Pinophyta are trees and very few are shrubs, with tendency to produce seeds for hundreds or thousands of years once they attain maturity. Every year, conifers complete their reproductive cycle either by producing a new set of reproductive organs or they do not produce any reproductive organs at all. They tend to remain in their vegetative state only. Therefore, they have a good seed year once in every three to four years. Such disparity in the reproductive development of conifers has never been studied before. Therefore, it provides a grey area for research and Cedrus deodara has been chosen as a potential tree to carry out research in this area. Carbohydrates and proteins are the most essential nutrients which provide energy for all types of metabolic and developmental activities. They are transported towards the developing reproductive organs at the time of cone production. The movement of stored carbohydrates and proteins from plant organs, such as leaves or roots, towards the reproductive organs begins when fruiting commences during female meiosis (Lebon et al., 2000, 2008) [24,23] . The distribution of reserved carbohydrates and proteins varies between monoecious and dioecious plants. Female plants receive a higher allocation of resources compared to male plants due to their increased reproductive activity. This preferential allocation is driven by the elevated utilization of nutrient resources in female plants for the development of reproductive organs. Consequently, this allocation results in a reduction of other growth and developmental activities in female plants. This shows that in dioecious woody plants, male show higher growth rate and survival in harsh conditions then female plants (Obeso, 2002; Nunez et. al., 2008) [25,26] . In monoecous plants also, the plant shows higher growth rate during the development of male cones and lower growth rate during the development of female cones. Earlier works by Mathews, 1961 [27] , Holmsgaard, 1986 [28] , Dickmann, 1970 [27] and Kozlowski, 1968 [31] showed that developing reproductive organs act as sinks and mobilize nutrients like carbohydrates and proteins at the expense of vegetative growth of the plant. A hypothesis was put forward by Owen, 1969 [32] and Ebell, 1971 [6] , that periodic cone production in conifers may be the result of utilization and draining of carbohydrate and protein reserves by the reproductive organs during a good seed year. This drain of nutrients by reproductive structures during a good seed year reduces the nutrient supply for the vegetative growth of the plant which in turn reduces the metabolic substrate and energy supply available for a continued bud development (Ebell, 1971) [6] . This may reduce the number of potentially reproductive buds which become latent or abort due to less energy supply resulting in cone crop failure the following year. Cedrus deodara produces cones periodically and also there is an uncertainty in its expression of dioecious and monoecious behaviour. This research investigates the influence of nutrient content on the evolving reproductive behavior of Cedrus deodara, aiming to elucidate the uncertainty in the expression of sexuality in conifers.
Materials and Methods
To determine the effect of carbohydrates and proteins in trees, the reproductive behaviour of Cedurs deodara was studied for which 300 mature trees of flowering/fruiting age were marked at three sites, viz, cheog forest and Himalayan Forest Research Institute (HFRI) campus forest at Panthaghati Shimla in Himachal Pradesh and Kanasar Forest, Chakrata in Uttarakhand. Each tree was observed for its reproductive behaviour and recorded as male, female, monoecious and neutral trees depending on the basis of the appearance of male cones or female cones on a single tree or both on the same tree or no cones on the single tree. The reproductive behaviour of all the trees was continuously recorded for 3 years from 2014-2016. To understand the effect of carbohydrates and proteins responsible for the unpredictable reproductive behaviour of Cedrus deodara, four different types of samples were collected from all the three sites. Samples from the tip of axilary branches of male, female, monoecious and vegetative plants were collected, lyophilised, powdered and preserved at -20 °C temperature. Extraction of carbohydrates and proteins was done for further estimation.
Methodology for Carbohydrate extraction and estimation
Carbohydrate extractives were extracted from wood samples by alkaline method and estimation was done by using Phenol-sulphuric acid method (Masuko T. et al., 2005) [11] . The extraction method used as described below was modified and standardized to extract carbohydrates from wood samples. For extraction of polysaccharides, 4 grams of each of the powdered samples were dipped into alkaline solution of 0.5 M to 1 M NaOH (Sodium Hydroxide) solution and kept at 121 °C in the hot air oven for 4 hours. Solution mixture obtained was cooled at room temperature and filtered with Whatmann filter paper. The residue left was discarded. The pH of solution obtained was neutralized by adding 1M HCl (Hydrochloric acid) solution. 200ml of ethanol was added in the neutralized solution of carbohydrate extract and left overnight at room temperature. After 24 hrs precipitate was observed at the bottom of the container. To separate the precipitate from the solution, centrifugation was done at 15000 rpm for 15 min. Pellet obtained was dissolved in water and the suspension was discarded. The solution was vacuum dried in rotary evaporator at 60 °C in round bottom flask. A dried carbohydrate extract was obtained. 1 ml of working standard of glucose from 0.2, 0.4, 0.6, 0.8 and 1ml and 0.1 to 1ml of sample dilutions were pipette out into test tubes. 1ml of volume was made up with distilled water. 1ml of Phenol solution was added in each test tube, incubated for 10 min at room temperature, 5ml of 96% of sulphuric acid was added and all the test tubes were vortexed well. All the test tubes were placed in water bath at 25-30 °C and incubated for 20 min. The absorbance was read at 490 nm with the help of UV-Vis Spectrophotometer. The amount of total carbohydrate present in the samples was calculated using the standard graph (Figure 1.)
Calculation formulae
Calculation formulae
Methodology for protein extraction and estimation
For extraction, isolation and estimation of proteins the following methods were studied and modified. Frozen plant material was grinded to a fine powder using mortar and pestle pre-chilled to -186 °C in liquid nitrogen. The frozen sample was transferred to ice cold extraction buffer (Phosphate buffer ((Sodium dihydrogen phosphate solution (8.954gm in 100ml of distilled water) mixed with Potassium dihydrogen phosphate solution (3.4023 gm in 100 ml of distilled water)), 10% to 20% glycerol, 1% Triton-x (v/v), 5% (w/w) PVP (polyvinylchloride), 2 mM β-mercaptoethanol) mixed well and grinded in chilled mortar and pestle. Filtered and centrifuged at 30,000rpm for 10min at 4 °C. Supernatant was stored in the conical flasks at 4 °C. A series of working standards (BSA) 0, 0.2, 0.4, 0.6, 0.8 and 1ml and series of samples from 2ppm to 100ppm were pipette out and estimated by using Lowry's method.
Absorbance was read at 660 nm. Standard graph (Figure 2.) was drawn and the amount of protein was calculated in the samples. Trees bearing male cones continuously for three years of observation were recorded and marked as male trees. Trees bearing female cones for each year of observation were marked and recorded as female trees. Trees bearing both male and female cones were marked and recorded as monoecious trees. Trees which did not show any reproductive growth for all the three years were marked and recorded as neutral trees. The perusal of table 1 shows that the number of male, female, monoecious and neutral trees is not same and has changed from year to year. The number of male trees increased in the first year and then it decreased in the third year at all sites. The same happened with female trees. The number of monoecious trees increased at all three sites in the third year. Interestingly the number of neutral trees was high in the first and it decreased drastically in the third year at all three sites. A change in the number of male, female, monoecious and neutral trees was observed from 2014 to 2016 which is represented as percentage change in Table 1.
| Types of trees | HFRI campus Forest | — | — | Cheog Forest | — | — | Kanasar Forest | — | — |
|---|---|---|---|---|---|---|---|---|---|
| 2014 | 2015 | 2016 | 2014 | 2015 | 2016 | 2014 | 2015 | 2016 | |
| %M | 27 | 19.6 | 24.6 | 24.3 | 25.3 | 22.3 | 16.6 | 22 | 17.3 |
| %F | 25.6 | 30.6 | 19.1 | 24.3 | 54.6 | 17.3 | 2.6 | 36.3 | 4.6 |
| %M/F | 26.6 | 35.6 | 51 | 32 | 13.6 | 56.3 | 1.3 | 10.3 | 76.6 |
| N% | 20.6 | 14.0 | 5.3 | 19.3 | 6 | 4 | 79.3 | 31.3 | 1.3 |
Table text extracted from the original PDF; superscript letters are shown inline. The original table image is below.
View original table image
Calculation formulae
Calculation formulae
Year wise percentage change in the reproductive behavior of Cedrus deodara
The percentage change in the number of trees at all the three sites from 2014 to 2016 gives an idea about the changing reproductive pattern in Cedrus deodara. Nutrition level in male, female, monoecious and neutral trees was checked by estimating total carbohydrate and total protein content for 2015 and 2016.
Percentage change in
Percentage change in
Total Carbohydrate content obtained in all four types of samples collected from each site in the year 2015
Total Carbohydrate content obtained in all four types of samples collected from each site in the year 2015 is represented in figure 6. Total carbohydrate content in samples obtained from Kanasar, Chakrata, Uttarakhand was found to be maximum in female plants followed by neutral plants and monoecious plants in order. Minimum carbohydrate content was found in male plants. Total carbohydrate content in the samples from HFRI Campus forest showed a different pattern as the total carbohydrate content was found to be maximum in monoecious plants followed by female plants and male plants in order. The minimum total carbohydrate content was found in neutral plants. The total carbohydrate content in samples from Cheog forest was found maximum in female plants followed by male plants and monoecious plants in order. The total carbohydrate content was found minimum in neutral plants. Total Protein content obtained in all four samples collected from all three sites in the year 2016 Total protein content in samples collected from all the three sites viz, Kanasar forest, Chakrata, Uttarakhand, HFRI campus and Cheog Forest, Himachal Pradesh, respectively is represented by figure 9. In HFRI Campus the maximum Protein content was found in female Plants followed by neutral plants and monoecious plants in order. The Minimum protein content was found in male plants. In samples from Kanasar Forest, Chakrata, Uttarakhand, the maximum protein content was found in neutral plants followed by male plants and monoecious plants in order. The minimum total protein content was found in female plants. The Total Protein content in the samples collected from Cheog forest showed maximum total protein content in female plants followed by monoecious plants and male plants in order. The total protein content was found minimum in neutral plants.
Discussion
A good seed year puts a strain on the availability of stored nutrient resources such as carbohydrates and proteins for growth and development of the tree, due to which reproductive growth of the trees is suppressed and hence, reduction in the number of seeds is observed the next year. Development of female reproductive organs require higher nutrient supply as compared to male reproductive organs, this is the reason why if a year has a greater number of female trees and monoecious trees, a decrease in the number of reproductive trees will be observed in the next year.
Events in reproductive behaviour of Cedrus deodara, like dioecious trees turning into monoecious or monoecious trees turning into dioecious, or trees remaining in their vegetative phase for their entire reproductive cycle are highly influenced by physiological changes and nutrient availability to the trees during reproduction. Each nutrient plays a different role in plant growth and development. Carbohydrates and proteins are the richest source of carbon and nitrogen, which are essential in various structural, metabolic and physiological functions in the tree.
The utilization of nutrient reserve by monoecious and dioecious trees is different. Female trees are reproductively more active than male trees hence, allocation and utilization of nutrient reserves is more in female trees as compared to male trees (Dickmann and Kozlowski, 1968) [30] . And the allocation of nutrient reserves by monoecious trees is higher than either the male trees or female trees as the work done by monoecious trees is more compared to dioecious trees. The total carbohydrate content obtained in all the four types of trees samples i.e., male trees, female trees, monoecious trees and neutral trees, collected from HFRI campus Forest, Kanasar Forest and Cheog Forest in 2015 and 2016, was directly proportional to the change in the percentage of cone production each year. Similar was the case with the protein content obtained in all the samples in 2015 and 2016. The total carbohydrate and protein content in a sample is the measure of energy and proteins utilized at the time of cone production by the tree. Substantial increase in the number of monoecious trees at all three sites of study and decrease in the number of neutral trees ( Among dioecious trees most of the male trees in 2014 changed into monoecious trees in 2016 as compared to female trees. The number of male trees transitioning into monoecious trees was higher than that of the female trees. One of the main reasons behind this phenomenal change in the representation of sexual behaviour of the trees was the utilization of nutrient reserves and energy consumption in reproductive development. As it was observed that female cone production in 2014 and 2015 was higher as compared to 2016, therefore, utilization of nutrients and energy consumption in the female trees was higher as compared to other trees, which leads to less availability of nutrients for the next reproductive cycle. As male cone production decreases gradually in 2016 as compared to 2014 and 2015, the carbohydrate content obtained in 2015 in male trees at all three study sites is less than that of female trees. This indicates that the nutrient and energy consumption by male trees is less than that of female trees during reproduction. Hence, there is a possibility that the male trees may produce male cones or become monoecious in the next reproductive cycle or they conserve nutrient for more metabolic work in the next reproductive cycle. This is the reason why a greater number of male trees turn into monoecious trees as compared to the female trees. Each nutrient plays a different role in plant growth and development. Carbohydrates and proteins are the richest source of carbon and nitrogen, which are essential in various structural, metabolic and physiological functions in the tree.
The utilization of nutrient reserve by monoecious and dioecious trees is different. Female trees are reproductively more active than male trees hence, allocation and utilization of nutrient reserves is more in female trees as compared to male trees (Dickmann and Kozlowski, 1968) [30] . And the allocation of nutrient reserves by monoecious trees is higher than either the male trees or female trees as the work done by monoecious trees is more compared to dioecious trees. The total carbohydrate content obtained in all the four types of trees samples i.e., male trees, female trees, monoecious trees and neutral trees, collected from HFRI campus Forest, Kanasar Forest and Cheog Forest in 2015 and 2016, was directly proportional to the change in the percentage of cone production each year. Similar was the case with the protein content obtained in all the samples in 2015 and 2016. The total carbohydrate and protein content in a sample is the measure of energy and proteins utilized at the time of cone production by the tree.
Figures and tables from the paper
References
25 in the original paper- Chaney WR. Cedar of Lebanon (Cedrus libani). Arbor Age. 1993;13(1):26-27.
- Dickman DI, Kozlowski TT. Mobilization by Pinus resinosa cones and shoots of C 14 photosynthate from needles of different ages. American Journal of Botany. 1958;55:900-906.
- Duff GH, Nolan NJ. Growth morphogenesis in the Canadian forest species. III. The time scale of morphogenesis at the tem apex of Pinus resinosa. Canadian Journal of Botany. 1958;36:687-706.
- Ebell ZF. Girdling: its effect on carbohydrates status on reproductive bud and cone development of Douglas-fir. Canadian Journal of Botany. 1971;49:453-456.
- Koziowski TT. Water deficits and plant growth. Academic Press, 1968, 2.
- Mable B, Otto S. The evolution of life cycles with haploid and diploid phases. Bio Essays. 1998;20:453462.
- Masuko T, Minami A, Iwasaki N, Majima T, Leeyc NJ. Carbohydrate analysis by a phenol-sulfuric acid method in microplate format. Analytical Biochemistry. 2005;339(1):69-72.
- Matthews JD. The influence of weather on the frequency of beech mast years in England. Forestry. 1955;28:107-116.
- Leben G, Wojnarowiez G, Holzapfel B, Fontaine F, Vaillant-Gaveau N, Clément C, et al. Sugars and flowering in the grapevine (Vitis vinifera L.). Journal of Experimental Botany. 2008;59:2565-2578.
- Lowry OH, Rosengrouh NJ, Fars AI, Radall RJ. Protein measurement with Follin Phenol Reagent. Journal of Biological Chemistry. 1951;193:265-275.
- Ohlund J, Nasholm T. Growth of conifer seedlings on organic and inorganic nitrogen sources. Tree Physiology. 2004;21:1319-1326.
- Owens JN. Initiation and development of leaves in Douglas fir. Canadian Journal of Botany. 1968;46:271278.
- Pijut P. Cedrus-The true Cedars. Journal of Arboriculture. 2000;26(4):218-224.
- Persson J, Gardestrom P, Nasholm T. Uptake, metabolism and distribution of organic and inorganic nitrogen sources by Pinus sylvestris. Journal of Experimental Botany. 2006;57:2651-2659.
- Schaffalitzky de Muckadell M. Investigation on aging of apical meristems in woody plants and its importance in silviculture. Forst. Fors. Vaes. Danm. 1959;25:31074565.
- Lebon G, Wojnarowiez G, Holzapfel B, Fontaine F, Vaillant-Gaveau N, Clément C, et al. Sugars and flowering in the grapevine (Vitis vinifera L.). Journal of experimental botany. 2008 Jul 1;59(10):2565-78.
- Lebon F, Ledecq M. Approaches to the design of effective HIV-1 protease inhibitors. Current medicinal chemistry. 2000 Apr 1;7(4):455-77.
- Obeso JR. The costs of reproduction in plants. New phytologist. 2002 Sep;155(3):321-48.
- Jimenez-Nunez E, Echavarren AM. Gold-catalyzed cycloisomerizations of enynes: A mechanistic perspective. Chemical reviews. 2008 Aug 13;108(8):3326-3350.
- Mathews MV, Miller JE, David Jr EE. Pitch synchronous analysis of voiced sounds. The Journal of the Acoustical Society of America. 1961 Feb 1;33(2):179-186.
- Holmsgaard JE. The heath of Noerholm, 5th report: Immigration of trees and flora changes on the heath of Noerholm 1921-1947 [Pinus mugo]. Forstlige Forsoegsvaesen i Danmark (Denmark), 1986, 40(3).
- Dickmann DI, Kozlowski TT. Mobilization and incorporation of photoassimilated 14C by growing vegetative and reproductive tissues of adult Pinus resinosa Ait. trees. Plant Physiology. 1970 Mar 1;45(3):284-8.
- Dickmann DI, Kozlowski TT. Mobilization by Pinus resinosa cones and shoots of C14-photosynthate from needles of different ages. American Journal of Botany. 1968 Sep;55(8):900-906.
- Kozlowski TT. Water deficits and plant growth. Plant water consumption and response. Water deficits and plant growth. Plant water consumption and response, 1968, 2.
- Owen RJ. A Bayesian approach to tailored testing. ETS Research Bulletin Series. 1969 Dec;1969(2):1-24.