
Research article · 2024 · Full text
International Journal of Statistics and Applied MathematicsAnalysis of the trend in arrivals and prices of tender coconut in Maddur market, Karnataka
Volume 9(2) · Pages 17–22 · DOI: 10.22271/maths.2024.v9.i2a.1639 ↗
Research areasAgricultural Economics and PracticesSocial and Economic Development in India
Abstract
Author-writtenThe present study analyses the trend in arrivals and prices of tender coconut in the Maddur market by fitting three linear models viz. linear (Straight line), quadratic and exponential models, and three nonlinear models viz. logistics, Gompertz and Richard’s to the annual data on arrivals (In crore nuts) and prices (In rupees per thousand nut) of tender coconuts for the period of 21 year i.e. from 1997-98 to 2017-18. The test statistic to check the goodness of fit of each model was computed using Root Mean Squared Error (RMSE), Mean Absolute Percentage Error (MAPE), and Akaike’s Information Criteria (AIC). The main assumptions of independence of errors and normality distribution of error terms of each model were examined by using respectively the ‘Run-test’ and ‘Shapiro-Wilk test. Based on the lowest value of RMSE, MAPE and AIC, Richard’s model fitted better than other models for arrivals of the tender coconut, and the Quadratic model was found to be the best-fitted model for the prices of the tender coconut in the Maddur market. Based on the overall goodness of criteria the best-fitted model for arrivals could be ranked as follows: Richard’s, logistic, exponential, Gompertz, linear and quadratic models. Trend values obtained by the best-fitted model reveal that both arrivals and prices of tender coconut in the Maddur market have an upward trend.
Summary
Source-checkedPlain-language reading of the full paper, prepared with AI and checked against the text. Each point links to the authors' own words.
Why it matters
- India is the world's leading producer of coconuts, accounting for 31% of the global total. View evidence ↗
- Maddur is a major global hub for tender coconuts, with approximately four million nuts arriving daily at its specialized market. View evidence ↗
- The Indian coconut market is characterized by instability and frequent price fluctuations. View evidence ↗
The question
- The study aims to analyze the patterns of arrivals and prices of tender coconuts specifically within the Maddur market. View evidence ↗
What they did
- The analysis involved fitting six different models to the data: three linear (straight line, quadratic, and exponential) and three nonlinear (logistic, Gompertz, and Richard's). View evidence ↗
- Model goodness of fit was evaluated using Root Mean Squared Error (RMSE), Mean Absolute Percentage Error (MAPE), and Akaike’s Information Criteria (AIC). View evidence ↗
- The researchers used the Run-test to check for independence of errors and the Shapiro-Wilk test to verify the normal distribution of error terms. View evidence ↗
What they found
- For tender coconut arrivals, Richard's model was the best fit, showing the lowest RMSE (2366.88), MAPE (30.57), and AIC (334.31). View evidence ↗
- The Quadratic model performed the worst for arrivals, with the highest RMSE (3049.80), MAPE (39.27), and AIC (342.95). View evidence ↗
- Tender coconut arrivals in the Maddur market showed an upward trend, increasing from 1826 to 13411 crore nuts between 1997-98 and 2017-18. View evidence ↗
- For tender coconut prices, the Quadratic model was the best fit, with the lowest RMSE (1040.31), MAPE (16.52), and AIC (297.79). View evidence ↗
- Tender coconut prices in the Maddur market trended upward, rising from Rs. 3227.61 to Rs. 11352.29 per thousand nuts from 1997-98 to 2017-18. View evidence ↗
What it means
- The authors conclude that both the arrivals and the prices of tender coconuts in the Maddur market have followed an upward trend over the study period. View evidence ↗
Visual summary
3 visualsIllustrations explain the paper; charts are replotted from the paper's own table values.
Model Comparison Framework
AI-generated conceptual illustration (tender coconuts). It explains the idea and does not show study data.
View source evidence ↗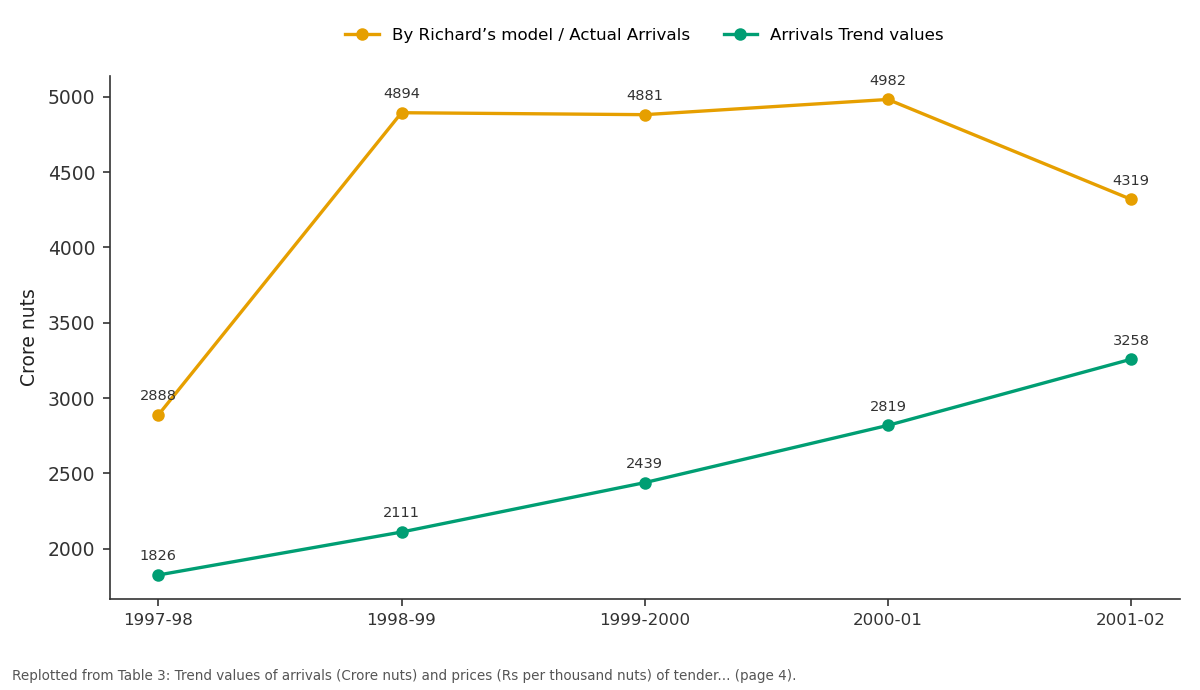
By Richard’s model / Actual Arrivals and Arrivals Trend values: 1997-98 vs 1998-99 vs 1999-2000 vs 2000-01 vs 2001-02
Replotted from Table 3 (page 4) of the original paper. Every bar is the paper's own table value.
View source evidence ↗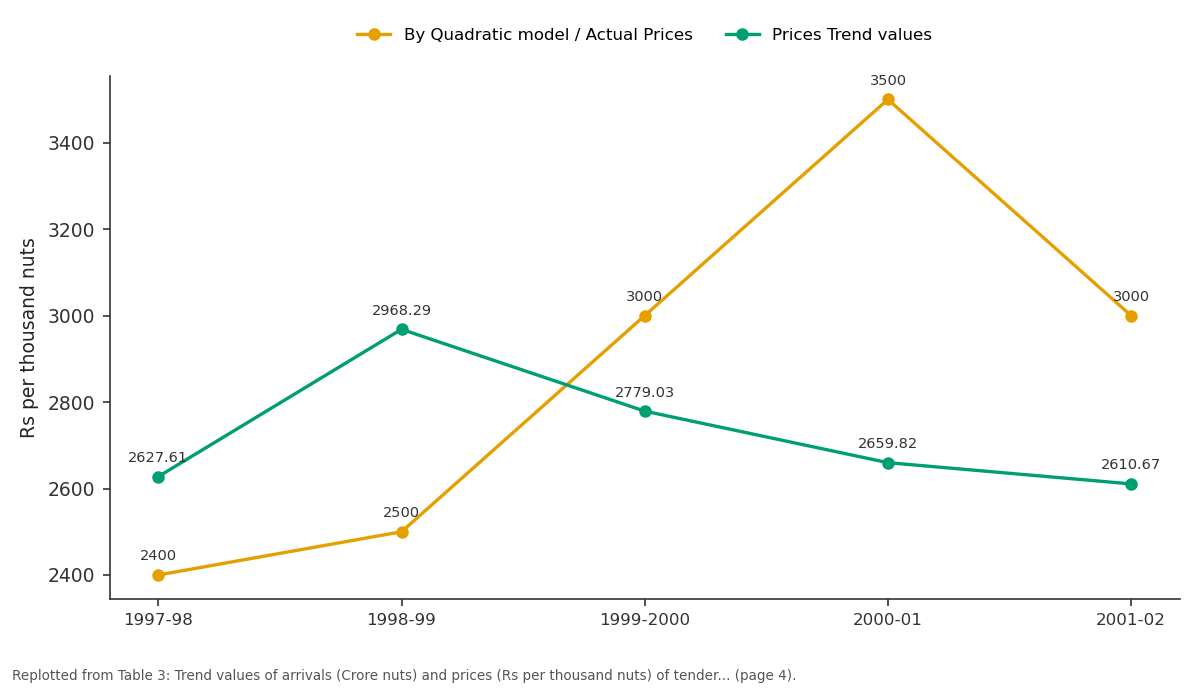
By Quadratic model / Actual Prices and Prices Trend values: 1997-98 vs 1998-99 vs 1999-2000 vs 2000-01 vs 2001-02
Replotted from Table 3 (page 4) of the original paper. Every bar is the paper's own table value.
View source evidence ↗Figures & tables
From the original paper Table 1
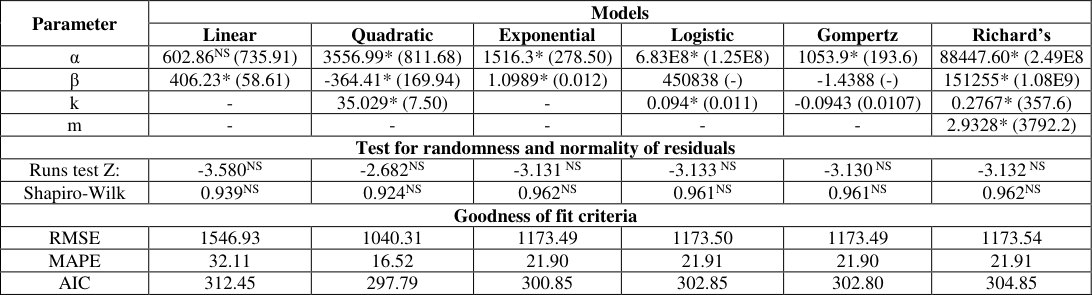 Table 2
 Table 3
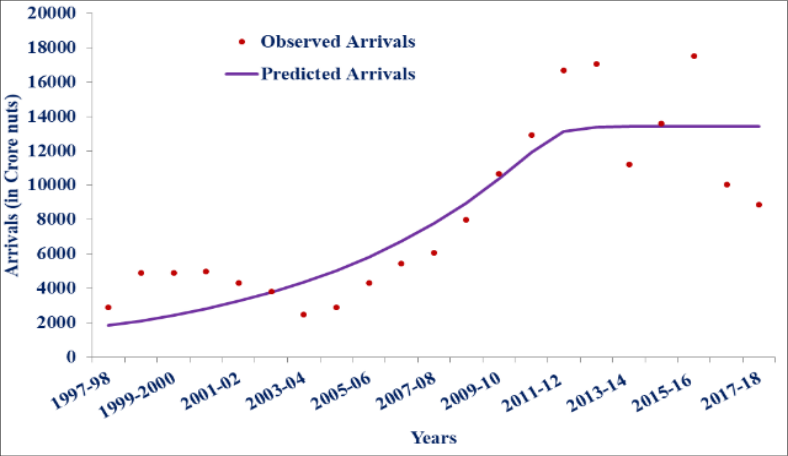 Figure 1
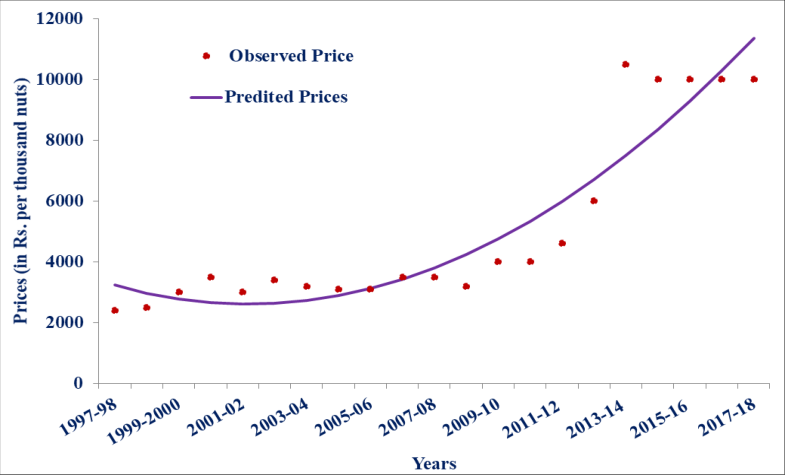 Figure 2
Introduction
The coconut palm tree (Cocos nucifera Linn.) is one of the most natural and valuable gifts to mankind. Considering the versatile nature of the crop and the multifarious uses of its products, the coconut palm is eulogized as Kalpavruksha (The Tree of Heaven). Coconut fruit is considered as Lakshmi Phal, (The Fruit of wealth). Coconut is a source of food, beverage, medicine, natural fibre, fuel, wood and raw materials for units producing a variety of goods. India being the largest coconut producing country in the world occupies 31% of global production. Coconut palm provides food security and livelihood opportunities to more than 12 million people in India. More than 15,000 coir-based industries employ nearly 6 lakh workers of which 80% are women. The crop contributes around Rs. 2, 50, 000 million to the country's GDP and earns export revenue of around Rs.43, 654 million (Anonymous, 2016) [1] . Coconut is grown in more than 93 countries in the world in an area of 12.19 million ha with an annual production of 69836.36 million tonnes of nuts. India ranks first in production (21,665 million nuts) and productivity (10,119 nuts/ha.) of coconut and ranks third in the area (2,141 thousand ha.) under coconut. Indonesia stands first in area (3610 thousand ha.) under coconut, ranks second in production (16354 million nuts) and productivity (4530 nuts/ha.) and the Philippines ranks second in the area (3502 thousand ha.) under coconut, ranks third in production (14696 million nuts) and productivity (4196 nuts/ha.). The largest share of coconut production in 2014 was recorded in India (31.02%) followed by Indonesia (23.42%) and Philippines (21.04%) and other countries 24.52 per cent (Anonymous, 2014) [2] . Traditional areas of coconut cultivation in India are the states of Kerala, Karnataka, Tamil Nadu, Andhra Pradesh, Goa, Orissa, West Bengal, Puducherry, Maharashtra and the Island territories of Lakshadweep and Andaman & Nicobar. Coconut cultivation has also spread to non-traditional tracts like Bihar, Chhattisgarh, Gujarat, West Bengal and North Eastern states. Karnataka stands third in production of coconuts by producing 5128.84 million nuts, which constitutes 23.13 per cent of India's production after Kerala -7429.39 million nuts (33.51%) and Tamil Nadu 6171.06 million nuts (27.83%) during the year 2015-16. The four southern states viz. Kerala, Tamil Nadu, Karnataka and Andhra Pradesh are the major coconut-producing states in India accounting for more than 90 per cent of area and production (Anonymous, 2016) [1] . Nowadays, tender coconut is becoming more popular as a health and energy drink by replacing artificial soft drinks. Coconut water is highly recommended by fitness and nutrition experts as a rehydrating agent. It has a caloric value of 17.4 per 100 gm. On a percentage basis, coconut water is 94.5 per cent water, the rest would contain: Protein (0.15 to 0.55%), fat (0.10%), ash (0.46%), and carbohydrates (4.40%). Tender coconut water is not merely a thirst-quenching drink but a mineral drink that cures most human diseases and helps one regain lost health. Tender coconut water has been given intravenously to cholera epidemic victims in Sri Lanka, Indonesia, Bangladesh and India. Tender coconut water being rich in potassium and other minerals plays a major role in increasing urinary output (Ravi Kumar, 2012) [3] . In Karnataka, about 14 per cent of the total production of coconut is harvested in the form of tender nuts, which is confined to Mandya, Bengaluru, Mysore and Hassan districts. The production of coconut is localized while the consumption is spread throughout the country. Though Kerala tops the list at the national level for coconut production, it is largely used for oil extraction while the fruits from Mandya, Ramanagaram and Tumkur are known for their high water content. Maddur is one of the world's largest tender coconut hubs. Every day, about four million tender coconuts are brought to an exclusive market set up by the Agricultural Produce Marketing Committee on the Bengaluru-Mysore highway. The nuts are brought by farmers and harvesters from Maddur, Mandya, Chamarajnagar, Kollegal, Malavalli, Bannur, Nagamangala, Pandavapura, K. R. Pet and Srirangapatna. Over 60 per cent of these tender coconuts are loaded onto 300 trucks and sent to New Delhi, Mumbai, Pune, Kolkata, Goa, Hyderabad, Ahmedabad and other places. The rest are sold within Karnataka. Marketing of tender coconut plays a significant role in the movement of commodities from the producer to the consumer and stabilizing prices. The planned increase in agricultural output must be coordinated with changes in the demand and supply for agricultural commodities and marketing. This can be achieved only when the producer's share in the consumer's rupee increases considerably irrespective of the volume of the marketable surplus produced by the farmers. The coconut market in India is always unstable and uncertain due to frequent fluctuations in prices. Usually, fluctuation in price occurs due to changes in market conditions created in response to seasonal and annual variations in production (Mohan Kumar et al., 2009) [4] . The seasonal variation in prices of tender coconut is more due to supply factors than due to demand factors. Usually, the magnitude of fluctuation is higher during the lean period compared to the peak period. The pattern of movement of the product from the farm to the ultimate consumer plays a crucial role in determining the returns to the farmers (Savitha and Kunnal, 2016) [5] . Analysis of market arrivals and prices over a period of time is important for formulating a sound agricultural policy. Fluctuations in market arrivals may largely contribute instability of prices. Thus, the study of trend in arrivals and prices of tender coconut will be of greater relevance to the policy makers to assess the demand, supply, and price behaviour, which intern helpful to improve the income of farmers.
To study of trend in arrivals and prices of any crop, generally, the time-series analysis is performed. Keeping these points in view, our objective of the study is to analyze the pattern of arrivals and the prices of tender coconut in the Maddur market.
Materials and Methods
The data for the study are confined to arrivals and prices of tender coconut, tender coconut market, Maddur, which is situated on the premises of the Agricultural Produce Market Committee (APMC), Maddur, Mandya district. The secondary data pertaining to annual arrivals (in Crore nuts) and annual prices (in rupees per thousand nuts) of tender coconuts for the period of 1997-98 to 2017-2018 were collected from APMC, Maddur. Annual arrivals are the total arrivals in that year and annual prices are the modal prices in that year. Trend analysis is the general tendency of the data to increase or decrease over a long period of time without bothering about short-term fluctuations. Generally for estimating the long-term trend of arrivals and prices, the Method of Least Squares estimate was employed. In this method, a trend in arrivals and prices is measured by establishing a mathematical relation between time and the response variable, which depends on time. The relation may be, 1. Linear (Straight line)
Where, 𝑌 𝑡 =Arrivals or prices in time period t α= Intercept or average effect β & k =Slope or regression coefficients (β= Linear effect parameter and k = Quadratic effect parameter) ε = error term or disturbance term Coefficients α, β & k are constant parameters to be estimated. In the above models, the relationship between the response variable and time is assumed to be linear or curvilinear. However, the assumptions of linearity, curvilinear or exponential functional form may not hold for the real data in nature. Most of the time series relating to business and economic phenomena over a long period of time do not exhibit sudden growth which is at a constant rate and in a particular direction over a long period of time, chronological series are not likely to show either a constant amount of change or a constant ratio of change. The rate of growth is initially slow, then it picks up and becomes faster and gets accelerated, then becomes stable for some time after which it shows retardation. The curves, which can be fitted to such data are called Growth Curves. Growth rate analysis is also widely employed to describe the long-term trends in variables over time in various crops (Mohan Kumar, et al. 2012a) [6] . Growth models are generally 'mechanistic' and the parameters have meaningful biological interpretation. The following are some of the important nonlinear growth curves, which are generally used to describe the measurements in a time series. Where, 𝑌 𝑡 represents arrivals or prices in a time period t αβmand kare parameters and denotes the error term.
The parameter 'k' is the 'intrinsic growth rate', while the parameter '' represents the 'carrying capacity or yield ceiling'. For the third parameter, although the same symbol '' was used, this represented different functions of the initial value Y0 for different models and 'm' is the added parameter (Prajneshu and Das, 2000) [7] . It may be noted that all the above growth models are 'nonlinear', as each one of these involves at least one parameter in a nonlinear manner. Parameter estimates in nonlinear cases also can be obtained by minimizing the residual sum of squares. However, because of nonlinearity, the resulting normal equations are nonlinear in parameters and so cannot be solved exactly. Accordingly, several iterative procedures have been developed to obtain approximate solutions. Four main methods are available in the literature to obtain estimates of the unknown parameters of nonlinear regression models: (i) Linearization method, (ii) Gradient method, (iii) Does not use derivatives (DUD) method, and (iv) Levenberg-Marquardt (LM) method. Nowadays most of the standard statistical software packages like SPSS, and SAS contain programs for fitting nonlinear models by LM and DUD procedures. However, convergence to biologically meaningful values cannot always be guaranteed by any procedure and the success rate is quite low. The present statistical analysis was carried out by using the LM procedure available in PROC NLIN facility of the SAS software package (Mohan Kumar et al. 2012b) [8] . The LM iterative method requires the specification of the initial estimates of each parameter of the models to be estimated. Initial value specification is one of the most difficult problems encountered in estimating parameters of nonlinear models. Inappropriate initial values will result in longer iteration, greater execution time, non-convergence of the iteration and possibly convergence to an unwanted local minimum sum of squares residual. To start the iterative procedure, many sets of initial values were tried to ensure global convergence. The iterative procedure was stopped when the reduction between successive residual sums of squares was found to be negligibly small (Mohan Kumar et al, 20120c) [8] . Once the parameters of the models were estimated, a diagnostic check of residuals of the fitted models has to be analyzed to check any violations in the main assumptions of 'independence of residuals' and 'normality of residuals'. The main assumptions of 'independence of residuals' and 'normality of residuals' were examined by using respectively the 'Run-test' and 'Shapiro-Wilk test' (Prajneshu and Das, 2000) [7] . Finally, the goodness of fit of a model is assessed by computing the Root Mean Squared Error (RMSE), Mean Absolute Percentage Error (MAPE), and Akaike's Information Criteria (AIC).
Result and Discussion
Time series analysis was attempted to study the trend in the arrivals and prices of tender coconut in the Maddur market. To determine the nature of trend movement in the arrivals and prices of tender coconut in the Maddur market, linear models viz. Linear (Straight line), Quadratic and Exponential form of the model, and nonlinear growth model viz. Logistic, Gompertz and Richard's model were fitted to annual data on arrivals (In crore nuts) and prices (In rupees per thousand nut) for the period of 21 years i.e. from 1997-98 to 2017-18.
Arrivals of tender coconut
The parameter estimates of all fitted models and their standard errors (Given in round bracket) for arrivals are presented in Table 1. Statistical significance of the parameters of linear and quadratic models was determined by evaluating student t-test. In the linear model slope is found to be significant, whereas the intercept is not significant, with respect to the quadratic model all the parameters are found to be non-significant. The statistical significance of the parameters of the other remaining models was determined by computing the 95% asymptotic confidence intervals of the estimated parameters. Exponential, logistic and Richard's models are significantly fitted to tender coconut arrivals, except the Gompertz model, which showed negative signs in some of the parameters. The null hypothesis was rejected when the 95% asymptotic confidence interval of the corresponding parameter estimate did not include zero. The main assumptions of 'independence' and 'normality' of error terms of each model were examined by using respectively the 'Run-test' and 'Shapiro-Wilk test', and test statistic along with probability values are presented in Tables 1. Results revealed that the number of runs was found to be nonsignificant (Z < 1.95 or p-value > 0.05) and the Shapiro-Wilk statistic was also non-significant (P-value > 0.05) at a 5% significance level for all six models. Hence, the assumptions of randomness of residual and normal distribution of residual are satisfied. The test statistic to check the goodness of fit of each model was computed using RMSE, MAPE, and AIC and they are presented in Table 1. The lowest values of RMSE (2366.88), MAPE (30.57), and AIC (334.31) indicated that Richard's model fitted better than other models to tender coconut arrivals in the Maddur market. On the contrary, the highest value of RMSE (3049.80), MAPE (39.27), and AIC (342.95) revealed that the Quadratic model was less performed than other models. Based on the overall goodness of criteria the best-fitted model for arrivals could be ranked as follows: Richard's, Logistic, Exponential, Gompertz, Linear and Quadratic models. Based on the performance of model fit and goodness of fit criteria, Richard's model was chosen for predicting the trend values of arrivals of tender coconut. The predicted values of arrivals by Richard's model along with observed arrivals are presented in Table 3. From Table 3, it is very clearly evident that during the reference period, the annual arrivals in terms of the number of nuts transacted in the Maddur market over the years have shown an upward trend that was from 1826 to 13411 crore nuts during the periods of 1997-98 to 2017-18. Observed and predicted arrivals of tender coconuts by Richard's model for the period of 1997-98 to 2017-18 are plotted in Fig. 1. In line with our study results, Mohan Kumar et al. (2012c) [9] reported that the Richard model was found to be the best-fitted model to describe the pattern of coffee export from India which revealed that the coffee export from India has an increasing trend.
| Years | By Richard’s model | — | By Quadratic model | — |
|---|---|---|---|---|
| Actual Arrivals | Arrivals Trend values | Actual Prices | Prices Trend values | |
| 1997-98 | 2888 | 1826 | 2400 | 2627.61 |
| 1998-99 | 4894 | 2111 | 2500 | 2968.29 |
| 1999-2000 | 4881 | 2439 | 3000 | 2779.03 |
| 2000-01 | 4982 | 2819 | 3500 | 2659.82 |
| 2001-02 | 4319 | 3258 | 3000 | 2610.67 |
Table text extracted from the original PDF; superscript letters are shown inline. The original table image is below.
View original table image
| Parameter | Models | — | — | — | — | — | — |
|---|---|---|---|---|---|---|---|
| Linear | Quadratic | Exponential | Logistic | Gompertz | Richard’s | ||
| α | 1449.39NS (1450.83) | 1320.15NS (2379.18) | 3621.07* (950.21) | 14769.30* (2872.20) | 2191.0* (575.00) | 13410.70* (1105.50) | |
| β | 619.45* (115.54) | 653.17NS (498.14) | 1.07* (0.02) | 13.07* (10.35) | -1.65NS (-) | 3.05E18* (8.88E20) | |
| k | - | -1.53NS (21.99) | - | 0.25* (0.11) | -0.0684 * (0.0162) | 2.88* (19.81) | |
| m | - | - | - | - | - | 19.89* (139.40) | |
| Test for randomness and normality of residuals | |||||||
| Runs test Z | -2.234NS | -2.234NS | -2.682 NS | -2.234NS | -2.682 NS | -2.234NS |
Table text extracted from the original PDF; superscript letters are shown inline. The original table image is below.
View original table image
Prices of tender coconut
The parameter estimates of all fitted models and their standard errors (Given in round bracket) for prices of tender coconuts are presented in Table 2. In the linear model, only the slope is found to be significant. With respect quadratic model all the parameters are found to be significant. Quadratic, Exponential, and Richard's models are significantly fitted to tender coconut prices, except the logistic and Gompertz models, which showed negative signs in some of the parameters. The null hypothesis was rejected when the 95% asymptotic confidence interval of the corresponding parameter estimate did not include zero. The main assumptions of 'independence' and 'normality' of error terms of each model were examined by using respectively the 'Runtest' and 'Shapiro-Wilk test', and test statistics along with probability values are presented in Table 2. Results revealed that the number of runs was found to be non-significant (Z < 1.95 or p-value > 0.05) and the Shapiro-Wilk statistic was also non-significant (P-value > 0.05) at 5% significance level for all six models fitted. Hence, the assumptions of randomness of residual and normal distribution of residual are satisfied. The test statistic to check the goodness of fit of each model was computed using RMSE, MAPE, and AIC and they are presented in Table 2. In comparison with all other models, the Quadratic model produced the lowest value of RMSE (1040.31), MAPE (16.52), and AIC (297.79) indicating that the Quadratic fitted better than other models for prices of tender coconut in the Maddur market. On the contrary, the highest values of RMSE (1546.93), MAPE (32.11), and AIC (312.45) revealed that the linear model was less performed than other models. Based on the overall goodness of criteria the best-fitted model for prices could be ranked as follows: Quadratic, Exponential, Gompertz, Logistic, Richard's, and Linear models. Based on the performance of model fit and goodness of fit criteria, the Quadratic model was chosen for predicting the trend values of prices of tender coconut. The predicted values of prices by the Quadratic model along with observed prices are presented in Table 3. Table 3, clearly indicates that the price of tender coconut in the Maddur market has shown an upward trend over the years which increased to Rs. 11352.29 from Rs. 3227.61 per thousand nuts during the periods of 1997-98 to 2017-18. In a similar line to Mohan kumar et al., 2012b [8] reported that the area under coffee production in India has shown an upward trend. The graph of the trend value of prices over the years obtained by the quadratic model for the period of 1997-98 to 2017-18 is plotted in Fig. 2.
| Parameter | Models | — | — | — | — | — |
|---|---|---|---|---|---|---|
| Linear | Quadratic | Exponential | Logistic | Gompertz | Richard’s | |
| α | 602.86NS (735.91) | 3556.99* (811.68) | 1516.3* (278.50) | 6.83E8* (1.25E8) | 1053.9* (193.6) | 88447.60* (2.49E8 |
| β | 406.23* (58.61) | -364.41* (169.94) | 1.0989* (0.012) | 450838 (-) | -1.4388 (-) | 151255* (1.08E9) |
| k | - | 35.029* (7.50) | - | 0.094* (0.011) | -0.0943 (0.0107) | 0.2767* (357.6) |
| m | - | - | - | - | - | 2.9328* (3792.2) |
| Test for randomness and normality of residuals | ||||||
| Runs test Z: | -3.580NS | -2.682NS | -3.131 NS | -3.133 NS | -3.130 NS | -3.132 NS |
| Shapiro-Wilk | 0.939NS | 0.924NS | 0.962NS | 0.961NS | 0.961NS | 0.962NS |
| Goodness of fit criteria | ||||||
| RMSE | 1546.93 | 1040.31 | 1173.49 | 1173.50 | 1173.49 | 1173.54 |
| MAPE | 32.11 | 16.52 | 21.90 | 21.91 | 21.90 | 21.91 |
| AIC | 312.45 | 297.79 | 300.85 | 302.85 | 302.80 | 304.85 |
Table text extracted from the original PDF; superscript letters are shown inline. The original table image is below.
View original table image
References
3 in the original paper- Mohan Kumar TL, Munirajappa R, Chandrashekar H, Surendra HS. Seasonality in arrivals and prices of important vegetable crops in Bangalore market. Mysore Journal of Agricultural Sciences. 2009;43(4):738-743.
- Savitha MG, Kunnal LB. Pace and pattern of market arrivals and prices of paddy in Sindhanur and Sirguppa markets of Karnataka. Internat. Res. J Agric. Eco. Stat. 2016;7(2):282-286.
- Prajneshu, DAS PK. Growth models for describing statewise wheat productivity. Indian J Agric. Res. 2000;34(3):179-181.
Cited by 3
From OpenAlex, OpenCitations and reference lists read by Scinovex
- Analysis of trends in arrivals and prices of arecanut in selected markets of Karnataka
Siddeshwari Tamgond, Sachindra Babu, H. Manjunatha, R Devaraju, Y. Nagaraju, Akshay Kumar · International Journal of Agriculture Extension and Social Development · 2026
Aim: To analyse the trends in arrivals and prices of arecanut in selected major markets of Karnataka and identify the most suitable models for describing long-term market behaviour.Study Design: The study utilized annual arrivals and modal price data of arecanut from five major markets of Karnataka, namely Shivamogga, Sirsi, Sagara, Channagiri, and Yellapura, covering the period from 2007 to 2023. Linear and non-linear trend models were fitted and compared using statistical criteria.Place and Duration of Study: The study was conducted using secondary data collected from Krishi Marata Vahini an
- Trend Analysis and Forecast of Arrivals and Prices of Mosambi Crop in Himachal Pradesh ↗
Vishal Thakur, Anju Sharma, Rakesh Kumar Gupta, Ashu Chandel, Subhash Sharma, Sahil Verma et al. · Applied Fruit Science · 2026
❝ 0 - Time series analysis and forecasting of kinnow (Citrus reticulata) arrivals and prices in Himachal Pradesh ↗
VISHAL THAKUR, Anju Sharma, Rakesh Kumar Gupta, Ashu Chandel, SAHIL VERMA · The Indian Journal of Agricultural Sciences · 2026
Kinnow (Citrus reticulata Blanco) plays a significant role in the economic and agricultural sustainability of farmers in Himachal Pradesh, contributing approximately 47.31% to the state’s total citrus production. The present study investigated long-term trends, seasonal variations, instability, and forecasting of kinnow prices and market arrivals in two major markets, Dhanotu and Kangra, Himachal Pradesh during the period 2005–23. Trend analysis…
❝ 0PDF