
Research article · 2024 · Full text
International Journal of Agriculture Extension and Social DevelopmentImpact of cluster frontline demonstrations on yield and economics of sesame (Sesamum indicum L.)
Volume 7(2) · Pages 537–542 · DOI: 10.33545/26180723.2024.v7.i2g.386 ↗
Research areasSesame and Sesamin ResearchCoconut Research and Applications
Abstract
Author-writtenIndian Council of Agricultural Research (ICAR), New Delhi, initiated national level cluster frontline demonstrations (CFLDs) on oilseeds with the main objective of demonstrating the production potential of improved varieties and technologies in the farmers’ fields. The present study evaluates the cluster frontline demonstrations (CFLDs) conducted by ICAR-ATARI, Hyderabad, Zone-10 on Sesame during 2017 to 2021. A total of 3562 CFLDs were conducted in 1425 ha area in 22 districts of Andhra Pradesh, Tamil Nadu and Telangana states for four years. The overall yield advantage of 1.78 q/ha was recorded in demonstration plots compared to the farmers practice with 29.49% increase in yields. Technology gap of 2.11 q/ha and technology index of 21.21% were registered. The net returns of 46557 Rs./ha and benefit cost ration of 3.03 were recorded in demonstration plots compared to 28923 Rs./ha and 2.24 in farmers practices respectively. The technological intervention with improved variety of sesame, technology package and good extension services by the KVKs resulted in enhanced production, productivity and profitability of the farmers.
Summary
Source-checkedPlain-language reading of the full paper, prepared with AI and checked against the text. Each point links to the authors' own words.
Why it matters
- India is the world's leading producer of sesame, utilizing approximately 1.7 million hectares of land. View evidence ↗
- Sesame productivity often remains low (144 to 234 kg/ha) because farmers frequently use local varieties and poor management practices. View evidence ↗
- A primary challenge for agricultural development is closing the gap between actual yields and the potential attainable yield through better access to technology and inputs. View evidence ↗
The question
- The study aims to evaluate the impact of cluster frontline demonstrations (CFLDs) on sesame production between 2017 and 2021. View evidence ↗
What they did
- The research involved 3,562 demonstrations across 1,425 hectares in 22 districts of Andhra Pradesh, Tamil Nadu, and Telangana over four years. View evidence ↗
- Different improved varieties were used based on regional suitability, including Sarada, JCS-1020, and JCS 96 in Andhra Pradesh; TMV-7 and VRI-3 in Tamil Nadu; and JCS-1020, Hima, and Swetha Til in Telangana. View evidence ↗
- Demonstrations were conducted in plots of 0.4 or 0.8 hectares, with farmers maintaining separate areas using traditional methods as controls. View evidence ↗
- The study measured success using yield data, gross and net returns, the benefit-cost (B:C) ratio, technology gaps, extension gaps, and the technology index. View evidence ↗
What they found
- Demonstration plots achieved an average yield of 7.83 q/ha, which is a 29.49% increase (1.78 q/ha advantage) over the 6.05 q/ha average from traditional farmer practices. View evidence ↗
- The average technology gap in Zone-10 was 2.11 q/ha, with the smallest gap in Tamil Nadu (1.06 q/ha) and the largest in Andhra Pradesh (3.45 q/ha). View evidence ↗
- The average technology index was 21.21%, with Telangana showing the lowest index (18.30%) and Tamil Nadu the highest (36.41%). View evidence ↗
- Net returns were significantly higher in demonstration plots (46,557 Rs./ha) compared to traditional farmer practices (28,923 Rs./ha). View evidence ↗
- The benefit-cost ratio improved from 2.24 in traditional practices to 3.03 in the demonstration plots. View evidence ↗
What it means
- The authors conclude that the improved technology and CFLD approach are economically viable and feasible for sesame cultivation in Zone-10. View evidence ↗
- The authors recommend minimizing yield gaps by educating farmers and disseminating improved technology packages. View evidence ↗
Visual summary
2 visualsIllustrations explain the paper; charts are replotted from the paper's own table values.
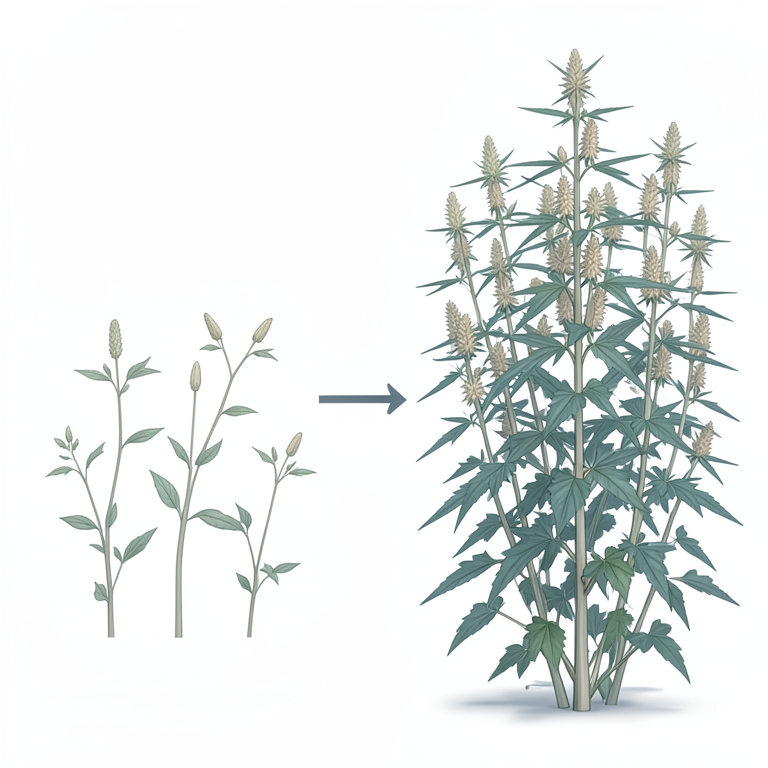
Impact of CFLD on Sesame
AI-generated conceptual illustration (sesame plants (Sesamum indicum L.)). It explains the idea and does not show study data.
View source evidence ↗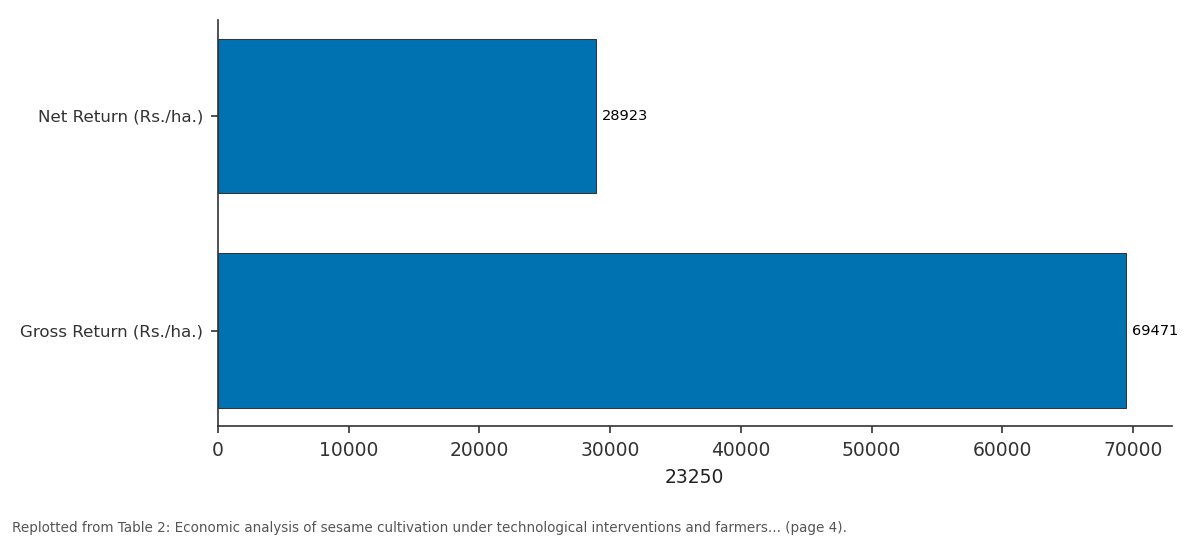
23250: Net Return (Rs./ha.) vs Gross Return (Rs./ha.)
Replotted from Table 2 (page 4) of the original paper. Every bar is the paper's own table value.
View source evidence ↗Figures & tables
From the original paper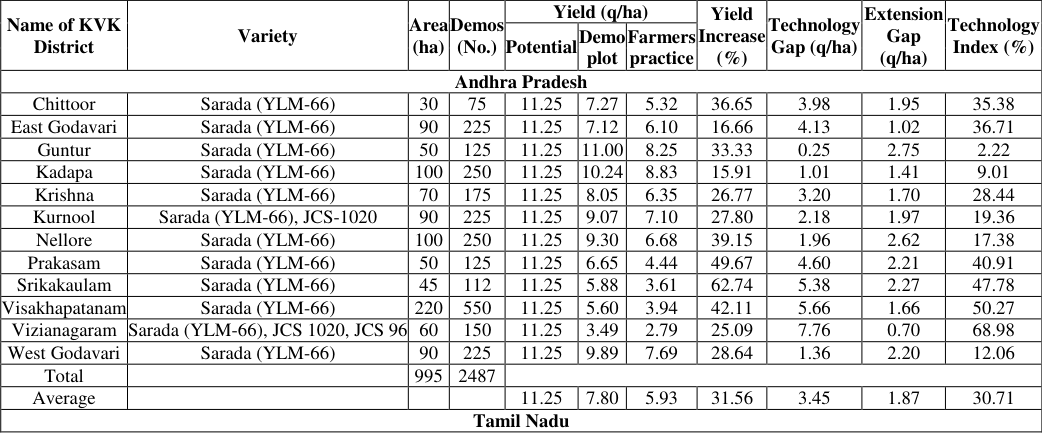 Table 1
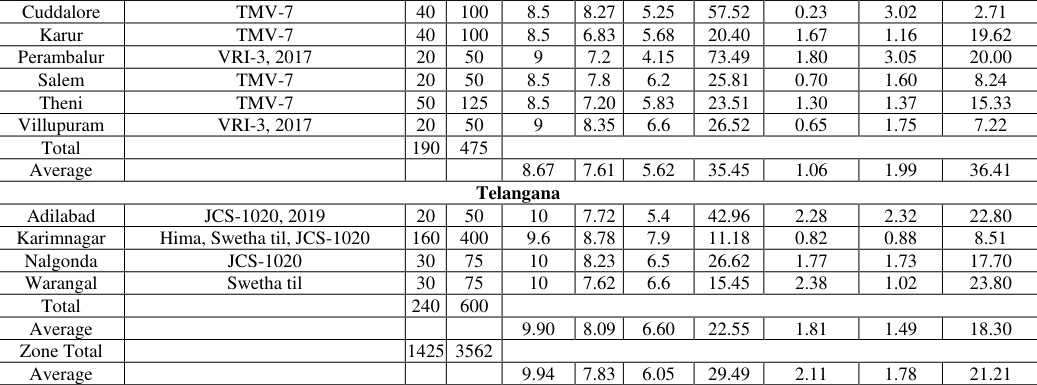 Table 2
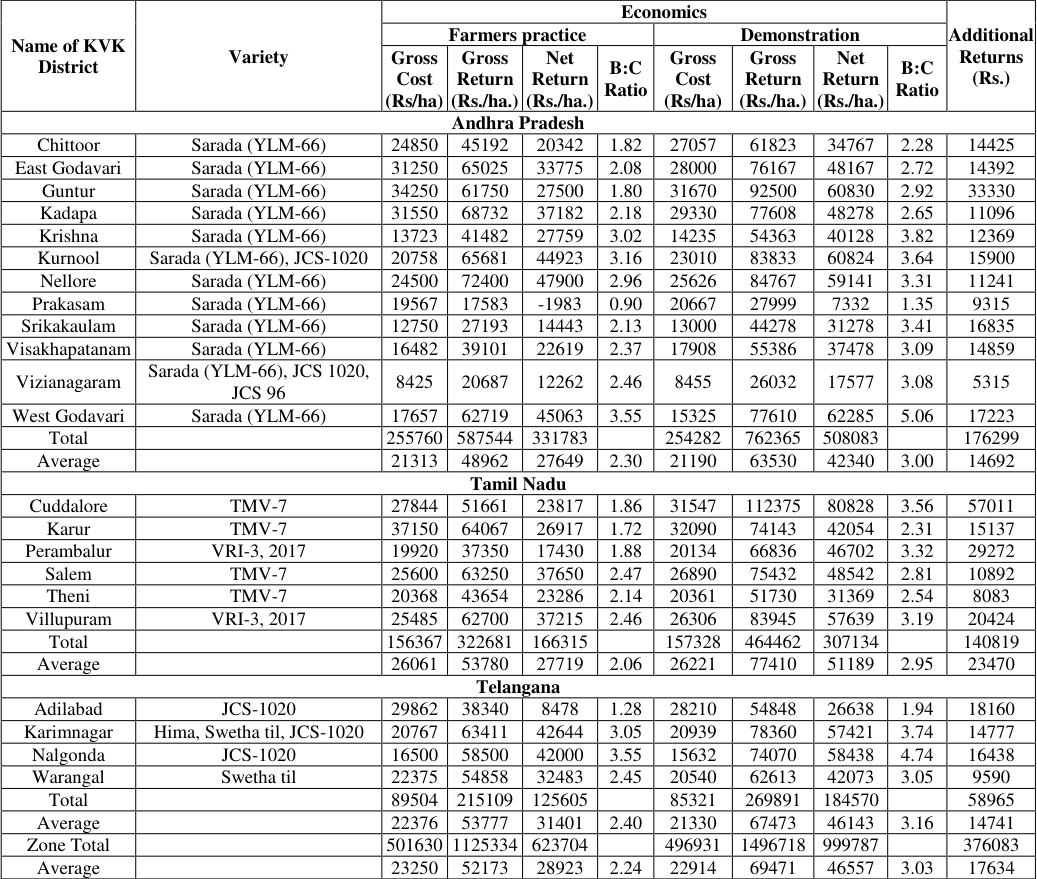 Table 2
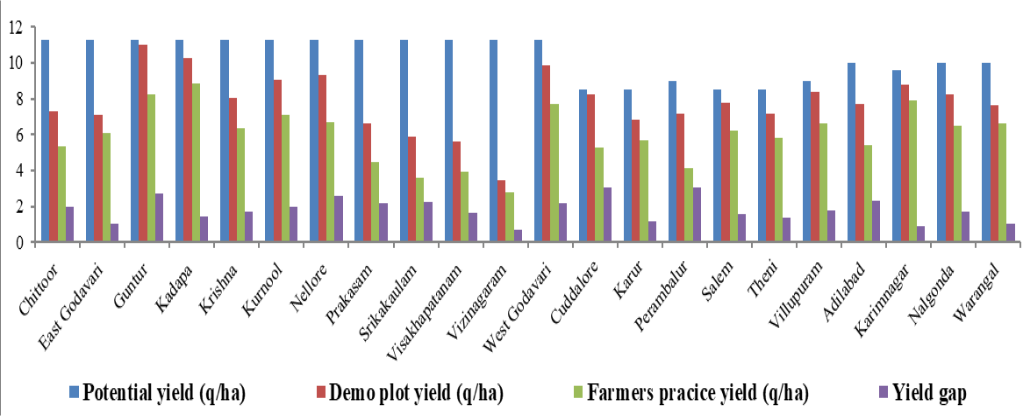 Figure 1
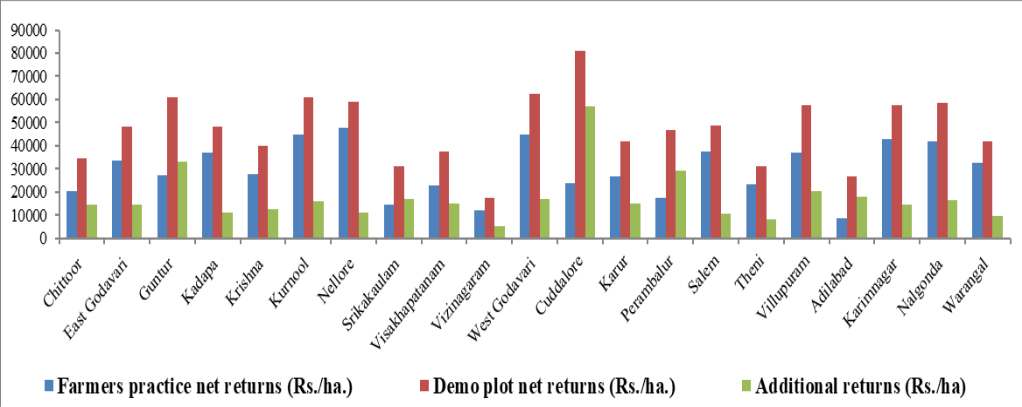 Figure 2
Introduction
Sesame (Sesamum indicum L.) is an ancient oilseed crop commonly known as gingelly and till. It is grown in both tropical and sub-tropical regions which has a large diversity in cultivars and cultural systems. This probably indicates a great opportunity for a prolonged and higher increase in productivity of sesame. It is globally grown in an area of 11.74 million hectares with a production of 6.01 million tonnes and productivity of 512 kg/ha. India is the largest producer of sesame in the world. It also ranks second in the world in terms of sesame-growing area (12.4%) with about 1.7 million hectares with a total production of 0.74 million tonnes and productivity of 431 kg/ha (FAOSTAT 2020) [1] . Sesame seed is a reservoir of nutritional components with numerous beneficial effects for health promotion in humans (Pathak et al., 2014) [16] . Sesame seeds may be eaten fried, mixed with sugar or in the form of sweat meals and oil is used as a cooking oil in southern India. About 70% of world's sesame seed is used to produce oil and meal. Sesame cake is a rich source of protein, carbohydrates and minerals such as calcium and phosphorus. Worldwide sesame seed consumption was USD 6559 million in 2018 and it will reach USD 7244.9 million by 2024, with a CAGR (Compound annual growth rate) of 1.7% (Myint et al., 2020) [13] . The average productivity of sesame continues to be lower in the range of 144 to 234 kg/ha, mainly due to cultivation of local varieties in marginal lands, poor management practices and non-adoption of improved production technologies. The greatest limitations of increasing in productivity of crop are inadequate supply of nutrients and poor production practices are poor in native fertility (Singh and Khan 2003) [22] . The main challenge for development departments is to bridge the gap between actual and attainable yield by enhancing farmers' access to quality inputs, improved technologies and information (Parthasarathy et al., 2010) [15] . According to Piara et al., (2006) [18] location specific integrated approaches would help to bridge the gap of the predominant crops grown in the target regions. The use of improved varieties and new production technologies are required to improve the soil health and offers a great scope for increasing productivity and profitability. The yield of sesame could be increased by 21 to 53% with adoption of improved technologies such as improved variety, recommended dose of fertilizer, weed management and plant protection (Govardhan Rao and Venkata Ramana 2017) [6] . To achieve the targeted production of oilseeds, the government of India has initiated Cluster Front Line demonstrations on Oilseeds under National Food Security Mission (NFSM). Accordingly, the ICAR-Division of Agricultural Extension, Indian Council of Agricultural Research (ICAR) has been organizing Cluster Front line demonstrations (CFLDs) on oilseeds since Rabi 2015-16 through Krishi Vigyan Kendras in the Country. To enhance sesame production, ICAR-ATARI, Zone-10, Hyderabad organized CFLDs on sesame crop in Andhra Pradesh, Tamil Nadu and Telangana states under National Food Security Mission (NFSM).
Materials and Methods
Cluster frontline demonstration is a unique approach by the Indian Council of Agricultural Research on Oilseed crops to www.extensionjournal.com provide a direct interface between scientists and farmers where farmers are guided by the Krishi Vigyan Kendra (KVK) scientists during demonstrations in implementation of improved technologies like seed treatment, IPM, INM, land preparation etc. The CFLDs were found very useful in increasing farmers' knowledge and adoption levels and created greater awareness and motivated the farmers to adopt appropriate oilseed production technologies (Patil et al. 2018 & 2019) [17] . The present study evaluates the performance of CFLDs on sesame organized by the KVKs under the supervision of the agricultural scientists of ICAR-ATARI, Zone-10, Hyderabad during 2017 to 2021. A total of 3562 CFLDs were conducted in 1425 ha area in 22 districts of Andhra Pradesh, Tamil Nadu and Telangana states for four years during Rabi and summer seasons. The varieties demonstrated were Sarada (YLM-66), JCS-1020, JCS 96 in Andhra Pradesh, TMV-7 and VRI-3 in Tamil Nadu and JCS-1020, Hima and Swetha Til in Telangana states based on the suitability. Each cluster had a minimum of 10ha area and each front line demonstration was laid out in 0.4 or 0.8 ha and farmers allotted some area for cultivating existing varieties with traditional crop cultivation methods. Awareness programmers on the importance of improved varieties and new production technologies of sesame were conducted by the KVK staff before the start of the season at all locations. Literature on package of practices was distributed to farmers. Critical inputs like improved high yielding variety seed and bio fertilizers were provided to farmers and recommended package of practices were followed in an integrated crop management approach. KVK scientists visited the demonstration plots at regular intervals to provide need-based agro advisories and timely guidance to the farmers. The data on the growth, performance of the crop, pest and disease incidence, farmer's feedback was recorded from time to time to assess the comparative performance. Sesame crop yields were recorded from the demonstration and control plots at the time of harvest. The gross returns, net returns and B:C Ratio was calculated based on the prevailing prices of inputs and outputs. The technology gap, extension gap and technology index were worked out (Samui et al., 2000) [20] as given below.
Results and Discussion
Results and Discussion
Yield Advantage
The data in Table 1 depicts the average yields of sesame obtained in 22 districts of Andhra Pradesh, Tamil Nadu and Telangana states. The overall yield of sesame was higher in demonstration plots (7.83 q/ha) compared with the average yields in farmers practice (6.05 q/ha) recording a yield advantage of 1.78 q/ha with 29.49% increase in yields. The average demonstration yield in Andhra Pradesh ranged from 3.49 q/ha to 11 q/ha whereas the farmer's yield ranged from 2.79 q/ha to 8.83 q/ha. The average demonstration yield in 6 districts of Tami Nadu ranged between 7.2 q/ha to 8.35 q/ha and 7.62 q/ha to 8.78 q/ha in Telangana whereas the farmer's yield ranged between 4.15 q/ha to 6.6 q/ha and 5.4 q/ha to 7.9 q/ha respectively. The average demonstration yield of sesame was high in Telangana state (8.09 q/ha) compared to Andhra Pradesh (7.8 q/ha) and Tamil Nadu (7.61 q/ha) states. The average yield of sesame was higher in demonstration plots than the farmers practice in all three states which may be due to the adoption of improved varieties in place of local varieties and improved crop cultivation practices in an integrated approach. The difference in yields between the states and districts may be due to different agro-climatic conditions, soil fertility status, irrigation and socioeconomic conditions of the farmers. Meena et al. (2018) [11] reported that varietal demonstrations along with integrated cultural practices under CFLD programmer gave positive impact over existing farmers practices in enhancing crop productivity. Amit et al. (2020) [2] also reported that the yield of sesame was higher in front line demonstrations with the adoption of high yielding variety as compared to the local check. Kumar et al. (2023) [9] depicted that the average yield under demonstrated conditions was higher than the farmer's practices were due to use of recent technological inputs and improved package of practices.
| Name of KVK District | Variety | Area (ha) | Demos (No.) | Yield (q/ha) | — | — | Yield Increase (%) | Technology Gap (q/ha) | Extension Gap (q/ha) | Technology Index (%) |
|---|---|---|---|---|---|---|---|---|---|---|
| Potential | Demo plot | Farmers practice | ||||||||
| Andhra Pradesh | ||||||||||
| Chittoor | Sarada (YLM-66) | 30 | 75 | 11.25 | 7.27 | 5.32 | 36.65 | 3.98 | 1.95 | 35.38 |
| East Godavari | Sarada (YLM-66) | 90 | 225 | 11.25 | 7.12 | 6.10 | 16.66 | 4.13 | 1.02 | 36.71 |
| Guntur | Sarada (YLM-66) | 50 | 125 | 11.25 | 11.00 | 8.25 | 33.33 | 0.25 | 2.75 | 2.22 |
| Kadapa | Sarada (YLM-66) | 100 | 250 | 11.25 | 10.24 | 8.83 | 15.91 | 1.01 | 1.41 | 9.01 |
| Krishna | Sarada (YLM-66) | 70 | 175 | 11.25 | 8.05 | 6.35 | 26.77 | 3.20 | 1.70 | 28.44 |
| Kurnool | Sarada (YLM-66), JCS-1020 | 90 | 225 | 11.25 | 9.07 | 7.10 | 27.80 | 2.18 | 1.97 | 19.36 |
| Nellore | Sarada (YLM-66) | 100 | 250 | 11.25 | 9.30 | 6.68 | 39.15 | 1.96 | 2.62 | 17.38 |
| Prakasam | Sarada (YLM-66) | 50 | 125 | 11.25 | 6.65 | 4.44 | 49.67 | 4.60 | 2.21 | 40.91 |
| Srikakaulam | Sarada (YLM-66) | 45 | 112 | 11.25 | 5.88 | 3.61 | 62.74 | 5.38 | 2.27 | 47.78 |
| Visakhapatanam | Sarada (YLM-66) | 220 | 550 | 11.25 | 5.60 | 3.94 | 42.11 | 5.66 | 1.66 | 50.27 |
| Vizianagaram | Sarada (YLM-66), JCS 1020, JCS 96 | 60 | 150 | 11.25 | 3.49 | 2.79 | 25.09 | 7.76 | 0.70 | 68.98 |
| West Godavari | Sarada (YLM-66) | 90 | 225 | 11.25 | 9.89 | 7.69 | 28.64 | 1.36 | 2.20 | 12.06 |
| Total | 995 | 2487 | ||||||||
| Average | 11.25 | 7.80 | 5.93 | 31.56 | 3.45 | 1.87 | 30.71 | |||
| Tamil Nadu |
Table text extracted from the original PDF; superscript letters are shown inline. The original table image is below.
View original table image
Technology Gap
The technology gap indicates the gap between the demonstrations yield and potential yield. A technology gap of 2.11 q/ha was registered in Zone-10. The lowest technology gap of 1.06 q/ha was registered in Tamil Nadu whereas it was 1.81 q/ha in Telangana and 3.45 q/ha in Andhra Pradesh during the study period (Table 1). The technology gap observed may be attributed to dissimilarity in the soil fertility status, weather conditions, lack of good quality of seed, irrigation facility and location specific crop management practices. Hence the availability of quality inputs and location specific recommendation are necessary to bridge the gap between the potential and demonstration yields. Similar findings were reported by Bamboriya and Singh (2020) [3] . Kumbhare et al. (2014) [10] in their study found that the development of location specific package of practices like for soil testing, seed rate, seed treatment, plant population, foliar spray, irrigation schedule and methods, use of bio fertilizers and on-farm testing and demonstrations at farmers' field would be crucial technological interventions to reduce the technology gap.
Extension Gap
The Extension gap refers to the difference between demonstration yield and farmer's yield. The extension gap of 1.78 q/ha was registered during the four years from 2017 to 2021 in Zone-10. The highest extension gap of 1.99 q/ha was registered in Tamil Nadu whereas it was found to be 1.87 q/ha in Andhra Pradesh and 1.49 q/ha in Telangana (Table 1). The extension gap ranged between 0.88 q/ha and 3.02 q/ha in the districts under study (Figure 1) in three www.extensionjournal.com states emphasizes the need to educate the farmers regarding improved technologies like improved high yielding varieties and new agricultural practices by the extension personnel to reverse this trend of wide extension gap. Similar findings were reported by Dubey et al. (2018) [4] , Dubey et al. (2022) [5] in pulses, Kumar et al. (2022) [8] in rapeseed and mustard and Kumar et al. (2023) [9] in pigeon pea. Singh and Gautam (2016) [21] opined that the extension gap in yield of sesame can be minimized by disseminating the technology package and upscaling the adoption percentage to increase production and productivity.
Technology Index
The technology index indicates the feasibility of new technology at field level. It is an important tool for judging the adoption and impact of different technologies (Kumar et al., 2023) [9] . Lower the value of technology index, more is the feasibility of the technological intervention (Jeengar et al., 2006) [7] . The technology index was recorded as 30.71% in Andhra Pradesh, 36.41% in Tamil Nadu and 18.30% in Telangana. The average technology index was 21.21%, which indicates the feasibility of the new technology with improved variety and integrated nutrient management followed in cluster front line demonstrations on sesame crop in the zone. The lower technology index of 2.22% in Guntur district of Andhra Pradesh and 2.71% in Tamil Nadu shows the closeness of demonstration yields to the potential yields and the feasibility of the improved varieties in those regions. The large variation in the technology index between different districts of the three states might be due to soil fertility, weather conditions and adoption level of the technology. Similar results on variation in technology index were reported by Naik et al. (2016) [14] , Singh and Gautam (2016) [21] , Meena et al. (2018) [11] , Kumar et al. (2023) [9] and Meena et al. (2023) [12] .
Economic Returns
The economic analysis of sesame cultivation was depicted in Table 2. The data related to the economics of CFLDs and control plots was presented as gross cost, gross return and net return. The economic viability of improved demonstrated technology over farmers practice was calculated depending on prevailing cost of inputs and output prices and represented in terms of benefit cost ratio (B:C Ratio). The overall average cost of cultivation of sesame in the zone was 23250 Rs./ha farmers practice and was 22914 Rs./ha in demonstrations. The net returns in the demonstration were registered as 46557 Rs./ha in demonstrations against 28923 Rs./ha in farmer's practice. The B:C ratio in the demonstration was calculated as 3.03 and was 2.24 in farmer's practice. Additional returns over the farmers practice were highest in Cuddalore district (57011 Rs./ha) of Tamil Nadu followed by Guntur district (33330 Rs./ha) of Andhra Pradesh (Figure 2). From the economic analysis it was evident that the net returns and B:C ratio were found to be high in CFLDs compared to control plots. The higher net returns and B:C ratio in the demonstration might be due to increased yields, higher market price because of the better quality of output by the adoption of improved technologies. These findings agree with Raikwar and Srivastva (2013) [19] , Govardhan Rao and Venkata Ramana 2017 (2017) [6] , Bamboriya and Singh (2020) [3] , Amit et al. (2020) [2] , Kumar et al. (2023) [9] and Meena et al. (2023) [12] , who also reported the higher net returns and B:C ration in demonstrations compared to farmers practice in sesame crop.
| Name of KVK District | Variety | Economics | — | — | — | — | — | — | — | Additional Returns (Rs.) |
|---|---|---|---|---|---|---|---|---|---|---|
| Farmers practice | Demonstration | |||||||||
| Gross Cost (Rs/ha) | Gross Return (Rs./ha.) | Net Return (Rs./ha.) | B:C Ratio | Gross Cost (Rs/ha) | Gross Return (Rs./ha.) | Net Return (Rs./ha.) | B:C Ratio | |||
| Andhra Pradesh | ||||||||||
| Chittoor | Sarada (YLM-66) | 24850 | 45192 | 20342 | 1.82 | 27057 | 61823 | 34767 | 2.28 | 14425 |
| East Godavari | Sarada (YLM-66) | 31250 | 65025 | 33775 | 2.08 | 28000 | 76167 | 48167 | 2.72 | 14392 |
| Guntur | Sarada (YLM-66) | 34250 | 61750 | 27500 | 1.80 | 31670 | 92500 | 60830 | 2.92 | 33330 |
| Kadapa | Sarada (YLM-66) | 31550 | 68732 | 37182 | 2.18 | 29330 | 77608 | 48278 | 2.65 | 11096 |
| Krishna | Sarada (YLM-66) | 13723 | 41482 | 27759 | 3.02 | 14235 | 54363 | 40128 | 3.82 | 12369 |
| Kurnool | Sarada (YLM-66), JCS-1020 | 20758 | 65681 | 44923 | 3.16 | 23010 | 83833 | 60824 | 3.64 | 15900 |
| Nellore | Sarada (YLM-66) | 24500 | 72400 | 47900 | 2.96 | 25626 | 84767 | 59141 | 3.31 | 11241 |
| Prakasam | Sarada (YLM-66) | 19567 | 17583 | -1983 | 0.90 | 20667 | 27999 | 7332 | 1.35 | 9315 |
| Srikakaulam | Sarada (YLM-66) | 12750 | 27193 | 14443 | 2.13 | 13000 | 44278 | 31278 | 3.41 | 16835 |
| Visakhapatanam | Sarada (YLM-66) | 16482 | 39101 | 22619 | 2.37 | 17908 | 55386 | 37478 | 3.09 | 14859 |
| Vizianagaram | Sarada (YLM-66), JCS 1020, JCS 96 | 8425 | 20687 | 12262 | 2.46 | 8455 | 26032 | 17577 | 3.08 | 5315 |
| West Godavari | Sarada (YLM-66) | 17657 | 62719 | 45063 | 3.55 | 15325 | 77610 | 62285 | 5.06 | 17223 |
| Total | 255760 | 587544 | 331783 | 254282 | 762365 | 508083 | 176299 | |||
| Average | 21313 | 48962 | 27649 | 2.30 | 21190 | 63530 | 42340 | 3.00 | 14692 | |
| Tamil Nadu | ||||||||||
| Cuddalore | TMV-7 | 27844 | 51661 | 23817 | 1.86 | 31547 | 112375 | 80828 | 3.56 | 57011 |
| Karur | TMV-7 | 37150 | 64067 | 26917 | 1.72 | 32090 | 74143 | 42054 | 2.31 | 15137 |
| Perambalur | VRI-3, 2017 | 19920 | 37350 | 17430 | 1.88 | 20134 | 66836 | 46702 | 3.32 | 29272 |
| Salem | TMV-7 | 25600 | 63250 | 37650 | 2.47 | 26890 | 75432 | 48542 | 2.81 | 10892 |
| Theni | TMV-7 | 20368 | 43654 | 23286 | 2.14 | 20361 | 51730 | 31369 | 2.54 | 8083 |
| Villupuram | VRI-3, 2017 | 25485 | 62700 | 37215 | 2.46 | 26306 | 83945 | 57639 | 3.19 | 20424 |
| Total | 156367 | 322681 | 166315 | 157328 | 464462 | 307134 | 140819 | |||
| Average | 26061 | 53780 | 27719 | 2.06 | 26221 | 77410 | 51189 | 2.95 | 23470 | |
| Telangana | ||||||||||
| Adilabad | JCS-1020 | 29862 | 38340 | 8478 | 1.28 | 28210 | 54848 | 26638 | 1.94 | 18160 |
| Karimnagar | Hima, Swetha til, JCS-1020 | 20767 | 63411 | 42644 | 3.05 | 20939 | 78360 | 57421 | 3.74 | 14777 |
| Nalgonda | JCS-1020 | 16500 | 58500 | 42000 | 3.55 | 15632 | 74070 | 58438 | 4.74 | 16438 |
| Warangal | Swetha til | 22375 | 54858 | 32483 | 2.45 | 20540 | 62613 | 42073 | 3.05 | 9590 |
| Total | 89504 | 215109 | 125605 | 85321 | 269891 | 184570 | 58965 | |||
| Average | 22376 | 53777 | 31401 | 2.40 | 21330 | 67473 | 46143 | 3.16 | 14741 | |
| Zone Total | 501630 | 1125334 | 623704 | 496931 | 1496718 | 999787 | 376083 | |||
| Average | 23250 | 52173 | 28923 | 2.24 | 22914 | 69471 | 46557 | 3.03 | 17634 |
Table text extracted from the original PDF; superscript letters are shown inline. The original table image is below.
View original table image
| Cuddalore | TMV-7 | 40 | 100 | 8.5 | 8.27 | 5.25 | 57.52 | 0.23 | 3.02 | 2.71 |
|---|---|---|---|---|---|---|---|---|---|---|
| Karur | TMV-7 | 40 | 100 | 8.5 | 6.83 | 5.68 | 20.40 | 1.67 | 1.16 | 19.62 |
| Perambalur | VRI-3, 2017 | 20 | 50 | 9 | 7.2 | 4.15 | 73.49 | 1.80 | 3.05 | 20.00 |
| Salem | TMV-7 | 20 | 50 | 8.5 | 7.8 | 6.2 | 25.81 | 0.70 | 1.60 | 8.24 |
| Theni | TMV-7 | 50 | 125 | 8.5 | 7.20 | 5.83 | 23.51 | 1.30 | 1.37 | 15.33 |
| Villupuram | VRI-3, 2017 | 20 | 50 | 9 | 8.35 | 6.6 | 26.52 | 0.65 | 1.75 | 7.22 |
| Total | 190 | 475 | ||||||||
| Average | 8.67 | 7.61 | 5.62 | 35.45 | 1.06 | 1.99 | 36.41 | |||
| Telangana | ||||||||||
| Adilabad | JCS-1020, 2019 | 20 | 50 | 10 | 7.72 | 5.4 | 42.96 | 2.28 | 2.32 | 22.80 |
| Karimnagar | Hima, Swetha til, JCS-1020 | 160 | 400 | 9.6 | 8.78 | 7.9 | 11.18 | 0.82 | 0.88 | 8.51 |
| Nalgonda | JCS-1020 | 30 | 75 | 10 | 8.23 | 6.5 | 26.62 | 1.77 | 1.73 | 17.70 |
| Warangal | Swetha til | 30 | 75 | 10 | 7.62 | 6.6 | 15.45 | 2.38 | 1.02 | 23.80 |
| Total | 240 | 600 | ||||||||
| Average | 9.90 | 8.09 | 6.60 | 22.55 | 1.81 | 1.49 | 18.30 | |||
| Zone Total | 1425 | 3562 | ||||||||
| Average | 9.94 | 7.83 | 6.05 | 29.49 | 2.11 | 1.78 | 21.21 |
Table text extracted from the original PDF; superscript letters are shown inline. The original table image is below.
View original table image
Suggestions for reducing the yield gaps and increasing the returns in sesame 1. Availability of improved variety of seed before the commencement of season at reasonable rates. 2. Timely credit availability and remunerative price for the produce. 3. Organizing capacity building programmes and providing extension services to the farmers for creating awareness of improved varieties and latest production technologies. 4. Making latest information on technologies to be accessible to farmers through literature and mass media.
New HYV's by the farmers will subsequently change this alarming trend of galloping extension gap. The new technologies will eventually lead to the farmers to discontinuance of old varieties with the new technology.
References
21 in the original paper- Anonymous. Food and Agriculture Organization Statistical Databases (FAOSTAT); c2020. [http://faostat.fao.org/]. [Visited on 11 October, 2022].
- Amit Kaul, Seema Sharma and Bikramjit Singh. Yield gap analysis, economics and adoption of sesame cultivation through front line demonstration in Pathankot district of Punjab, India. International Journal of Current Microbiology and Applied Sciences 2020;9(9):1536-1544.
- Bamboriya SD, Singh G. Role of cluster frontline demonstrations in enhancement of sesame productivity. The Journal of Rural and Agricultural Research 2020;20 (2):41-43.
- Dubey SK, Gautam US, Singh AK, Singh A, Chahal VP, Singh AK, et al. Quantifying the yield gap minimization in lentil (Lens culinaris) under cluster frontline demonstrations (CFLD) conducted in Uttar Pradesh. Indian Journal of Agricultural Sciences 2018;88(6):851-859.
- Dubey SK, Gautam US, Singh AK. Pulses yield gap minimization: Consequences of CFLD-pulses in India. Indian Journal of Extension Education 2022;58(3):65www.extensionjournal.com 69.
- Govardhan Rao, Venkata Ramana. Performance of gingelly variety YLM-66 (SARADA) under rain fed conditions in the HAT zone Andhra Pradesh. Plant Achieves. 2017, 2022;17(2):1293-1296.
- Jeengar KL, Panwar P, Pareek OP. Front line demonstration on maize in Bhilwara district of Rajasthan. Current Agriculture. 2006;30(1-2):115-116.
- Kumar A, Kumar A, Jha KS, Singh SK. Appraisal of cluster front line demonstration on rapeseed and mustard in Bihar and Jharkhand. Indian Journal of Extension Education. 2022;58(1):31-35.
- Kumar A, Kumar A, Kumari P, Kumar S. Impact assessment of CFLD pulses on pigeonpea productivity and profitability in farmer's field. Indian Journal of Extension Education. 2023;59(2):36-40.
- Kumbhare NV, Dubey SK, Nain MS, Ram Bahal. Micro analysis of yield gap and profitability in pulses and cereals. Legume Research. 2014;37(5):532-536.
- Meena Ramkishan, Singh Bacchu, Meena KC, Meena RK, Singh B, Gurjar Prakash. Performance of front line demonstrations on sesame (Sesamum indicum L.) in Karauli district of Rajasthan, India. International Journal of Current Microbiology and Applied Sciences. 2018;7(3):1507-1511.
- Meena MS, Singh SK, Meena HN, Bishnoi R. Yield Gaps and Scaling up of Sesame Variety (RT-351) in Potential Areas of Rajasthan. Indian Journal of Extension Education. 2023;59(2):55-60.
- Myint D, Gilani A, Kawase M, Watanabe N. Sustainable sesame (Sesamum indicum L.) production through improved technology: An overview of production, challenges, and opportunities in Myanmar. Sustainability. 2020;12:3515.
- Naik A, Patil DH, Raju, Teggelli G, Zaheer AB. Productivity enhancement of sesame (Sesamum indicum L.) through improved production technologies/ frontline demonstrations. Research in Environment and Life Sciences. 2016;9(5):573-574.
- Parthasarathy Rao P, Birthal PS, Bhagavatula S, Bantilan MCS. Chickpea and Pigeonpea Economies in Asia: Facts, Trends and Outlook. International Crops Research Institute for the Semi-Arid Tropics. India, 2010, p. 76.
- Pathak N, Rai AK, Kumari R, Bhat KV. Value addition in sesame: A perspective on bioactive components for enhancing utility and profitability. Plant Reviews. 2014;8:147-155.
- Patil S, Mahale M, Chavan S, Shinde V. Impact of frontline demonstrations on oilseed crops in Konkan region of Maharashtra. Indian Research Journal of Extension Education. 2018;18(4):30-36.
- Piara Singh, Vijaya D, Srinivas K, Wani SP. Potential productivity, yield gap, and water balance of soybean chickpea sequential systematic selected benchmark sites in India. Journal of SAT Agricultural Research. 2006;2:1-50.
- Raikwar RS, Srivastva P. Productivity enhancement of sesame (Sesamum indicum L.) through improved production technologies. African Journal of Agricultural Research. 2013;8(47):6073-6078.
- Samui SK, Maitra S, Roy DK, Mandal AK and Saha D. Evaluation of Frontline demonstration on groundnut. Journal of Indian Society of Coastal Agricultural Research. 2000;18(2):180-183.
- Singh AK, Gautam US. Technological interventions for productivity improvement of sesame in Kymore plateau and Satpura hill zone of Madhya Pradesh. Indian Journal of Dryland Agriculture and Development. 2016;31(1):56-62.