
Research article · 2024 · Full text
International Journal of Agriculture Extension and Social DevelopmentEconomics of milk production in Maharashtra: A case study
Volume 7(3S) · Pages 39–43 · DOI: 10.33545/26180723.2024.v7.i3sa.384 ↗
Research areasLivestock Management and Performance ImprovementAgricultural Economics and Practices
Abstract
Author-writtenThe Vidarbha and Marathwada regions of Maharashtra State were selected for the study that examined the profitability of milk production as a whole and its numerous operational and managerial aspects. This region was chosen purposively since it produces less milk and has lower productivity compared to the rest of the state. In the years 2021 and 2022, 410 milk producers were randomly categorised into three groups: small (1-3 milch animals), medium (4 to 5 animals), and large (6 animals or more). Primarily, data was collected from these producers and tabular data analysis was carried out. The daily maintenance cost per milch animal of Rs. 150.75 for buffalo, Rs. 133.23 for crossbred cows, and Rs. 49.64 for local cows, out of all the different cost components, the greatest amount was spent on feed, which ranged from 66.24% for local cows, 61.64% for crossbred cows, and 64.80% for buffalo. Crossbred cows had the lowest average cost per liter of milk production at 23.75 rupees, while local cow buffalo had the highest at 42.10 rupees, buffalo at 33.23 rupees. When looking at net return per milch animal, the highest was Rs. 129.16 for buffalo, followed by Rs. 41.26 for crossbred. Rearing of local cow incur a loss of Rs. 3.39 per milch animal per day.
Summary
Source-checkedPlain-language reading of the full paper, prepared with AI and checked against the text. Each point links to the authors' own words.
Why it matters
- Dairy farming is vital to India's national economy, especially in rural regions, with small unorganized producers contributing 85% of the total milk production. View evidence ↗
- For poor rural populations, dairy farming provides better income prospects and more employment opportunities than traditional crop agriculture. View evidence ↗
- The Vidarbha and Marathwada regions of Maharashtra were specifically chosen for study because they exhibit lower milk productivity and production than other parts of the state. View evidence ↗
The question
- The study aims to determine the profitability of different breeds by comparing the costs and returns of milk production across various herd sizes. View evidence ↗
- The research specifically seeks to establish the relative profitability between local cattle, crossbred cattle, and buffalo. View evidence ↗
What they did
- Data was collected from 410 randomly selected milk producers across the Bhandara, Yavatmal, Nanded, and Latur districts. View evidence ↗
- Producers were categorized by herd size: small (1-3 animals), medium (4-5 animals), and large (more than 6 animals). View evidence ↗
- The economic analysis included both fixed and variable costs, with the net cost calculated by subtracting the imputed value of dung from the gross cost. View evidence ↗
What they found
- The overall daily maintenance cost per animal was highest for buffalo (Rs. 150.75), followed by crossbred cows (Rs. 133.23), and lowest for local cows (Rs. 49.64). View evidence ↗
- Feed was the largest cost component for all breeds, accounting for 66.24% of costs for local cows, 64.80% for buffalo, and 61.64% for crossbred cows. View evidence ↗
- Crossbred cows were the most efficient in terms of production cost per liter (Rs. 23.75), compared to buffalo (Rs. 33.23) and local cows (Rs. 42.10). View evidence ↗
- Buffalo provided the highest daily net return per animal (Rs. 129.16), followed by crossbred cows (Rs. 41.26), while local cows resulted in a daily loss of Rs. 3.39. View evidence ↗
- The study found that increasing herd size led to a decrease in the overall cost of milk production and an increase in the net returns per liter. View evidence ↗
What it means
- The authors recommend implementing a basic support price strategy for the milk industry, similar to crop pricing, to ensure fair prices and incentivize high-quality production. View evidence ↗
- The authors conclude that dairy profitability can be enhanced by improving milk yields and providing better extension services and healthcare for animals. View evidence ↗
Visual summary
3 visualsIllustrations explain the paper; charts are replotted from the paper's own table values.
Breed Profitability Comparison
AI-generated conceptual illustration (buffalo, crossbred cows, and local cows). It explains the idea and does not show study data.
View source evidence ↗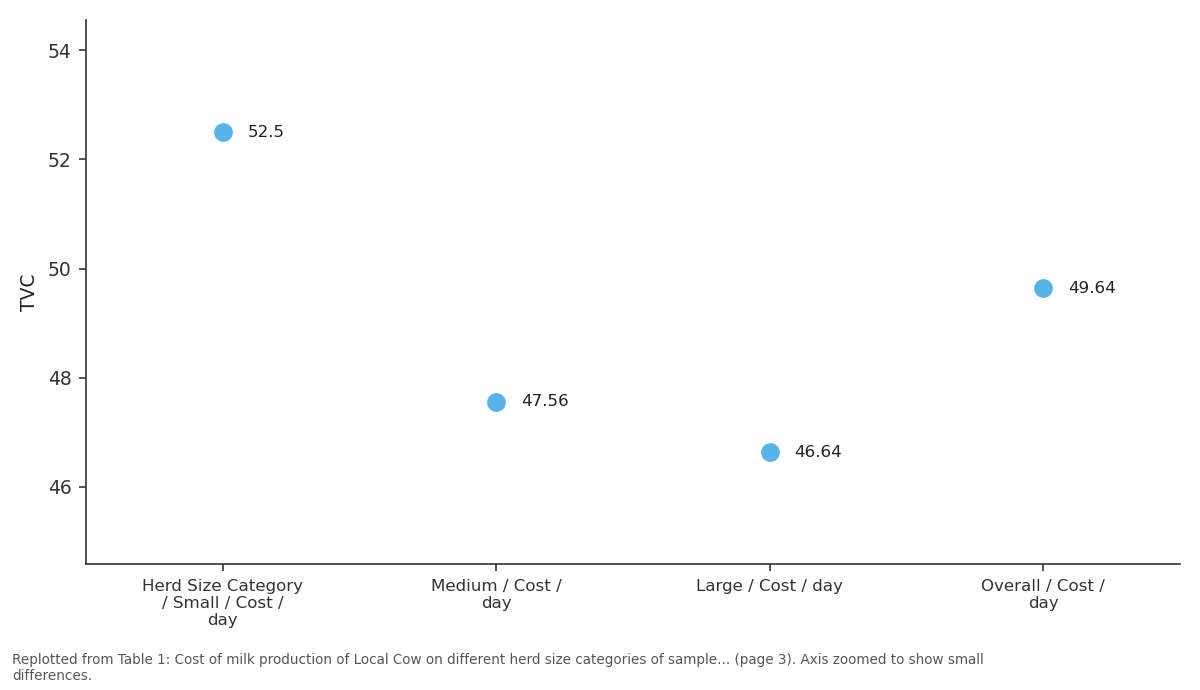
TVC: Herd Size Category /... vs Medium / Cost / day vs Large / Cost / day vs Overall / Cost / day
Replotted from Table 1 (page 3) of the original paper. Every bar is the paper's own table value.
View source evidence ↗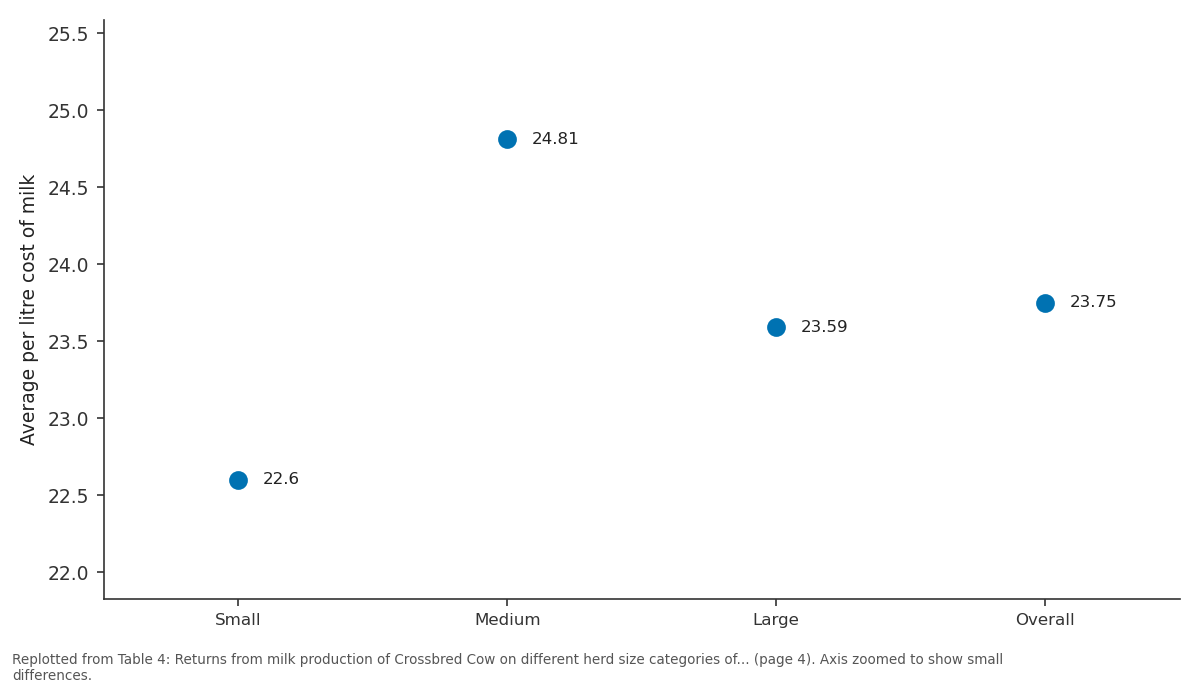
Average per litre cost of milk: Small vs Medium vs Large vs Overall
Replotted from Table 4 (page 4) of the original paper. Every bar is the paper's own table value.
View source evidence ↗Figures & tables
From the original paper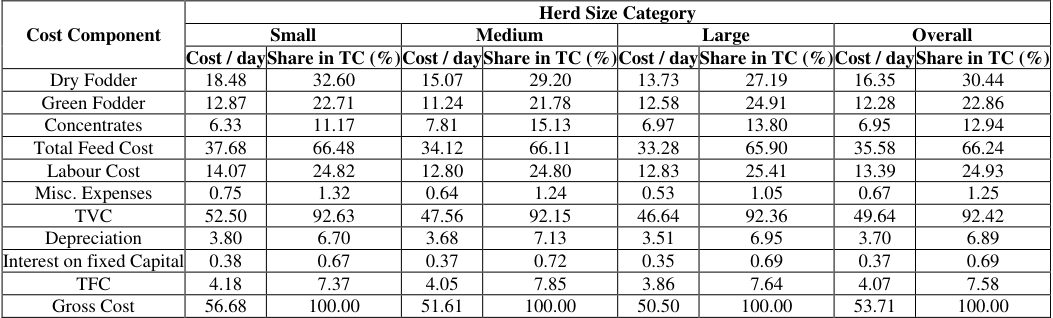 Table 1
 Table 2
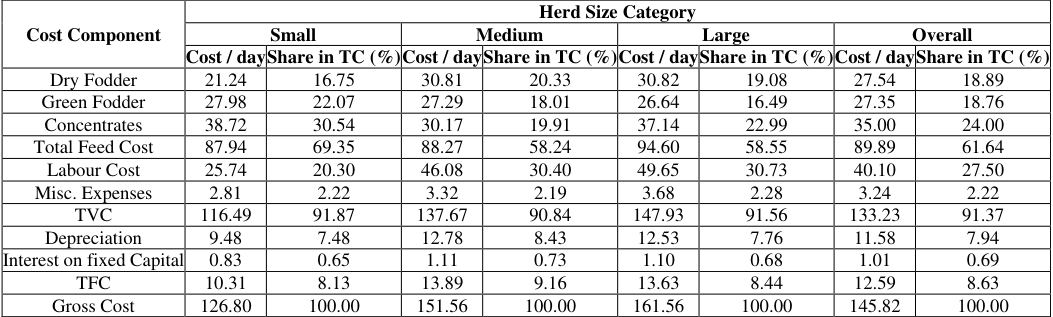 Table 3
 Table 4
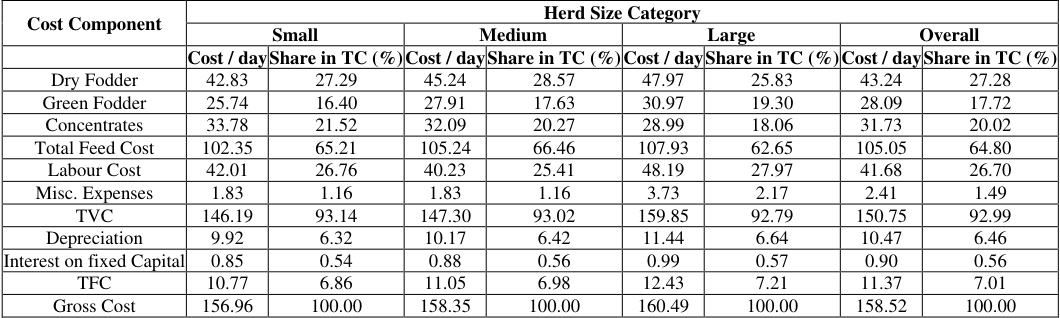 Table 5
 Table 6
Introduction
Dairy farming has a significant role in the national economy, particularly in rural areas, given that 85 percent of India's milk production is contributed to by small unorganized milk producers. More than seventy million rural households rely on the dairy products produced by smallholder farmers. Animal distribution is more equitable than land distribution. Based on land and livestock data from NCAP (2002), small and marginal farmers own 71% of cattle, 63% of buffalo, and 66% of small ruminants. This indicates that for impoverished rural populations, dairying offers more employment opportunities and income prospects than agricultural production. The livestock owners are about 85 percent are marginal and small milk producer, which is noteworthy. Even among policymakers, crop income surpasses livestock income, despite the fact that dairying offers more potential for poverty alleviation (Birthal & Taneja, 2006) [1] . Small and marginal producers are able to reduce risk and uncertainty through the dairy industry, which also provides a sustainable livelihood for impoverished individuals residing in disadvantaged regions of the nation. This study compares milk production costs and returns across herd sizes to determine breed profitability.
Additionally, the study will analyze the profitability of local, crossbred, and buffalo breeds to establish their relative profitability. Milk production is of great economic importance due to the fact that it generates a return on investment for milk producers. Assessing the profitability of dairy enterprises at the producer level is predominantly contingent upon the returns and expenses linked to milk production. As a consequence, milk production cost and return calculations are implemented. By comparing the returns and expenses associated with milk production across various herd sizes, this study attempts to determine the relative profitability of each breed. Additionally, the study will conduct a comparative analysis of the profitability of various breeds, such as buffalo, crossbred cattle, and local cattle, to ascertain the relative profitability of each breed.
Methodology
The Vidarbha and Marathwada regions of Maharashtra State were selected purposively due to their comparatively reduced milk production and productivity in comparison to other regions within the state. Primarily, data was collected from milk producers from Bhandara and Yavatmal districts from the Vidarbha region and Nanded and Latur districts from Marathwada regions were selected randomly and collected 410 samples. In relation to the herd size of their livestock, approximately 52.20 percent of milk producers are categorized as small, 30.98 percent as medium, and 16.83 percent as large. Two districts from each regions (Marathwada and Vidarbha) were chosen for the research. Two blocks were selected at random from every district. Additionally, three villages were selected at random from each block. As a consequence, 410 individuals were chosen to partake in the study, and a comprehensive inventory of all households in relation to milch animals was conducted. Each household that produced milk was categorized into one of three livestock sizes: small (1-3 milch animals), medium (4-5 milch animals), or large (over 6 milch animals).
Cost of Milk Production
It is important to investigate the cost of milk production because it helps to understand the complex issues involved in milk production and serves as the foundation for milk pricing. The cost of producing milk also shows how effectively production was done. Both fixed and variable costs were included in the total cost of producing milk. This section tries to provide a concise explanation of these expenditures.
A. Fixed Cost: Fixed cost consist of interton fixed capital and depreciation It is the loss of an asset's value as a result of use, wear and tear, accidental damage, and time obsolescence. It is calculated separately for milch animals, cattle sheds, machinery, and equipment, considering the present value and useful economic life. b) Interest on fixed capital: The fixed capital was the cost of dairy animals, cattle sheds, and dairy equipment used in milk production. The interest on fixed assets was calculated using the current bank interest rate of 10.5 percent. For the selected sample households, the annual interest rate was calculated per SAU and per day.
B. Variable Cost:
The cost that fluctuates with output, like milk production, is known as a variable cost. Variable costs include things like feed costs, labor costs, veterinarian charges, and other costs like ropes, chains, energy, water, minor repairs, and other miscellaneous fees. By calculating the actual quantities used per lactating animal per day and multiplying the physical units by the corresponding market prices or the actual cost incurred, depending on whether the input was farm produced or purchased from the local market, the variable cost of inputs, specifically feed, labour, was determined.
I. Feed and Fodder Cost
Green fodder, dry fodder, and concentrate costs were calculated by multiplying the quantities of feeds and fodders consumed by animals by the prevailing prices in the study area.
II. Labour Cost
It included both family and paid labour (hired labour). The hired labour was calculated based on the type of work assigned and the wages paid. In the case of family labour, the imputed value obtained is determined by the amount of time spent dairying and the prevailing wage rate for casual labour in the study area.
III. Veterinary Cost
Costs for natural services, artificial insemination (A.I.), vaccinations, medications, and veterinary doctor fees were all included.
IV. Miscellaneous Cost
Repairs, electricity, water charges, purchase of milk can, bucket, rope, and other miscellaneous costs are examples. They were calculated on a per milch cow per day basis for the various types of milch cows kept by the sample commercial dairy farms.
C. Gross Cost:
The total of fixed and variable costs is used to calculate the gross cost of milk production. This provides an overview of the total implicit and explicit costs associated with milk production.
Gross Cost = Total Variable Cost + Total Fixed Cost
D. Net Cost:
The sample households' net cost of milk production was calculated by subtracting the imputed value of dung from the gross cost.
Net Cost = Gross Cost-The imputed value of dung
E. Cost of Milk Production:
The cost of milk production per liter of milk was calculated by dividing the net cost per milch animal per day by the respective average milk yield per milch animal per day.
Gross Returns
Gross returns were obtained by multiplying the milk yield of an individual animal with respective prevailing prices in the study area, i.e.
Gross Returns = Quantity of milk X Market price of milk Net Returns Net return was calculated by subtracting net cost from gross returns, i.e.
Net Returns = Gross Returns-Net Cost
Cost per Liter of Milk Production
To calculate the cost per liter of milk, divide the average net maintenance cost per animal per day by the average milk production per animal per day, i.e. www.extensionjournal.com
Results and Discussion
The analysis of the costs involved in the production of milk across all kinds of milch animals is an important component of bovine husbandry. The results are in line with the findings of Chand et al. (2017) [2] , Meena et al. (2019) [7] and Rathore et al. (2020) [10] . 3. The overall total fixed cost was worked out to be Rs. 12.59, and the total amount of variable expenses was worked out to be Rs. 133.23 for overall categories of herd size farmers. The overall share of feed cost to the total variable cost was 61.64 percent varying from 69.35 percent for small, 58.24 percent for medium category to 58.55 percent for large herd size category of farmers. Labour cost was found to other major component in variable cost its overall cost Rs 40.10 per day, highest for large category was found to be Rs 49.65 and lowest for small category was found to be Rs 25.74.
Conclusion
In the present study on economic analysis of milk production, it was found that the overall cost of milk production decreased as the herd size increased, while the overall net returns per litre of milk increased with the herd size Negative net returns from local cow milk production do not mean milk production is unprofitable in the research area. Most of the milk production expenses in the study do not enter farmers' accounts because 60% of the resources are either farm-owned and have lower opportunity costs or communal and farmers do not pay directly. Farmers aren't losing much. However, improving milk yield and offering better health care and extension services can boost dairy profitability.
Figures and tables from the paper
| Cost Component | Herd Size Category | — | — | — | — | — | — | — |
|---|---|---|---|---|---|---|---|---|
| Small | Medium | Large | Overall | |||||
| Cost / day | Share in TC (%) | Cost / day | Share in TC (%) | Cost / day | Share in TC (%) | Cost / day | Share in TC (%) | |
| Dry Fodder | 18.48 | 32.60 | 15.07 | 29.20 | 13.73 | 27.19 | 16.35 | 30.44 |
| Green Fodder | 12.87 | 22.71 | 11.24 | 21.78 | 12.58 | 24.91 | 12.28 | 22.86 |
| Concentrates | 6.33 | 11.17 | 7.81 | 15.13 | 6.97 | 13.80 | 6.95 | 12.94 |
| Total Feed Cost | 37.68 | 66.48 | 34.12 | 66.11 | 33.28 | 65.90 | 35.58 | 66.24 |
| Labour Cost | 14.07 | 24.82 | 12.80 | 24.80 | 12.83 | 25.41 | 13.39 | 24.93 |
| Misc. Expenses | 0.75 | 1.32 | 0.64 | 1.24 | 0.53 | 1.05 | 0.67 | 1.25 |
| TVC | 52.50 | 92.63 | 47.56 | 92.15 | 46.64 | 92.36 | 49.64 | 92.42 |
| Depreciation | 3.80 | 6.70 | 3.68 | 7.13 | 3.51 | 6.95 | 3.70 | 6.89 |
| Interest on fixed Capital | 0.38 | 0.67 | 0.37 | 0.72 | 0.35 | 0.69 | 0.37 | 0.69 |
| TFC | 4.18 | 7.37 | 4.05 | 7.85 | 3.86 | 7.64 | 4.07 | 7.58 |
| Gross Cost | 56.68 | 100.00 | 51.61 | 100.00 | 50.50 | 100.00 | 53.71 | 100.00 |
Table text extracted from the original PDF; superscript letters are shown inline. The original table image is below.
View original table image
| Particulars of return from sale of milk | Small | Medium | Large | Overall |
|---|---|---|---|---|
| Average per litre cost of milk | 41.08 | 42.83 | 43.54 | 42.10 |
| Gross production cost of milk | 56.68 | 51.61 | 50.50 | 53.71 |
| Value of dung | 10.00 | 10.00 | 10.00 | 10.00 |
| Average net cost per animal per day | 46.68 | 41.61 | 40.50 | 43.71 |
| Average sale price of milk (Rs./litre) | 31.50 | 31.50 | 31.50 | 31.50 |
| Average milk yield per animal per day | 1.38 | 1.21 | 1.16 | 1.28 |
| Gross return per animal/day | 43.47 | 38.12 | 36.54 | 40.32 |
| Average net return per animal per day | -3.21 | -3.50 | -3.96 | -3.39 |
Table text extracted from the original PDF; superscript letters are shown inline. The original table image is below.
View original table image
| Cost Component | Herd Size Category | — | — | — | — | — | — | — |
|---|---|---|---|---|---|---|---|---|
| Small | Medium | Large | Overall | |||||
| Cost / day | Share in TC (%) | Cost / day | Share in TC (%) | Cost / day | Share in TC (%) | Cost / day | Share in TC (%) | |
| Dry Fodder | 21.24 | 16.75 | 30.81 | 20.33 | 30.82 | 19.08 | 27.54 | 18.89 |
| Green Fodder | 27.98 | 22.07 | 27.29 | 18.01 | 26.64 | 16.49 | 27.35 | 18.76 |
| Concentrates | 38.72 | 30.54 | 30.17 | 19.91 | 37.14 | 22.99 | 35.00 | 24.00 |
| Total Feed Cost | 87.94 | 69.35 | 88.27 | 58.24 | 94.60 | 58.55 | 89.89 | 61.64 |
| Labour Cost | 25.74 | 20.30 | 46.08 | 30.40 | 49.65 | 30.73 | 40.10 | 27.50 |
| Misc. Expenses | 2.81 | 2.22 | 3.32 | 2.19 | 3.68 | 2.28 | 3.24 | 2.22 |
| TVC | 116.49 | 91.87 | 137.67 | 90.84 | 147.93 | 91.56 | 133.23 | 91.37 |
| Depreciation | 9.48 | 7.48 | 12.78 | 8.43 | 12.53 | 7.76 | 11.58 | 7.94 |
| Interest on fixed Capital | 0.83 | 0.65 | 1.11 | 0.73 | 1.10 | 0.68 | 1.01 | 0.69 |
| TFC | 10.31 | 8.13 | 13.89 | 9.16 | 13.63 | 8.44 | 12.59 | 8.63 |
| Gross Cost | 126.80 | 100.00 | 151.56 | 100.00 | 161.56 | 100.00 | 145.82 | 100.00 |
Table text extracted from the original PDF; superscript letters are shown inline. The original table image is below.
View original table image
| Particulars of return from sale of milk | Small | Medium | Large | Overall |
|---|---|---|---|---|
| Average per litre cost of milk | 22.60 | 24.81 | 23.59 | 23.75 |
| Gross production cost of milk | 126.80 | 151.56 | 161.56 | 145.82 |
| Value of dung | 16.00 | 16.00 | 16 | 16.00 |
| Average net cost per animal per day | 110.80 | 135.56 | 145.56 | 129.82 |
| Average sale price of milk (Rs./litre) | 28.00 | 28.00 | 28.00 | 28.00 |
| Average milk yield per animal per day | 5.51 | 6.11 | 6.85 | 6.11 |
| Gross return per animal/day | 154.28 | 171.08 | 191.80 | 171.08 |
| Average net return per animal per day | 43.48 | 35.52 | 46.24 | 41.26 |
Table text extracted from the original PDF; superscript letters are shown inline. The original table image is below.
View original table image
| Cost Component | Herd Size Category | — | — | — | — | — | — | — |
|---|---|---|---|---|---|---|---|---|
| Small | Medium | Large | Overall | |||||
| Cost / day | Share in TC (%) | Cost / day | Share in TC (%) | Cost / day | Share in TC (%) | Cost / day | Share in TC (%) | |
| Dry Fodder | 42.83 | 27.29 | 45.24 | 28.57 | 47.97 | 25.83 | 43.24 | 27.28 |
| Green Fodder | 25.74 | 16.40 | 27.91 | 17.63 | 30.97 | 19.30 | 28.09 | 17.72 |
| Concentrates | 33.78 | 21.52 | 32.09 | 20.27 | 28.99 | 18.06 | 31.73 | 20.02 |
| Total Feed Cost | 102.35 | 65.21 | 105.24 | 66.46 | 107.93 | 62.65 | 105.05 | 64.80 |
| Labour Cost | 42.01 | 26.76 | 40.23 | 25.41 | 48.19 | 27.97 | 41.68 | 26.70 |
| Misc. Expenses | 1.83 | 1.16 | 1.83 | 1.16 | 3.73 | 2.17 | 2.41 | 1.49 |
| TVC | 146.19 | 93.14 | 147.30 | 93.02 | 159.85 | 92.79 | 150.75 | 92.99 |
| Depreciation | 9.92 | 6.32 | 10.17 | 6.42 | 11.44 | 6.64 | 10.47 | 6.46 |
| Interest on fixed Capital | 0.85 | 0.54 | 0.88 | 0.56 | 0.99 | 0.57 | 0.90 | 0.56 |
| TFC | 10.77 | 6.86 | 11.05 | 6.98 | 12.43 | 7.21 | 11.37 | 7.01 |
| Gross Cost | 156.96 | 100.00 | 158.35 | 100.00 | 160.49 | 100.00 | 158.52 | 100.00 |
Table text extracted from the original PDF; superscript letters are shown inline. The original table image is below.
View original table image
| Particulars of return from sale of milk | Small | Medium | Large | Overall |
|---|---|---|---|---|
| Average per litre cost of milk | 32.64 | 34.54 | 32.53 | 33.23 |
| Gross production cost of milk | 156.96 | 158.35 | 160.49 | 158.52 |
| Value of dung | 20.00 | 20.00 | 20.00 | 20.00 |
| Average net cost per animal per day | 136.96 | 138.35 | 140.49 | 138.52 |
| Average sale price of milk (Rs./litre) | 56.00 | 56.00 | 56.00 | 56.00 |
| Average milk yield per animal per day | 4.74 | 4.58 | 4.94 | 4.78 |
| Gross return per animal/day | 265.44 | 256.48 | 276.64 | 267.68 |
| Average net return per animal per day | 128.48 | 118.13 | 136.15 | 129.16 |
Table text extracted from the original PDF; superscript letters are shown inline. The original table image is below.
View original table image
References
10 in the original paper- Chand P, Sirohi S, Mishra A, Chahal VP. Estimation of costs and returns from dairying in Malwa region of Madhya Pradesh. Indian J. Animal. Sci. 2017;87(3):381-386.
- Chand P, Sirohi S, Saxena R, Mishra A. How profitable is dairying in tribal Chhattisgarh. Indian Journal of Animal Sciences. 2018;88(6):749-754.
- Pundir RS, Snehal M, Mahera AB, Zala YC, Trivedi MM. Economics of milk production and its disposal pattern in Central Gujarat. Indian Journal of Dairy Science. 2018;71(6):611-619.
- Athare PG, Ajay V, Malhotra R, Sendhil R. Economics of milk production in Pune district of Maharashtra: a comparative analysis. Indian Journal of Dairy Science. 2019;72(6):652-658.
- Shaikh FM, Singh R, Sirohi S. Economics of milk production and factors affecting milk yield in Meghalaya: Estimating the seasonal effect. Indian Journal of Dairy Science. 2019;72(3):328-335.
- Meena GL, Sharma L, Mishra S, Choudhary S. An economic analysis of milk production of Buffalo and Cow in Rajasthan. Indian Journal of Animal Nutrition. 2019;36(2):158-163.
- Subrahmanyeswari B, Jagadeeswara GCSR S. Economics of buffalo milk production in Guntur district of Andhra Pradesh. Indian J. Anim. Prod. Mgmt. 2020;35(1-2):84-89.
- Sharma JK, Singh NK. Economic studies on unorganized dairy farms in Jaipur region of Rajasthan. Journal of Livestock Science. 2020;11:127-132.
- Rathore R, Malhotra R, Chaudhary U, Jangid R. A comparative study on economics of milk production among self-help group members and non-members in Rajasthan. Indian J Dairy Sci. 2020;73(6):592-599.
- Mohapatra S, Singh A, Dixit AK, Malhotra R, Ponnusamy K. An economic analysis of milk production in Haryana. Indian J Dairy Sci. 2021;74(2):159-166.