
Research article · 2024 · Full text
International Journal of Advanced Biochemistry ResearchExamining the influence of drying methods and desiccants on the physical attributes of dried roses
Volume 8(2) · Pages 697–701 · DOI: 10.33545/26174693.2024.v8.i2i.660 ↗
Research areasGreenhouse Technology and Climate ControlFlowering Plant Growth and Cultivation
Abstract
Author-writtenRoses the reigning champions of the global cut flowers trade and India's leading floral export, boast numerous distinguishing features. In today's market augmenting value holds paramount importance. To delve deeper into this realm a comprehensive experiment was conducted between 2019 and 2020. Employing a fully randomized design with a factorial approach the study with two critical factors: drying methods and desiccants with three replications. Among the examined physical parameters the combination of sun drying with silica gel desiccant stood out. It yielded remarkable results including the highest weight loss percentages (1st day: 57.03%, 2nd day: 65.21% and 3rd day: 71.34%), the lowest moisture content percentages (1st day: 52.73% and 2nd day: 44.59%) and the most substantial moisture loss percentages (2nd day: 58.64%) during the drying process. Nevertheless when contemplating the reduction in flower diameter the shade drying method complemented by sea sand as a desiccant emerged as supremely effective displaying minimal diameter reduction (1st day: 0.56, 2nd day: 0.60, 3rd day: 0.63 and 4th day: 0.66). In summary, it can be concluded that sun drying with silica gel proves optimal for achieving desired physical parameters in rose flowers with the exception of flower diameter reduction, where shade drying with sea sand demonstrates superior suitability.
Summary
Source-checkedPlain-language reading of the full paper, prepared with AI and checked against the text. Each point links to the authors' own words.
Why it matters
- Roses are a primary floral export for India and a dominant product in the global cut flower trade. View evidence ↗
- Dried flowers are valued for their longevity, aesthetic appeal, and cost-effectiveness, as moisture removal reduces microbial aging. View evidence ↗
- India's dry flower industry is growing annually by 10% to 20%. View evidence ↗
The question
- The study aims to investigate how various drying methods and desiccants affect the physical characteristics and drying process of roses. View evidence ↗
What they did
- The experiment was conducted between 2019 and 2020 using a fully randomized factorial design with three replications, focusing on drying methods and desiccants. View evidence ↗
- The researchers used freshly harvested roses that were turgid, open, and in the tight bud stage. View evidence ↗
What they found
- The combination of sun drying and silica gel produced the highest weight loss percentages, reaching 71.34% by the third day. View evidence ↗
- The lowest weight loss percentages were observed when shade drying was combined with borax powder, with 55.78% on the third day. View evidence ↗
- Sun drying combined with silica gel resulted in the lowest moisture content on the first (52.73%) and second (44.59%) days. View evidence ↗
- The highest moisture content was found in the interaction of shade drying and borax powder, with 68.95% on the first day. View evidence ↗
- The combination of sun drying and silica gel achieved the highest moisture loss percentages, specifically 58.64% on the third day. View evidence ↗
- The lowest moisture loss percentages occurred with shade drying and borax powder, reaching 38.81% on the third day. View evidence ↗
- Shade drying combined with sea sand was the most effective at minimizing flower diameter reduction, with a reduction of 0.66 cm by the fourth day. View evidence ↗
- The greatest reduction in flower diameter occurred with sun drying without any desiccant, reaching 1.13 cm by the fourth day. View evidence ↗
What it means
- The authors conclude that sun drying with silica gel is the optimal method for maximizing weight loss and moisture loss while minimizing moisture content. View evidence ↗
- For the specific goal of minimizing flower diameter reduction, the authors recommend shade drying with sea sand. View evidence ↗
Visual summary
3 visualsIllustrations explain the paper; charts are replotted from the paper's own table values.
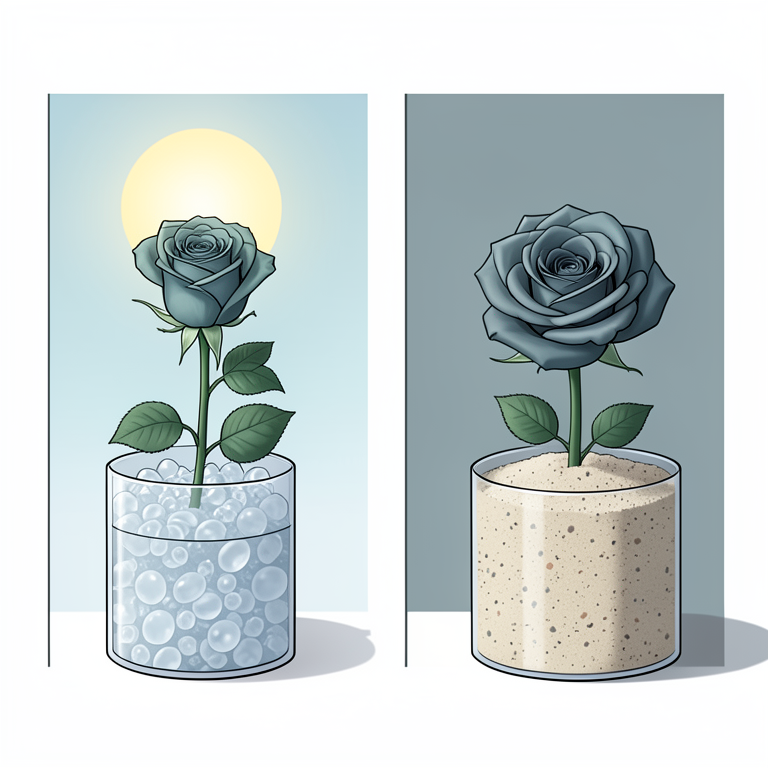
Optimal Drying Trade-offs
AI-generated conceptual illustration (cut roses (Rosa)). It explains the idea and does not show study data.
View source evidence ↗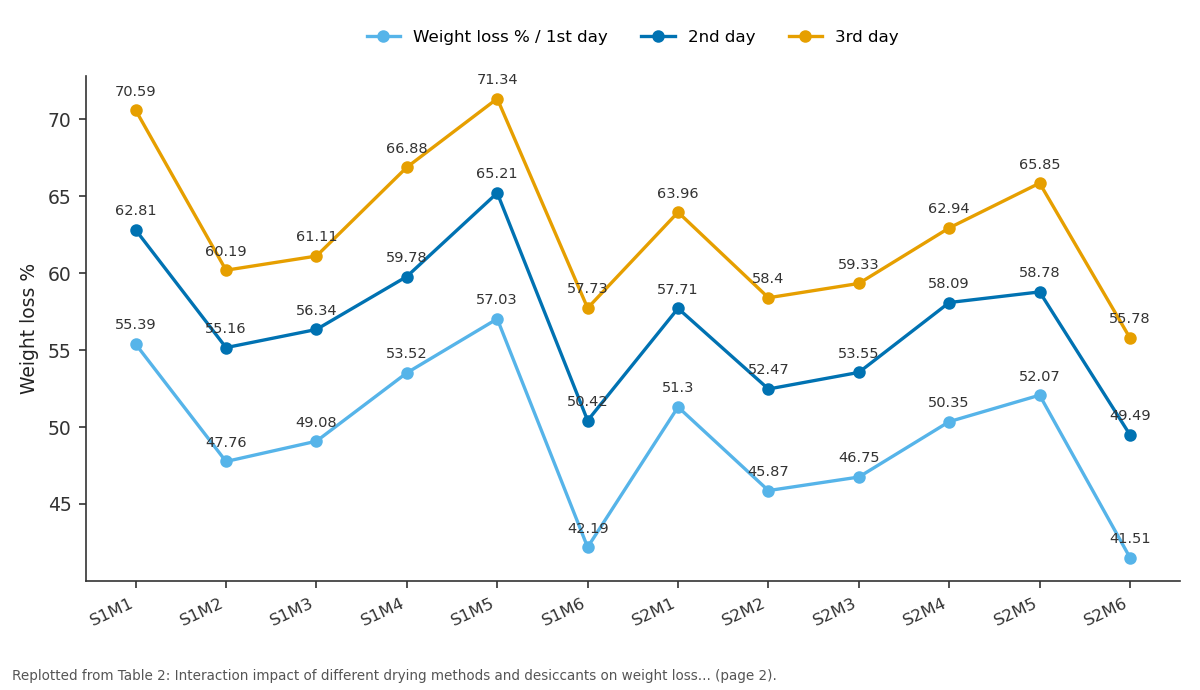
Weight loss % / 1st day and 2nd day and more: S1M1 vs S1M2 vs S1M3 vs S1M4 vs S1M5
Replotted from Table 2 (page 2) of the original paper. Every bar is the paper's own table value.
View source evidence ↗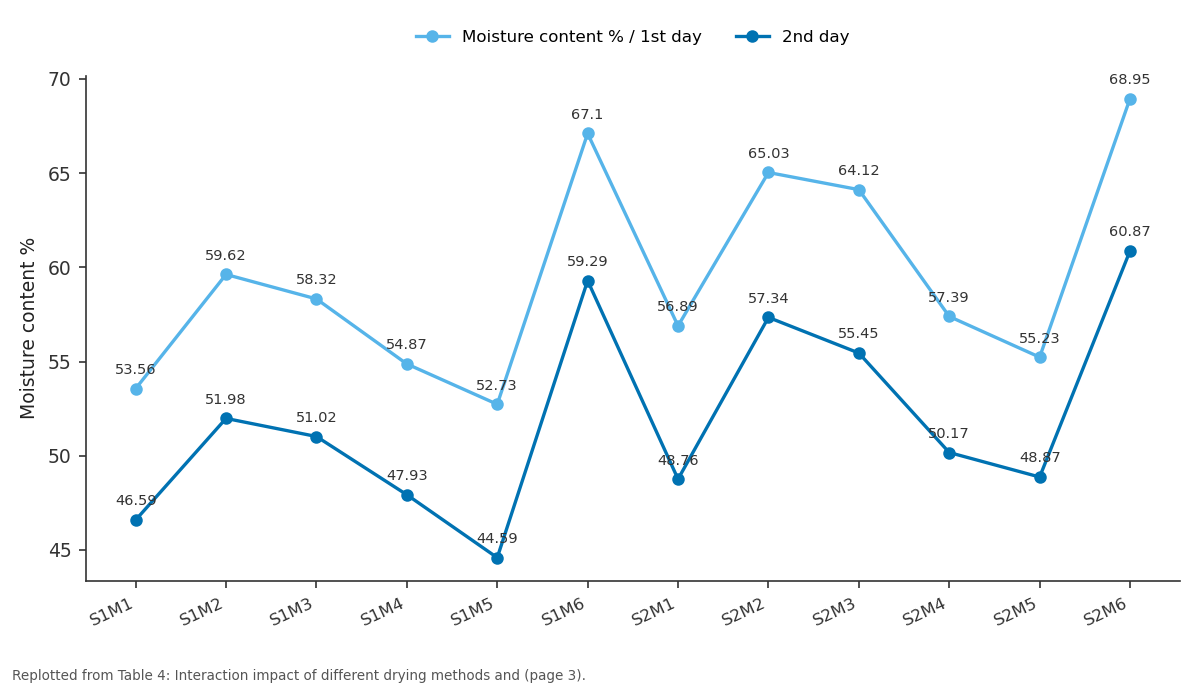
Moisture content % / 1st day and 2nd day: S1M1 vs S1M2 vs S1M3 vs S1M4 vs S1M5
Replotted from Table 4 (page 3) of the original paper. Every bar is the paper's own table value.
View source evidence ↗Figures & tables
From the original paper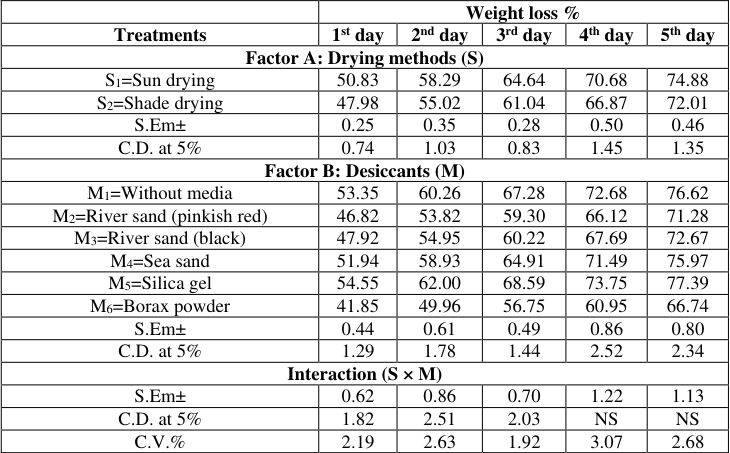 Table 1
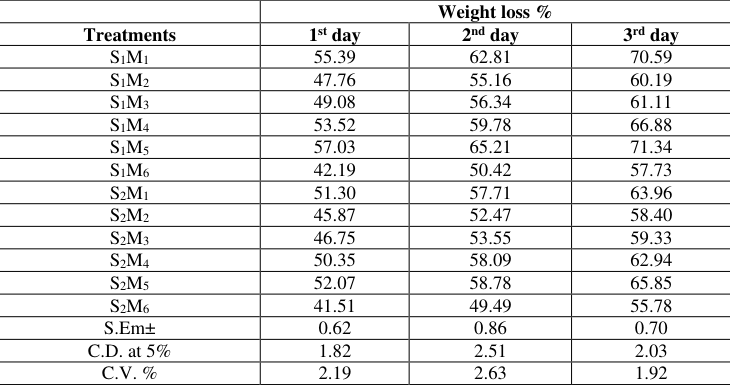 Table 2
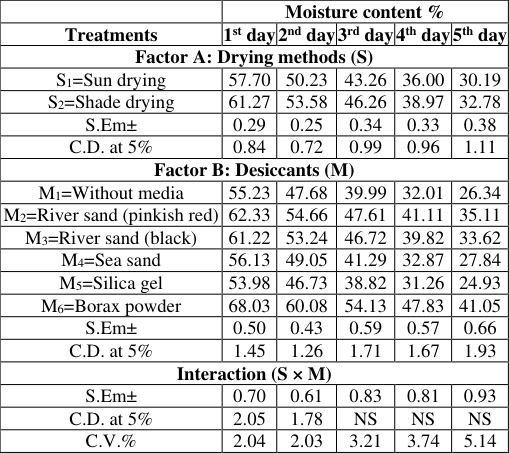 Table 3
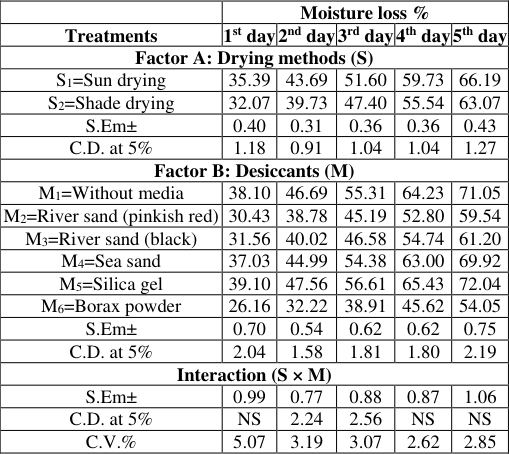 Table 5
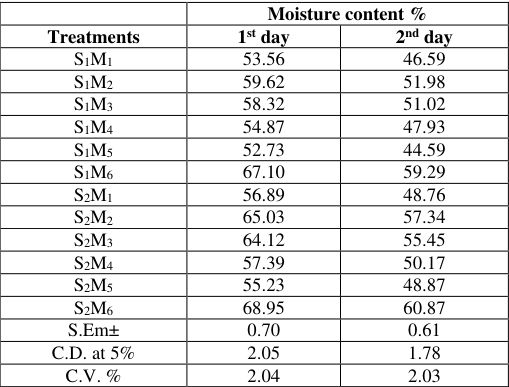 Table 4
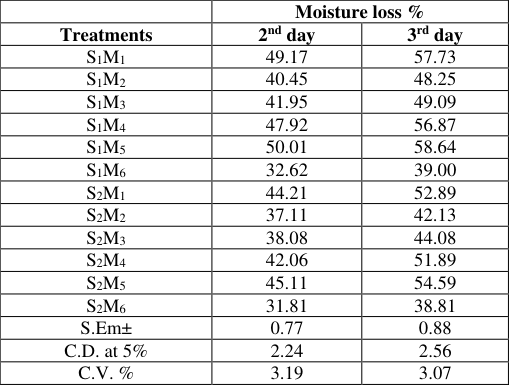 Table 6
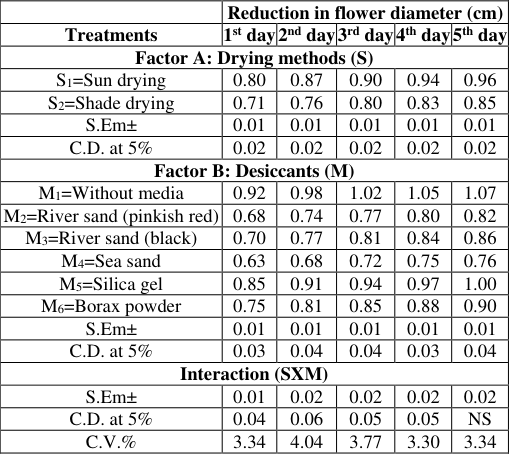 Table 7
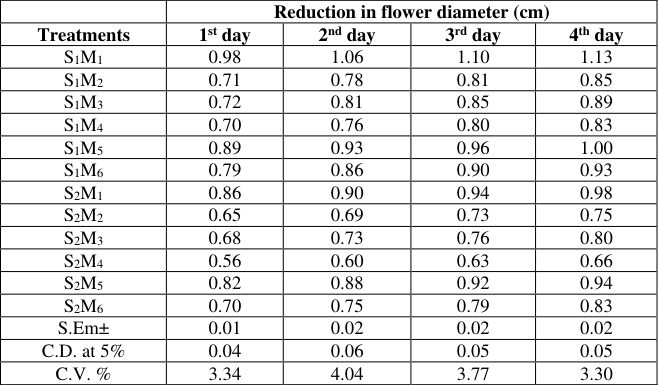 Table 8
Introduction
Flowers play a significant role in our nation's social and cultural traditions, being an essential part of celebrations. The dry flower industry in India is witnessing remarkable annual growth, ranging from 10-20 percent. India produces a wide variety of floriculture products, including fresh and dried flowers like roses, carnations, chrysanthemums, gladiolus, gerbera, anthurium and orchids. In the 2019-20 period, India successfully exported 16,949.37 metric tons of floriculture goods worth Rs. 541.61 crores. This success was attributed to extreme weather conditions in Europe and the scorching heat in Gulf countries. Key export destinations for Indian dried flowers include the United States, Israel, Hong Kong, Japan, Singapore and various West European nations. Dried flowers are favored for their enduring beauty, cost-effectiveness and reduced microbial aging due to moisture removal. They possess qualities like novelty, longevity, aesthetics, flexibility and year-round availability. This study delves into the impact of different drying methods and desiccants on the physical attributes of dried roses providing insights into their effects on the drying process and resulting characteristics.
Materials and Methods
Materials and Methods
Selection of flowers for drying
Flowers selected for drying were chosen for uniformity in size, shape, color and maturity. Only open, turgid and freshly harvested roses in the tight bud stage were used. Harvested in the early morning cut ends were immediately placed in water. In the laboratory, damaged or pest-infested flowers were discarded and uniform stem lengths were ensured before embedding with flower weight and diameter recorded.
Sea sand:
Particle size between 0.02 to 0.2 mm. It underwent thorough washing with tap water, sun drying to remove moisture and sieving for impurity removal. 4. Silica gel: Mesh size 9-12 with a diameter range of 2.68-1.19 mm. 5. Borax powder: High-quality analytical grade.
Results and Discussion
Weight loss (%) Different drying methods significantly influenced weight loss percentages. Sun drying exhibited the highest percentages (1 st day: 50.83%, 2 nd day: 58.29%, 3 rd day: 64.64%, 4 th day: 70.68% and 5 th day: 74.88%) while shade drying had the lowest. Silica gel embedding resulted in the highest weight loss percentage (1 st day: 54.55%, 2 nd day: 62.00%, 3 rd day: 68.59%, 4 th day: 73.75% and 5 th day: 77.39%) comparable to drying without desiccant. Borax powder embedding had the lowest weight loss percentages (1 st day: 41.85%, 2 nd day: 49.96%, 3 rd day: 56.75%, 4 th day: 60.95% and 5 th day: 66.74%). Interaction effects were significant with sun drying combined with silica gel resulting in the highest weight loss percentages (1 st day: 57.03%, 2 nd day: 65.21% and 3 rd day: 71.34%) comparable to sun drying without desiccant (Table 1). This can be attributed to the synergy of elevated temperatures and reduced humidity during sun drying coupled with the exceptional moisture-absorbing properties of silica gel desiccant which hastens moisture removal and results in the highest weight loss percentages. Conversely, shade drying combined with borax powder had the lowest percentages (1 st day: 41.51%, 2 nd day: 49.49% and 3 rd day: 55.78%) because shade drying requires more time for drying and the formation of lumps by borax desiccant slows down moisture loss reducing the weight loss percentage. These findings align with previous studies on China aster (Meman, 2006) [9] and various flowers (Khyati, 2015) [8] (Table 2). [14,10,13,4,5,1,2] (Table 4). [7,6,11,16] (Table 6). [15] , carnation (Nirmala et al., 2008) [12] and various flowers (Khyati, 2015) [8] .
| — | Moisture loss % | — |
|---|---|---|
| Treatments | 2nd day | 3rd day |
| S1M1 | 49.17 | 57.73 |
| S1M2 | 40.45 | 48.25 |
| S1M3 | 41.95 | 49.09 |
| S1M4 | 47.92 | 56.87 |
| S1M5 | 50.01 | 58.64 |
| S1M6 | 32.62 | 39.00 |
| S2M1 | 44.21 | 52.89 |
| S2M2 | 37.11 | 42.13 |
| S2M3 | 38.08 | 44.08 |
| S2M4 | 42.06 | 51.89 |
| S2M5 | 45.11 | 54.59 |
| S2M6 | 31.81 | 38.81 |
| S.Em± | 0.77 | 0.88 |
| C.D. at 5% | 2.24 | 2.56 |
| C.V. % | 3.19 | 3.07 |
Table text extracted from the original PDF; superscript letters are shown inline. The original table image is below.
View original table image
| — | Moisture content % | — |
|---|---|---|
| Treatments | 1st day | 2nd day |
| S1M1 | 53.56 | 46.59 |
| S1M2 | 59.62 | 51.98 |
| S1M3 | 58.32 | 51.02 |
| S1M4 | 54.87 | 47.93 |
| S1M5 | 52.73 | 44.59 |
| S1M6 | 67.10 | 59.29 |
| S2M1 | 56.89 | 48.76 |
| S2M2 | 65.03 | 57.34 |
| S2M3 | 64.12 | 55.45 |
| S2M4 | 57.39 | 50.17 |
| S2M5 | 55.23 | 48.87 |
| S2M6 | 68.95 | 60.87 |
| S.Em± | 0.70 | 0.61 |
| C.D. at 5% | 2.05 | 1.78 |
| C.V. % | 2.04 | 2.03 |
Table text extracted from the original PDF; superscript letters are shown inline. The original table image is below.
View original table image
| — | Weight loss % | — | — |
|---|---|---|---|
| Treatments | 1st day | 2nd day | 3rd day |
| S1M1 | 55.39 | 62.81 | 70.59 |
| S1M2 | 47.76 | 55.16 | 60.19 |
| S1M3 | 49.08 | 56.34 | 61.11 |
| S1M4 | 53.52 | 59.78 | 66.88 |
| S1M5 | 57.03 | 65.21 | 71.34 |
| S1M6 | 42.19 | 50.42 | 57.73 |
| S2M1 | 51.30 | 57.71 | 63.96 |
| S2M2 | 45.87 | 52.47 | 58.40 |
| S2M3 | 46.75 | 53.55 | 59.33 |
| S2M4 | 50.35 | 58.09 | 62.94 |
| S2M5 | 52.07 | 58.78 | 65.85 |
| S2M6 | 41.51 | 49.49 | 55.78 |
| S.Em± | 0.62 | 0.86 | 0.70 |
| C.D. at 5% | 1.82 | 2.51 | 2.03 |
| C.V. % | 2.19 | 2.63 | 1.92 |
Table text extracted from the original PDF; superscript letters are shown inline. The original table image is below.
View original table image
| — | Weight loss % | — | — | — | — |
|---|---|---|---|---|---|
| Treatments | 1st day | 2nd day | 3rd day | 4th day | 5th day |
| Factor A: Drying methods (S) | |||||
| S1=Sun drying | 50.83 | 58.29 | 64.64 | 70.68 | 74.88 |
| S2=Shade drying | 47.98 | 55.02 | 61.04 | 66.87 | 72.01 |
| S.Em± | 0.25 | 0.35 | 0.28 | 0.50 | 0.46 |
| C.D. at 5% | 0.74 | 1.03 | 0.83 | 1.45 | 1.35 |
| Factor B: Desiccants (M) | |||||
| M1=Without media | 53.35 | 60.26 | 67.28 | 72.68 | 76.62 |
| M2=River sand (pinkish red) | 46.82 | 53.82 | 59.30 | 66.12 | 71.28 |
| M3=River sand (black) | 47.92 | 54.95 | 60.22 | 67.69 | 72.67 |
| M4=Sea sand | 51.94 | 58.93 | 64.91 | 71.49 | 75.97 |
| M5=Silica gel | 54.55 | 62.00 | 68.59 | 73.75 | 77.39 |
| M6=Borax powder | 41.85 | 49.96 | 56.75 | 60.95 | 66.74 |
| S.Em± | 0.44 | 0.61 | 0.49 | 0.86 | 0.80 |
| C.D. at 5% | 1.29 | 1.78 | 1.44 | 2.52 | 2.34 |
| Interaction (S × M) | |||||
| S.Em± | 0.62 | 0.86 | 0.70 | 1.22 | 1.13 |
| C.D. at 5% | 1.82 | 2.51 | 2.03 | NS | NS |
| C.V.% | 2.19 | 2.63 | 1.92 | 3.07 | 2.68 |
Table text extracted from the original PDF; superscript letters are shown inline. The original table image is below.
View original table image
Conclusion
The results of this study revealed that sun drying with silica gel as a desiccant yielded the best outcomes for most physical parameters including weight loss percentage, moisture content percentage and moisture loss percentage. However, when it came to the reduction in flower diameter shade drying with sea sand was found to be the most effective.
Acknowledgement
AcknowledgmentThe first author expresses gratitude to the Department of Horticulture, College of Agriculture in Junagadh, Gujarat.
Figures and tables from the paper
| — | Moisture content % | — | — | — | — |
|---|---|---|---|---|---|
| Treatments | 1st day | 2nd day | 3rd day | 4th day | 5th day |
| Factor A: Drying methods (S) | |||||
| S1=Sun drying | 57.70 | 50.23 | 43.26 | 36.00 | 30.19 |
| S2=Shade drying | 61.27 | 53.58 | 46.26 | 38.97 | 32.78 |
| S.Em± | 0.29 | 0.25 | 0.34 | 0.33 | 0.38 |
| C.D. at 5% | 0.84 | 0.72 | 0.99 | 0.96 | 1.11 |
| Factor B: Desiccants (M) | |||||
| M1=Without media | 55.23 | 47.68 | 39.99 | 32.01 | 26.34 |
| M2=River sand (pinkish red) | 62.33 | 54.66 | 47.61 | 41.11 | 35.11 |
| M3=River sand (black) | 61.22 | 53.24 | 46.72 | 39.82 | 33.62 |
| M4=Sea sand | 56.13 | 49.05 | 41.29 | 32.87 | 27.84 |
| M5=Silica gel | 53.98 | 46.73 | 38.82 | 31.26 | 24.93 |
| M6=Borax powder | 68.03 | 60.08 | 54.13 | 47.83 | 41.05 |
| S.Em± | 0.50 | 0.43 | 0.59 | 0.57 | 0.66 |
| C.D. at 5% | 1.45 | 1.26 | 1.71 | 1.67 | 1.93 |
| Interaction (S × M) | |||||
| S.Em± | 0.70 | 0.61 | 0.83 | 0.81 | 0.93 |
| C.D. at 5% | 2.05 | 1.78 | NS | NS | NS |
| C.V.% | 2.04 | 2.03 | 3.21 | 3.74 | 5.14 |
Table text extracted from the original PDF; superscript letters are shown inline. The original table image is below.
View original table image
| — | Moisture loss % | — | — | — | — |
|---|---|---|---|---|---|
| Treatments | 1st day | 2nd day | 3rd day | 4th day | 5th day |
| Factor A: Drying methods (S) | |||||
| S1=Sun drying | 35.39 | 43.69 | 51.60 | 59.73 | 66.19 |
| S2=Shade drying | 32.07 | 39.73 | 47.40 | 55.54 | 63.07 |
| S.Em± | 0.40 | 0.31 | 0.36 | 0.36 | 0.43 |
| C.D. at 5% | 1.18 | 0.91 | 1.04 | 1.04 | 1.27 |
| Factor B: Desiccants (M) | |||||
| M1=Without media | 38.10 | 46.69 | 55.31 | 64.23 | 71.05 |
| M2=River sand (pinkish red) | 30.43 | 38.78 | 45.19 | 52.80 | 59.54 |
| M3=River sand (black) | 31.56 | 40.02 | 46.58 | 54.74 | 61.20 |
| M4=Sea sand | 37.03 | 44.99 | 54.38 | 63.00 | 69.92 |
| M5=Silica gel | 39.10 | 47.56 | 56.61 | 65.43 | 72.04 |
| M6=Borax powder | 26.16 | 32.22 | 38.91 | 45.62 | 54.05 |
| S.Em± | 0.70 | 0.54 | 0.62 | 0.62 | 0.75 |
| C.D. at 5% | 2.04 | 1.58 | 1.81 | 1.80 | 2.19 |
| Interaction (S × M) | |||||
| S.Em± | 0.99 | 0.77 | 0.88 | 0.87 | 1.06 |
| C.D. at 5% | NS | 2.24 | 2.56 | NS | NS |
| C.V.% | 5.07 | 3.19 | 3.07 | 2.62 | 2.85 |
Table text extracted from the original PDF; superscript letters are shown inline. The original table image is below.
View original table image
| — | Reduction in flower diameter (cm) | — | — | — | — |
|---|---|---|---|---|---|
| Treatments | 1st day | 2nd day | 3rd day | 4th day | 5th day |
| Factor A: Drying methods (S) | |||||
| S1=Sun drying | 0.80 | 0.87 | 0.90 | 0.94 | 0.96 |
| S2=Shade drying | 0.71 | 0.76 | 0.80 | 0.83 | 0.85 |
| S.Em± | 0.01 | 0.01 | 0.01 | 0.01 | 0.01 |
| C.D. at 5% | 0.02 | 0.02 | 0.02 | 0.02 | 0.02 |
| Factor B: Desiccants (M) | |||||
| M1=Without media | 0.92 | 0.98 | 1.02 | 1.05 | 1.07 |
| M2=River sand (pinkish red) | 0.68 | 0.74 | 0.77 | 0.80 | 0.82 |
| M3=River sand (black) | 0.70 | 0.77 | 0.81 | 0.84 | 0.86 |
| M4=Sea sand | 0.63 | 0.68 | 0.72 | 0.75 | 0.76 |
| M5=Silica gel | 0.85 | 0.91 | 0.94 | 0.97 | 1.00 |
| M6=Borax powder | 0.75 | 0.81 | 0.85 | 0.88 | 0.90 |
| S.Em± | 0.01 | 0.01 | 0.01 | 0.01 | 0.01 |
| C.D. at 5% | 0.03 | 0.04 | 0.04 | 0.03 | 0.04 |
| Interaction (SXM) | |||||
| S.Em± | 0.01 | 0.02 | 0.02 | 0.02 | 0.02 |
| C.D. at 5% | 0.04 | 0.06 | 0.05 | 0.05 | NS |
| C.V.% | 3.34 | 4.04 | 3.77 | 3.30 | 3.34 |
Table text extracted from the original PDF; superscript letters are shown inline. The original table image is below.
View original table image
| — | Reduction in flower diameter (cm) | — | — | — |
|---|---|---|---|---|
| Treatments | 1st day | 2nd day | 3rd day | 4th day |
| S1M1 | 0.98 | 1.06 | 1.10 | 1.13 |
| S1M2 | 0.71 | 0.78 | 0.81 | 0.85 |
| S1M3 | 0.72 | 0.81 | 0.85 | 0.89 |
| S1M4 | 0.70 | 0.76 | 0.80 | 0.83 |
| S1M5 | 0.89 | 0.93 | 0.96 | 1.00 |
| S1M6 | 0.79 | 0.86 | 0.90 | 0.93 |
| S2M1 | 0.86 | 0.90 | 0.94 | 0.98 |
| S2M2 | 0.65 | 0.69 | 0.73 | 0.75 |
| S2M3 | 0.68 | 0.73 | 0.76 | 0.80 |
| S2M4 | 0.56 | 0.60 | 0.63 | 0.66 |
| S2M5 | 0.82 | 0.88 | 0.92 | 0.94 |
| S2M6 | 0.70 | 0.75 | 0.79 | 0.83 |
| S.Em± | 0.01 | 0.02 | 0.02 | 0.02 |
| C.D. at 5% | 0.04 | 0.06 | 0.05 | 0.05 |
| C.V. % | 3.34 | 4.04 | 3.77 | 3.30 |
Table text extracted from the original PDF; superscript letters are shown inline. The original table image is below.
View original table image
References
11 in the original paper- Aravinda K, Jayanthi R. Standardization of drying techniques for chrysanthemum (Dendranthema grandiflora Tzvleve cv. Button Type Local) flowers. J Ornamental Hort. 2004;7(3-4):370-375.
- Bhalla R, Moona L, Dhiman SR, Thakur KS. Standardization of drying techniques of chrysanthemum (Dendranthema grandiflorum Tzvelev). J Ornamental Hort. 2006;9(3):159-163.
- Dahiya DS, Unnikrishnan D, Gupta AK, Sehrawat SK, Siddiqui S. Dehydration of annual chrysanthemum (C. coronarium). Acta Hort. 2003;624:385-388.
- Desh Raj D, Gupta PK. Standardization of dehydration technology for ornamental plant parts of shrubs from mid-hills of Himachal Pradesh. J Ornam Hort. 2003;6(4):357-361.
- Dubois P, Joyce D. Drying cut flowers and foliage. [Internet] Available from: www.agric.wa.gov [Accessed on 24 March 2020].
- Meman MA, Barad AV, Raval LJ. Effect of drying conditions and embedding material on post-harvest quantitative parameters in china aster (Callistephus chinensis) flowers. J Hort Sci. 2006;1(1):48-51.
- Nair B, Singh KP. Aesthetic quality of chrysanthemum flowers as affected by the desiccants. Agro Crop Sci. 2011, 2(2).
- Nirmala A, Chandrashekhar R, Padma M, Rajkumar M. Standardization of drying techniques of carnation. J Ornam Hort. 2008;11(3):168-172.
- Roberts A. Drying flowers. [Internet] Available from: http://www.aggiehorticulture.tamu.edu/plantanswers/mi sc/dryflowers.html.in [Accessed on 39 March 2020].
- Sujatha AN, Damodaran T, Shiva KN. Dry flower industry in Andamans. Kisan World. 2001;28:28.
- Wilson D, Attri BL, Sharma SK. Evaluation of different methods for drying of chrysanthemum flowers. The Asian J of Hort. 2013;8(2):743-745.