
Research article · 2024 · Full text
International Journal of Advanced Biochemistry ResearchCorrelation studies for yield and yield attributing traits in rice (Oryza sativa L.)
Volume 8(2) · Pages 571–576 · DOI: 10.33545/26174693.2024.v8.i2sh.646 ↗
Research areasRice Cultivation and Yield Improvement
Abstract
Author-writtenA staple food for most Asians, rice is a cultivated plant in the Poaceae family. Genetic modification and rice farming have generated a lot of research and development work, especially in the areas of production and grain quality. A major contributing reason to the rising cost and duration of rice harvesting, lodging frequently results in a notable reduction in output. One strategy is to identify a novel plant species possessing the perfect shape, big panicles, high photosynthetic efficiency, and resistance to lodging. The study was conducted at the Department of Genetics and Plant Breeding, Research Cum Instructional Farm, College of Agriculture, Indira Gandhi Krishi Vishwavidyalaya, Raipur, Chhattisgarh, India. 32 rice genotypes, including four checks (IR-64, Indira aerobic-1, Pusa 1121, and Dubraj selection-1) were included in the experimental materials. The study was conducted at the Department of Genetics and Plant Breeding, Research Cum Instructional Farm, College of Agriculture, Indira Gandhi Krishi Vishwavidyalaya, Raipur, Chhattisgarh, India. 32 rice genotypes, including four checks (IR-64, Indira aerobic-1, Pusa 1121, and Dubraj selection-1) were included in the experimental materials. In light of this, the current study found a correlation between yield and lodging resistance that may be exploited in subsequent crop enhancement initiatives.
Summary
Source-checkedPlain-language reading of the full paper, prepared with AI and checked against the text. Each point links to the authors' own words.
Why it matters
- Rice is a critical global food source, supporting 2.5 billion people and utilizing 9% of the world's arable land. View evidence ↗
- Lodging in rice crops is a significant problem because it often leads to a notable reduction in output and increases harvesting costs and duration. View evidence ↗
- Long culm rice varieties could potentially increase biomass yield if their susceptibility to lodging is addressed. View evidence ↗
The question
- The study aimed to identify correlations between yield and lodging resistance to provide a basis for future crop improvement initiatives. View evidence ↗
What they did
- The research used 32 rice genotypes, including four check varieties, during the Kharif season of 2017. View evidence ↗
- The experiment was carried out at the Research cum Instructional Farm in Raipur, Chhattisgarh, India. View evidence ↗
- The study employed a Randomized Complete Block Design (RCBD) with two replications for the 32 genotypes. View evidence ↗
- Mutual relationships between traits were measured using the correlation analysis formula suggested by Webber and Moorthy (1952). View evidence ↗
What they found
- Days to 50% flowering showed a highly significant positive correlation (0.49) with both biological yield and lower biological yield. View evidence ↗
- Plant height was significantly and positively correlated with culm length, with a coefficient of 0.92. View evidence ↗
- Panicle dry weight per plant had a very strong, highly significant positive correlation (0.99) with grain yield per plant. View evidence ↗
- Cellulose content was significantly and negatively correlated with lodging incidence (-0.95), suggesting higher cellulose may reduce lodging. View evidence ↗
- The length/breadth (L/B) ratio of the paddy was significantly negatively correlated with paddy width (-0.67) and positively correlated with paddy length (0.59). View evidence ↗
- The diameter of the top internode was positively correlated with lodging incidence (0.34) and highly negatively correlated with the harvest index (-0.53). View evidence ↗
What it means
- The authors concluded that there is a substantial link between yield and lodging across several critical plant characteristics. View evidence ↗
- The authors state that this correlation analysis provides breeders with the necessary foundation to select landraces possessing favorable traits for improvement. View evidence ↗
Visual summary
1 visualsIllustrations explain the paper; they do not show study data.
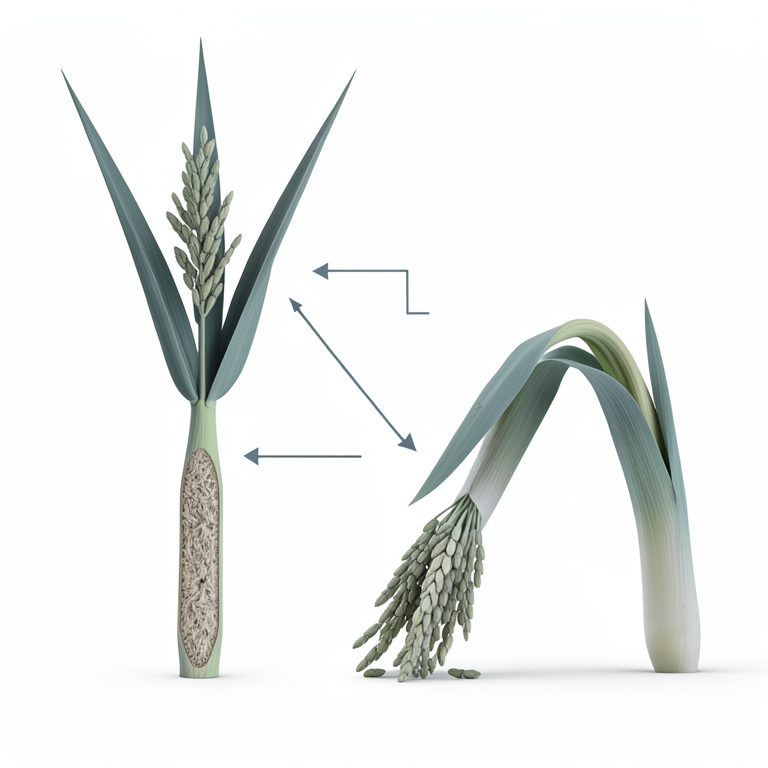
Factors Influencing Lodging
AI-generated conceptual illustration (Rice plants (Oryza sativa L.)). It explains the idea and does not show study data.
View source evidence ↗Figures & tables
From the original paper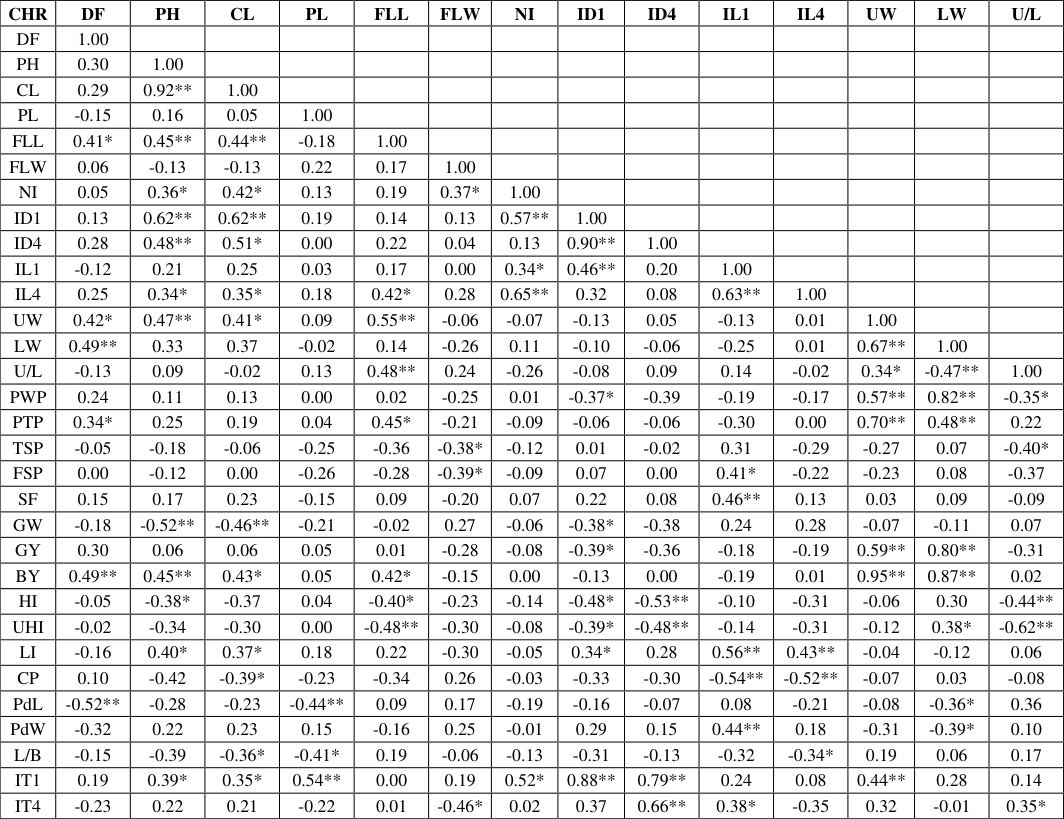 Table 1
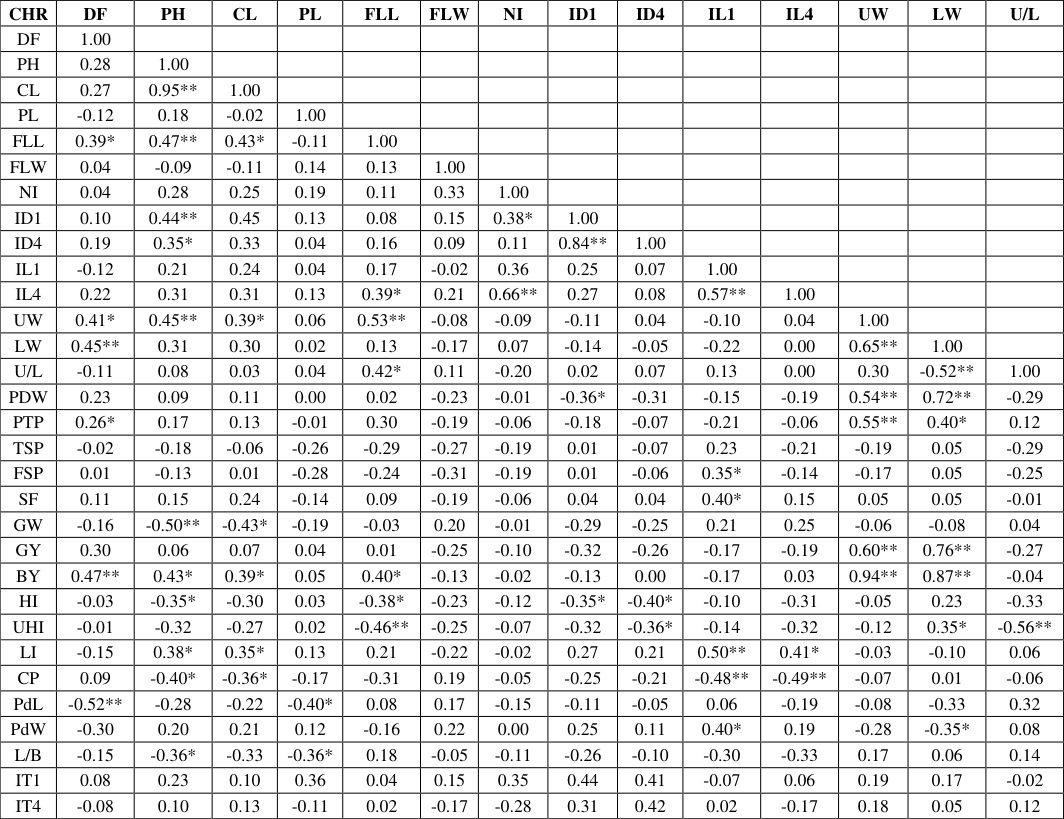 Table 2
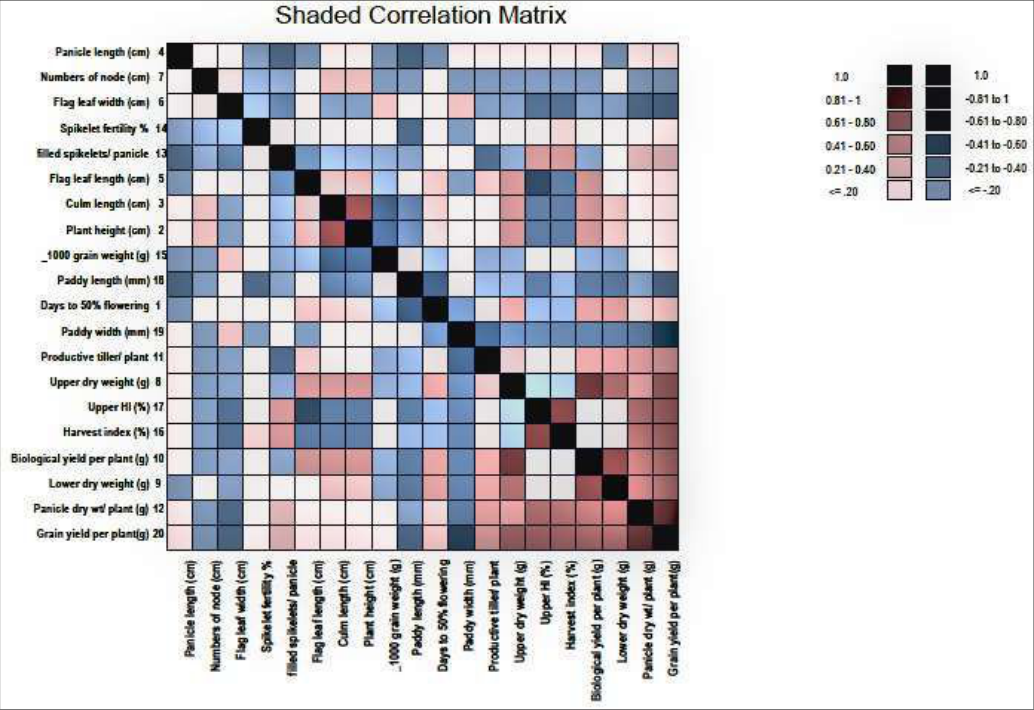 Figure 1
Introduction
Within the Poaceae family, rice is a cultivated plant that comes in two cultivated and 22 wild species under the genus Oryza. 2.5 billion people rely on rice (Oryza sativa L.) as their main diet, and it occupies 9% of the planet's arable land, making it the most extensive single land use for food production. 15% of the protein consumed globally per capita and 21% of the energy are found in rice. In Asia, rice is a major source of calories, especially for the impoverished, where it makes up 50-80% of daily caloric intake. Since rice is a staple diet for most Asians, extensive research and development efforts have been made in the areas of genetic modification and rice farming, especially in the areas of production and grain quality improvement. The creation of semi-dwarf rice cultivars, which are suited for high-density production with heavy fertilizer use, has been a new trend in rice breeding (Khush, 1999) [1] . Numerous studies have documented the excellent output of these cultivars, which are characterized by a short, strong culm, multiple tillers, and erect leaves (Tomita, 2009) [4] . However, the yield potential of inbred and hybrid rice cultivars has obviously achieved a plateau in the increase of biomass and harvest indices (Khush and Peng, 1996) [2] . A number of strategies have been put forth to surpass the rice cultivar yield ceiling. One strategy is to identify a novel plant species possessing the perfect shape, big panicles, high photosynthetic efficiency, and resistance to lodging. However, rice's lodging resistance needs to be improved in order to maintain this breeding objective. Some traits of long-culm rices are favorable to high biomass output. Interestingly, while they are taller than short culm rices, long culm rices have a lower leaf area density. High gas diffusion efficiency within stands is linked to a reduced leaf area density and offers a robust supply of CO 2 for photosynthesizing leaves (Ookawa et al., 1994) [3] . Maintaining a high canopy photosynthetic rate in long culm cultivars requires adherence to this canopy design trait. Long culm rices have the potential to increase biomass yield if the drawback of lodging in them could be solved. Considering every significant rice characteristic, we may conclude that association studies help breeders comprehend the reciprocal component traits that serve as the foundation for genetic development through selection.
Plants with many economically significant features are typically connected to one another in one or more ways. In this inquiry our main focus was correlation studies among these features as it will provide an opportunity to measure the magnitude and direction of their link together with other direct and indirect components. The degree of correlation has an impact on the selection process' efficacy as well. Breeders can better grasp the mutual component traits that underpin genetic composition selection by using correlation analysis. Plants with many economically significant characteristics are typically connected to one another in one or more ways. The degree to which the detected qualities are correlated with yield and other traits is shown by correlation. Furthermore, understanding the kind and extent of genetic variation that controls the inheritance of quantitative traits like yield and its constituents is crucial for implementing genetic improvement and selecting the best selection strategies. The association analysis is discovered to be helpful for exploitation of the main traits and the landraces in further breeding program in order to have suitable landrace profile and evaluation.
Materials and Methods
Using 32 genotypes of rice, including four checks (IR 64, Indira aerobic 1, Pusa 1121, and Dubraj selection 1), the current study, titled "Correlation studies for yield and yield attributing traits in rice (Oryza sativa L.)," was conducted in the Kharif of 2017. It was conducted at the Research cum Instructional Farm, Department of Genetics and Plant Breeding, College of Agriculture, Indira Gandhi Krishi Vishwavidyalaya, Raipur, Chhattisgarh, India. The field tests were carried out in transplanted, irrigated conditions. For sowing, a raised bed nursery was utilized. After twentyone days, seedlings in the Randomized Complete Block Design (RCBD) were planted in the field. Two replications of the experimental material were planted, with 32 genotypes in each replication. Every entry was moved onto a plot measuring 2.55 m in length and 1.20 m in width, with 20 cm separating rows, 15 cm separating plants, and 60 cm separating plots. Within replication, the check variants were randomized. For regular crop growth, typical agronomic methods were implemented. Different Observations were recorded, which were Awning, Days to 50 percent flowering, flag leaf length (cm), flag leaf width (cm), plant height (cm), culm length (cm), panicle length (cm), lodging incidence (percent), Internodes numbers, Internodes length (cm), diameter of internodes (mm), stem thickness (mm), dry weight of the plant above 40 cm (g), dry weight of the plant below 40 cm (g), upper/ lower biological yield (U/L) ratio, panicle dry weight per plant (g), number of Productive tillers per plant, number of spikelets per panicle, number of filled spikelets per panicle, spikelet fertility (percent), 1000 grain weight (g), grain yield per plant (g), biological yield per plant (g), harvest index (percent), upper Harvest Index (percent), cellulose content (percent), paddy length (mm), paddy width (mm) and paddy length/ breadth (L/ B) ratio. Correlation analysis measures the mutual relationship between various characters with the help of following formula suggested by Webber and Moorthy (1952) [5] . r xy = COV (XY)/ (Var X. Var Y) 1/2
Results and Discussion
An effective strategy in a breeding program is association analysis. It gives an overview of how the different qualities relate to one another and identifies the component characters that can be selected for in order to increase grain yield genetically. Tables 1 and2 provide the results of the current inquiry. The majority of the traits had genotypic correlation coefficients higher than phenotypic correlation coefficients, according to the results, indicating a strong genetic relationship between the traits but a considerable interaction between the environment and phenotypic value that reduces phenotypic value. Days to 50% flowering exhibited a highly significant positive correlation with both biological yield and lower biological yield (0.49), as well as a significant positive correlation with flag leaf length (0.41), upper biological yield (0.42), and grain yield per plant (0.30). Conversely, it demonstrated a highly significant negative correlation with paddy length (-0.52). Then, the plant height showed a significant positive correlation with the number of nodes per plant (0.36), the length of the fourth internode from the top (0.34), the lower biological yield (0.33), the biological yield (0.45), the culm length (0.92), the flag leaf length (0.45), the basal internode diameter (062), and the upper biological yield (0.47). However, likely culm length was found to be highly significant and positively correlated with flag leaf length (0.44), all basal internode diameter (0.62) and diameter of the fourth internode from the top (0.51) and significant positively correlated with number of nodes per plant (0.42), upper biological yield (0.41), biological yield (0.43), and lodging incidence (0.37). The trait was found to be significantly negatively correlated with 1000 grain weight (-0.52) at the genotypic and phenotypic level. Panicle length was found to have a negative and highly significant correlation with paddy length (-0.44) and L/B ratio (-0.41). It was also found to be highly significant and negatively correlated with 1000 grain weight (-0.46), and significantly negatively correlated with cellulose percentage (-0.39) and L/B ratio (-0.36). In case f flag leaf length had positive and highly significant correlation with U/L ratio (0.48) and Upper biological yield (0.55) whereas, it had negative and highly significant correlation with upper harvest index (-0.48), likely Flag leaf width had positive and significant correlation with number of nodes per plant (0.37) whereas, it had negative and significant correlation with total spikelets per panicle (-0.38) and filled spikelets per panicle (-0.39). 0.03 0.10 -0.21 -0.20 -0.03 -0.21 0.09 0.20 -0.05 -0.03 -0.07 0.04 -0.21 -0.18 0.02 1.00 IT4 -0.06 0.01 0.14 0.13 0.02 -0.06 0.00 0.14 -0.16 -0.16 0.28 -0.26 0.13 0.17 -0.03 0.27 1.00 Significance at 5% level is denoted by * and significance at 1% level is denoted by ** DF= days to 50% flowering, PH= plant height, CL culm length, PL= panicle length, FLL= flag leaf length, FLW= flag leaf width, NI= number of internodes, ID1= basal internode diameter, ID4= diameter of 4 th internode from the top, IL1= basal internode length, IL4= length of 4 th internode from the top, UW= dry weight of plant above 40 cm, LW= dry weight of plant below 40 cm, U/W= upper/ lower dry weight, PDW= panicle dry weight/ plant, PTP= productive tillers/ plant, TSP= total spikeletes/ panicle, FSP= filled spikeletes/ panicle, SF= spikelet fertility%, GW= 1000 grain weight, GY= grain yield/ plant, BY= biological yield/ plant, HI= harvest index %, UHI= upper harvest undex %, LI= lodging incidence, CP= cellulose percent, PdL= paddy length, PdW= paddy width, L/B= length/breadth ratio, IT1= basal internode thickness, IT4= thickness oh 4 th internode from the top Lower biological yield had positive and highly significant correlations with panicle dry weight per plant (0.82), productive tiller per plant (0.48), grain yield per plant (0.80), and biological yield (0.87); it had significant positive correlations with lodging incidence (0.38), but it had negative and highly significant correlations with U/L ratio (-0.47). Upper biological yield had positive and highly significant correlations with Lower biological yield (0.67), panicle dry weight per plant (0.57), productive tiller per plant (0.70), and biological yield (0.95) and significant positive correlation with U/L ratio (0.34). The dry weight ratio (U/L) exhibited a significantly significant negative connection with both the upper harvest index (-0.62) and the harvest index (-0.44). In contrast, panicle dry weight per plant showed a positive and highly significant correlation with productive tiller per plant (0.55) grain yield per plant (0.99), biological yield (0.73), harvest index (0.74), and upper harvest index (0.73). It also showed a negative and significant correlation with filled spikelets per panicle (-0.37), total spikelets per panicle (-0.40), and grain yield per plant (-0.31). Conversely, it exhibited a substantial and negative correlation with paddy width (-0.39). Subsequently, the number of productive tillers per plant showed a highly significant and positive link with both biological yield (0.67) and grain output per plant (0.57). whereas, it had negative and highly significant correlation with paddy width (-0.53) and total spikelets per panicle had positive and highly significant correlation with filled spikelets per panicle (0.96), Harvest Index (0.53) and upper Harvest Index (0.57), number of filled spikelets per panicle had positive and highly significant correlation with spikelet fertility percentage (0.53), harvest index (0.56) and upper harvest index (0.58), grain weight had positive and significant correlation with paddy length (0.39). There was a positive and statistically significant association between the grain yield per plant and the biological yield (0.74), harvest index (0.74), and higher harvest index (0.72). Conversely, there was a substantial and negative association (-0.43) between it and paddy width. Similarly, there was a substantial negative connection (-0.37) between biological yield per plant and paddy width. The cellulose content (0.48) and higher harvest index (0.97) showed a positive and highly significant connection with harvest index percentage. On the other hand, the Upper Harvest Index percent had a positive and very significant link with cellulose percent (0.44), whereas it had a negative and significant correlation with lodging incidence (-0.41). On the other hand, it significantly and negatively correlated with the incidence of lodging (-0.39) In a similar vein, paddy width and length showed significantly significant negative and positive correlations with the L/B ratio (-0.67) and 0.59, respectively. The number of internodes per plant exhibited a positive and highly significant correlation with the diameter of the first internode (0.57) and the fourth internode length from the top (0.65). The length of the basal internode (0.34) also showed a positive and highly significant correlation. Subsequently, the basal internode diameter had a positive and highly significant correlation with the diameter of the fourth internode from the top (0.90) and the length of the basal internode (0.46) and for lodging incidence, it was (0.34). Conversely, there was a negative and significant correlation with the panicle dry weight per plant (-0.37), the cellulose percent (-0.33), the grain yield per plant (-0.39), the upper harvest index (-0.39), and a highly significant and negatively correlated with the harvest index (-0.48 Similar to how the basal internode length had a positive and highly significant correlation with the length of the fourth internode from the top (0.63), the diameter of the internode from the top had a positive and significant correlation with lodging incidence (0.34) as well as a negative and highly significant correlation with the harvest index (-0.53) and upper harvest index (-0.48). Additionally positively associated were lodging occurrence (0.56), spikelet fertility (0.46), and paddy width (0.44). The length of the fourth internode from the top showed a positive and significant correlation with lodging incidence (0.43), while the cellulose content showed a negative and significant correlation with lodging incidence (-0.95) and a negative and significant correlation with paddy width (-0.36). It also had a negative and highly significant correlation with cellulose percentage (-0.52). Regarding transformed lodging percentage, the characteristic exhibited a strong positive association with paddy width (0.51), but a strong negative correlation with cellulose percentage (-0.95) and a substantial negative correlation with the L/B ratio (-0.41). Similar to the basal internode thickness, this feature exhibited a negative and statistically significant link with 1000 grain weight (-0.41) but a positive and highly significant correlation with panicle length (0.54), basal internode diameter (0.88), and fourth internode diameter (0.79). Last but not least, there was a strong positive association between the phenotypic thickness of the fourth internode from the top and its diameter (0.66) as well as a substantial positive correlation between it and the basal internode length (0.38) and U/L ratio (0.35). Its connection with harvest index (0.38) and flag leaf width (0.46) was statistically significant but negative.
Conclusion
Thus, it can be inferred that the current study examined yield and lodging parameters, and the results indicated a substantial link between yield and lodging of several critical characteristics. There was a substantial and positive association between harvest index and grain yield per plant. The harvest index and the number of days to 50% blooming showed a positive and substantial link with grain production per plant, which is consistent with the findings of Dhurai et al. (2016) [6] . Plant height, culm length, basal and fourth internode length from the top, and lodging incidence all exhibited positive and highly significant correlations; cellulose percentage showed a negative and extremely significant link. Thus, the use of correlation analysis in this study has made it thorough and given rice breeders the foundation they need to utilize landraces that have one or more favorable traits.
Figures and tables from the paper
| CHR | DF | PH | CL | PL | FLL | FLW | NI | ID1 | ID4 | IL1 | IL4 | UW | LW | U/L |
|---|---|---|---|---|---|---|---|---|---|---|---|---|---|---|
| DF | 1.00 | |||||||||||||
| PH | 0.30 | 1.00 | ||||||||||||
| CL | 0.29 | 0.92** | 1.00 | |||||||||||
| PL | -0.15 | 0.16 | 0.05 | 1.00 | ||||||||||
| FLL | 0.41* | 0.45** | 0.44** | -0.18 | 1.00 | |||||||||
| FLW | 0.06 | -0.13 | -0.13 | 0.22 | 0.17 | 1.00 | ||||||||
| NI | 0.05 | 0.36* | 0.42* | 0.13 | 0.19 | 0.37* | 1.00 | |||||||
| ID1 | 0.13 | 0.62** | 0.62** | 0.19 | 0.14 | 0.13 | 0.57** | 1.00 | ||||||
| ID4 | 0.28 | 0.48** | 0.51* | 0.00 | 0.22 | 0.04 | 0.13 | 0.90** | 1.00 | |||||
| IL1 | -0.12 | 0.21 | 0.25 | 0.03 | 0.17 | 0.00 | 0.34* | 0.46** | 0.20 | 1.00 | ||||
| IL4 | 0.25 | 0.34* | 0.35* | 0.18 | 0.42* | 0.28 | 0.65** | 0.32 | 0.08 | 0.63** | 1.00 | |||
| UW | 0.42* | 0.47** | 0.41* | 0.09 | 0.55** | -0.06 | -0.07 | -0.13 | 0.05 | -0.13 | 0.01 | 1.00 | ||
| LW | 0.49** | 0.33 | 0.37 | -0.02 | 0.14 | -0.26 | 0.11 | -0.10 | -0.06 | -0.25 | 0.01 | 0.67** | 1.00 | |
| U/L | -0.13 | 0.09 | -0.02 | 0.13 | 0.48** | 0.24 | -0.26 | -0.08 | 0.09 | 0.14 | -0.02 | 0.34* | -0.47** | 1.00 |
| PWP | 0.24 | 0.11 | 0.13 | 0.00 | 0.02 | -0.25 | 0.01 | -0.37* | -0.39 | -0.19 | -0.17 | 0.57** | 0.82** | -0.35* |
| PTP | 0.34* | 0.25 | 0.19 | 0.04 | 0.45* | -0.21 | -0.09 | -0.06 | -0.06 | -0.30 | 0.00 | 0.70** | 0.48** | 0.22 |
| TSP | -0.05 | -0.18 | -0.06 | -0.25 | -0.36 | -0.38* | -0.12 | 0.01 | -0.02 | 0.31 | -0.29 | -0.27 | 0.07 | -0.40* |
| FSP | 0.00 | -0.12 | 0.00 | -0.26 | -0.28 | -0.39* | -0.09 | 0.07 | 0.00 | 0.41* | -0.22 | -0.23 | 0.08 | -0.37 |
| SF | 0.15 | 0.17 | 0.23 | -0.15 | 0.09 | -0.20 | 0.07 | 0.22 | 0.08 | 0.46** | 0.13 | 0.03 | 0.09 | -0.09 |
| GW | -0.18 | -0.52** | -0.46** | -0.21 | -0.02 | 0.27 | -0.06 | -0.38* | -0.38 | 0.24 | 0.28 | -0.07 | -0.11 | 0.07 |
| GY | 0.30 | 0.06 | 0.06 | 0.05 | 0.01 | -0.28 | -0.08 | -0.39* | -0.36 | -0.18 | -0.19 | 0.59** | 0.80** | -0.31 |
| BY | 0.49** | 0.45** | 0.43* | 0.05 | 0.42* | -0.15 | 0.00 | -0.13 | 0.00 | -0.19 | 0.01 | 0.95** | 0.87** | 0.02 |
| HI | -0.05 | -0.38* | -0.37 | 0.04 | -0.40* | -0.23 | -0.14 | -0.48* | -0.53** | -0.10 | -0.31 | -0.06 | 0.30 | -0.44** |
| UHI | -0.02 | -0.34 | -0.30 | 0.00 | -0.48** | -0.30 | -0.08 | -0.39* | -0.48** | -0.14 | -0.31 | -0.12 | 0.38* | -0.62** |
| LI | -0.16 | 0.40* | 0.37* | 0.18 | 0.22 | -0.30 | -0.05 | 0.34* | 0.28 | 0.56** | 0.43** | -0.04 | -0.12 | 0.06 |
| CP | 0.10 | -0.42 | -0.39* | -0.23 | -0.34 | 0.26 | -0.03 | -0.33 | -0.30 | -0.54** | -0.52** | -0.07 | 0.03 | -0.08 |
| PdL | -0.52** | -0.28 | -0.23 | -0.44** | 0.09 | 0.17 | -0.19 | -0.16 | -0.07 | 0.08 | -0.21 | -0.08 | -0.36* | 0.36 |
| PdW | -0.32 | 0.22 | 0.23 | 0.15 | -0.16 | 0.25 | -0.01 | 0.29 | 0.15 | 0.44** | 0.18 | -0.31 | -0.39* | 0.10 |
| L/B | -0.15 | -0.39 | -0.36* | -0.41* | 0.19 | -0.06 | -0.13 | -0.31 | -0.13 | -0.32 | -0.34* | 0.19 | 0.06 | 0.17 |
| IT1 | 0.19 | 0.39* | 0.35* | 0.54** | 0.00 | 0.19 | 0.52* | 0.88** | 0.79** | 0.24 | 0.08 | 0.44** | 0.28 | 0.14 |
| IT4 | -0.23 | 0.22 | 0.21 | -0.22 | 0.01 | -0.46* | 0.02 | 0.37 | 0.66** | 0.38* | -0.35 | 0.32 | -0.01 | 0.35* |
Table text extracted from the original PDF; superscript letters are shown inline. The original table image is below.
View original table image
| CHR | DF | PH | CL | PL | FLL | FLW | NI | ID1 | ID4 | IL1 | IL4 | UW | LW | U/L |
|---|---|---|---|---|---|---|---|---|---|---|---|---|---|---|
| DF | 1.00 | |||||||||||||
| PH | 0.28 | 1.00 | ||||||||||||
| CL | 0.27 | 0.95** | 1.00 | |||||||||||
| PL | -0.12 | 0.18 | -0.02 | 1.00 | ||||||||||
| FLL | 0.39* | 0.47** | 0.43* | -0.11 | 1.00 | |||||||||
| FLW | 0.04 | -0.09 | -0.11 | 0.14 | 0.13 | 1.00 | ||||||||
| NI | 0.04 | 0.28 | 0.25 | 0.19 | 0.11 | 0.33 | 1.00 | |||||||
| ID1 | 0.10 | 0.44** | 0.45 | 0.13 | 0.08 | 0.15 | 0.38* | 1.00 | ||||||
| ID4 | 0.19 | 0.35* | 0.33 | 0.04 | 0.16 | 0.09 | 0.11 | 0.84** | 1.00 | |||||
| IL1 | -0.12 | 0.21 | 0.24 | 0.04 | 0.17 | -0.02 | 0.36 | 0.25 | 0.07 | 1.00 | ||||
| IL4 | 0.22 | 0.31 | 0.31 | 0.13 | 0.39* | 0.21 | 0.66** | 0.27 | 0.08 | 0.57** | 1.00 | |||
| UW | 0.41* | 0.45** | 0.39* | 0.06 | 0.53** | -0.08 | -0.09 | -0.11 | 0.04 | -0.10 | 0.04 | 1.00 | ||
| LW | 0.45** | 0.31 | 0.30 | 0.02 | 0.13 | -0.17 | 0.07 | -0.14 | -0.05 | -0.22 | 0.00 | 0.65** | 1.00 | |
| U/L | -0.11 | 0.08 | 0.03 | 0.04 | 0.42* | 0.11 | -0.20 | 0.02 | 0.07 | 0.13 | 0.00 | 0.30 | -0.52** | 1.00 |
| PDW | 0.23 | 0.09 | 0.11 | 0.00 | 0.02 | -0.23 | -0.01 | -0.36* | -0.31 | -0.15 | -0.19 | 0.54** | 0.72** | -0.29 |
| PTP | 0.26* | 0.17 | 0.13 | -0.01 | 0.30 | -0.19 | -0.06 | -0.18 | -0.07 | -0.21 | -0.06 | 0.55** | 0.40* | 0.12 |
| TSP | -0.02 | -0.18 | -0.06 | -0.26 | -0.29 | -0.27 | -0.19 | 0.01 | -0.07 | 0.23 | -0.21 | -0.19 | 0.05 | -0.29 |
| FSP | 0.01 | -0.13 | 0.01 | -0.28 | -0.24 | -0.31 | -0.19 | 0.01 | -0.06 | 0.35* | -0.14 | -0.17 | 0.05 | -0.25 |
| SF | 0.11 | 0.15 | 0.24 | -0.14 | 0.09 | -0.19 | -0.06 | 0.04 | 0.04 | 0.40* | 0.15 | 0.05 | 0.05 | -0.01 |
| GW | -0.16 | -0.50** | -0.43* | -0.19 | -0.03 | 0.20 | -0.01 | -0.29 | -0.25 | 0.21 | 0.25 | -0.06 | -0.08 | 0.04 |
| GY | 0.30 | 0.06 | 0.07 | 0.04 | 0.01 | -0.25 | -0.10 | -0.32 | -0.26 | -0.17 | -0.19 | 0.60** | 0.76** | -0.27 |
| BY | 0.47** | 0.43* | 0.39* | 0.05 | 0.40* | -0.13 | -0.02 | -0.13 | 0.00 | -0.17 | 0.03 | 0.94** | 0.87** | -0.04 |
| HI | -0.03 | -0.35* | -0.30 | 0.03 | -0.38* | -0.23 | -0.12 | -0.35* | -0.40* | -0.10 | -0.31 | -0.05 | 0.23 | -0.33 |
| UHI | -0.01 | -0.32 | -0.27 | 0.02 | -0.46** | -0.25 | -0.07 | -0.32 | -0.36* | -0.14 | -0.32 | -0.12 | 0.35* | -0.56** |
| LI | -0.15 | 0.38* | 0.35* | 0.13 | 0.21 | -0.22 | -0.02 | 0.27 | 0.21 | 0.50** | 0.41* | -0.03 | -0.10 | 0.06 |
| CP | 0.09 | -0.40* | -0.36* | -0.17 | -0.31 | 0.19 | -0.05 | -0.25 | -0.21 | -0.48** | -0.49** | -0.07 | 0.01 | -0.06 |
| PdL | -0.52** | -0.28 | -0.22 | -0.40* | 0.08 | 0.17 | -0.15 | -0.11 | -0.05 | 0.06 | -0.19 | -0.08 | -0.33 | 0.32 |
| PdW | -0.30 | 0.20 | 0.21 | 0.12 | -0.16 | 0.22 | 0.00 | 0.25 | 0.11 | 0.40* | 0.19 | -0.28 | -0.35* | 0.08 |
| L/B | -0.15 | -0.36* | -0.33 | -0.36* | 0.18 | -0.05 | -0.11 | -0.26 | -0.10 | -0.30 | -0.33 | 0.17 | 0.06 | 0.14 |
| IT1 | 0.08 | 0.23 | 0.10 | 0.36 | 0.04 | 0.15 | 0.35 | 0.44 | 0.41 | -0.07 | 0.06 | 0.19 | 0.17 | -0.02 |
| IT4 | -0.08 | 0.10 | 0.13 | -0.11 | 0.02 | -0.17 | -0.28 | 0.31 | 0.42 | 0.02 | -0.17 | 0.18 | 0.05 | 0.12 |
Table text extracted from the original PDF; superscript letters are shown inline. The original table image is below.
View original table image
References
5 in the original paper- Khush GS. Green revolution: preparing for the 21st century. Genome. 1999;42(4):646-655.
- Ookawa T, Ishihara K. Analysis of the dry matter production process and yield formation of the highyielding rice cultivar Takanari, from 1991 to 1994. Japanese Journal of Crop Science. 1994;66(1):42-50.
- Tomita M. Introgression of Green Revolution sd1 gene into isogenic genome of rice super cultivar Koshihikari to create novel semidwarf cultivar 'Hikarishinseiki' (Koshihikari-sd1). Field crops research. 2009;114(2):173-181.
- Webber CR, Moorthy BR. Heritable and nonheritable relationship and variability of content and agronomic characters in the segregation of Soybean cross. Agron J. 1952;4:202-209.
- Dhurai K, Karpagam A. Fuzzy optimal solution for fully fuzzy linear programming problems using Hexagonal fuzzy numbers. International Journal of Fuzzy Mathematical Archive. 2016;10(2):117-123.