
Research article · 2024 · Full text
International Journal of Agriculture Extension and Social DevelopmentCorrelation between the profile of agricultural postgraduate students and the level of soft skills
Volume 7(2) · Pages 493–497 · DOI: 10.33545/26180723.2024.v7.i2g.370 ↗
Research areasInnovative Teaching MethodsEducational Innovations and ChallengesEducation and Critical Thinking Development
Abstract
Author-writtenSoft skills are interpersonal skills which are used to describe the approach to life, work and relationship with other people. Soft skills are often called a blend of good behavior, positive attitude, strong communication skills, interpersonal abilities and willingness to get along with others and affect them. The study was conducted in College of Agriculture, Parbhani, College of Agriculture, Latur, and College of Agriculture, Badnapur, VNMKV, Parbhani in Maharashtra state with a view to know the level of soft skills among agricultural post graduate students. The data was collected from the Post graduates of three constituent colleges. By using proportionate random sampling method 129 respondents were selected for the study. The majority of Post graduates were female from rural family background, first class academic performance, with college level father’s education, secondary level of mother’s education, Marathi as medium of instruction at school level, with more than 3 hours in a day exposure to internet, everyday exposure to computer and library, followed by medium annual family income and achievement motivation with high job preference for government jobs. The study revealed that, academic performance, father’s education, mother’s education internet exposure, computer exposure and library exposure and achievement motivation showed significant relationship with level of soft skills. Whereas, gender, family background, annual family income, medium of instruction and job preference showed non-significant relationship with level of soft skills.
Summary
Source-checkedPlain-language reading of the full paper, prepared with AI and checked against the text. Each point links to the authors' own words.
Why it matters
- Technical expertise is no longer enough for agricultural postgraduate students to succeed in their professional careers. View evidence ↗
- Soft skills, which include interpersonal abilities and personal attributes, are now essential for the success of these students. View evidence ↗
- There is a lack of comprehensive understanding and tailored strategies to help postgraduate students develop necessary soft skills. View evidence ↗
What they did
- The research was carried out across three colleges affiliated with Vasantrao Naik Marathwada Krishi Vidyapeeth: Parbhani, Latur, and Badnapur. View evidence ↗
- A sample of 129 postgraduate students was selected using a 50 percent proportionate random sampling technique. View evidence ↗
- Data analysis was performed using frequency, percentage, mean, standard deviation, and correlation coefficients. View evidence ↗
What they found
- The majority of the respondents were female (57.36%), while 42.63% were male. View evidence ↗
- Most of the postgraduate students (73.65%) came from rural backgrounds. View evidence ↗
What it means
- The authors conclude that academic performance, parental education, achievement motivation, and exposure to digital and library resources are crucial influences on the development of soft skills in postgraduate students. View evidence ↗
Visual summary
2 visualsIllustrations explain the paper; charts are replotted from the paper's own table values.
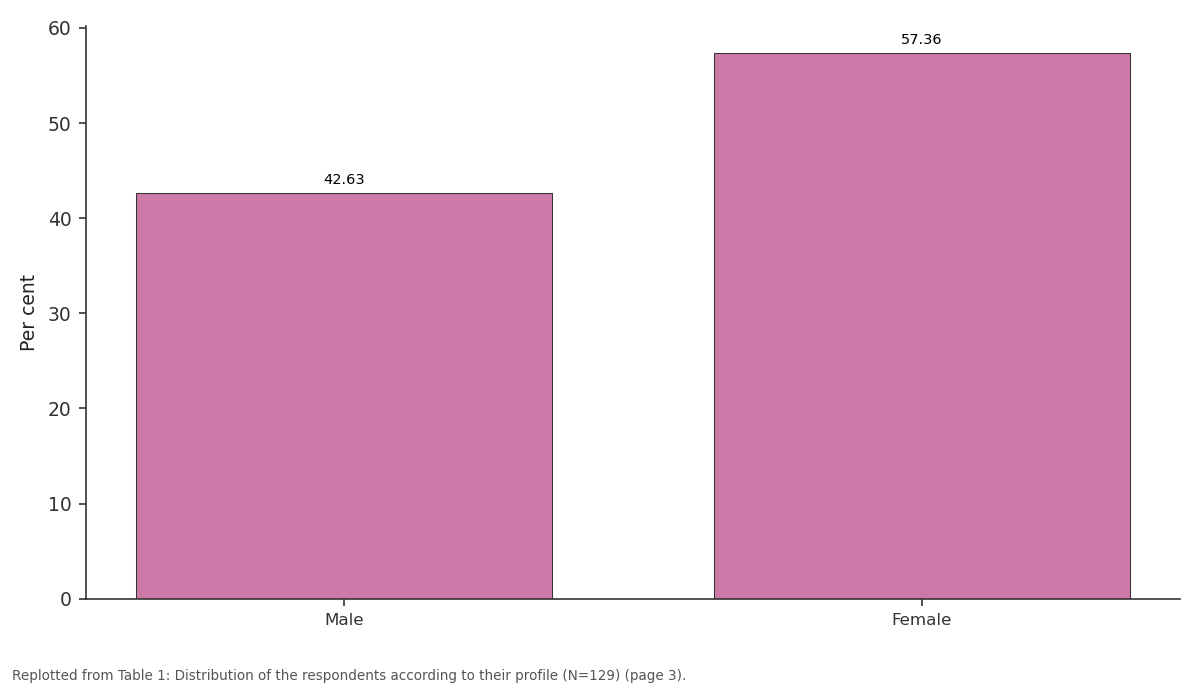
Per cent: Male vs Female
Replotted from Table 1 (page 3) of the original paper. Every bar is the paper's own table value.
View source evidence ↗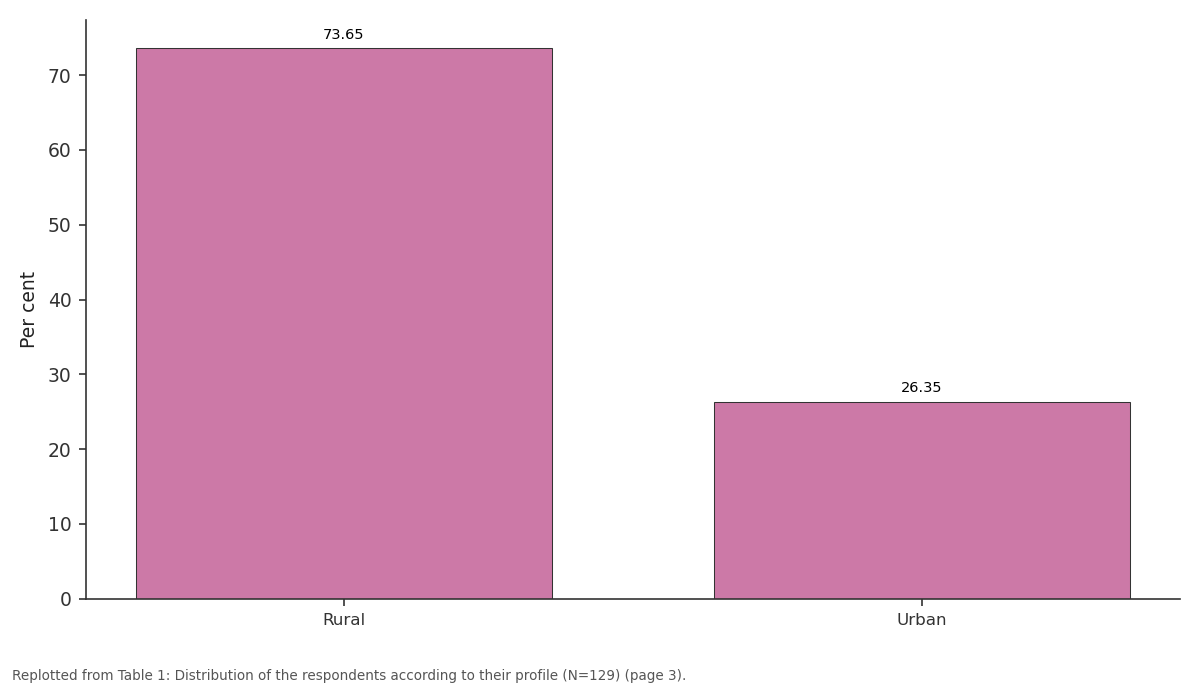
Per cent: Rural vs Urban
Replotted from Table 1 (page 3) of the original paper. Every bar is the paper's own table value.
View source evidence ↗Figures & tables
From the original paper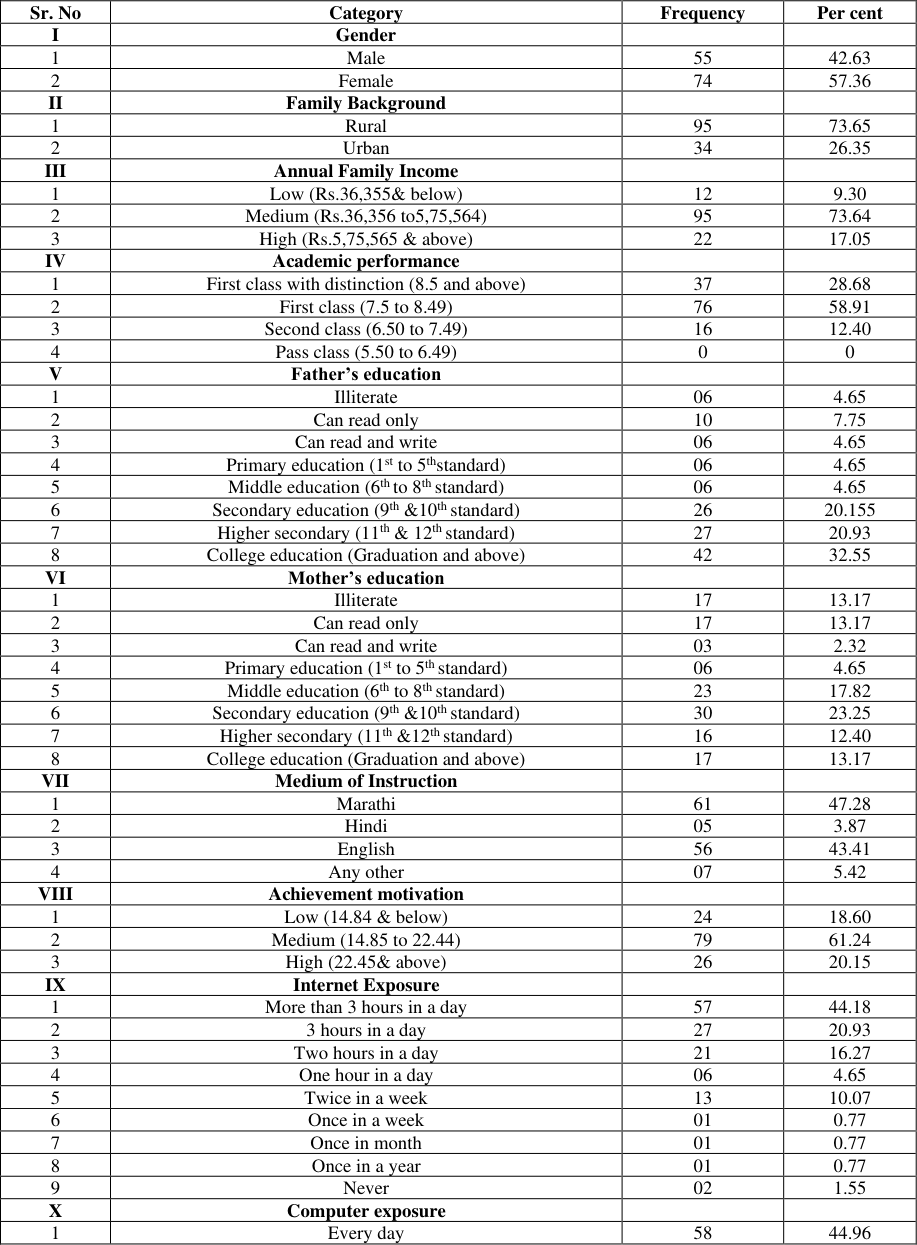 Table 1
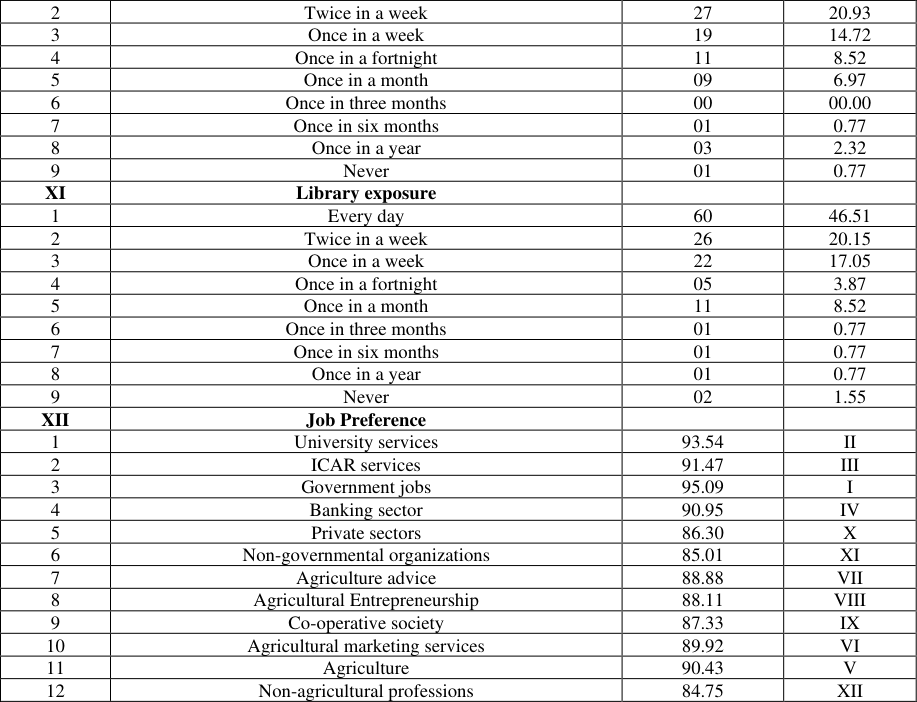 Table 2
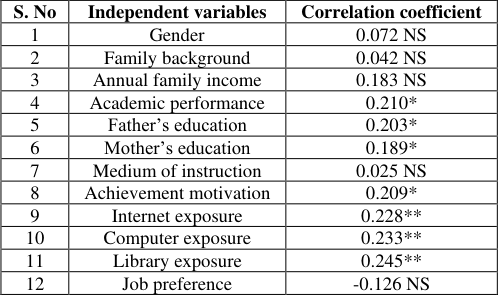 Table 2
Introduction
In the ever-evolving landscape of agriculture, technical proficiency alone is no longer sufficient for postgraduate students to excel in their careers. While their academic pursuits equip them with essential knowledge and expertise in agricultural practices, the importance of soft skills cannot be overlooked. Soft skills, encompassing a wide array of personal attributes and interpersonal abilities, have become integral to the success of agricultural postgraduate students. For agricultural institutions, which are primarily discipline and technology-focused, developing soft skills is seen as a significant barrier. Particularly talented and empowered faculties have been considered crucial requirements to satisfy future demands. Educational institutions must go significantly beyond the basic knowledge of agricultural education to include learning theory, communication in cognitive psychology and behavioral science, complex group meetings, organizational and administrative sciences. The components of personal development are more significant than cognitive skills. They must first be conceptually grasped before being functionally mastered. It is predicted that teachers and readers would benefit from the curriculum's integration of professional development elements with novel concepts and skills. This integration does not always necessitate creating new soft skills courses or changing existing discipline courses to ones that focus on soft skills. The research gap in achieving soft skills among postgraduate students lies in a lack of comprehensive understanding and effective strategies tailored to their specific needs. Existing studies may be limited in addressing the unique challenges faced by postgraduate students in developing soft skills essential for professional success. Additionally, there may be a scarcity of research focusing on the most impactful interventions and practical approaches to enhance soft skills specifically within the postgraduate academic context. Minimizing this gap could lead to improved educational outcomes and better-prepared postgraduate students for the demands of the workforce. In the light of this, the current study "Level of soft skills www.extensionjournal.com among Agricultural post graduate students" was conducted with the following objectives; 1. To study the profile of the respondents. 2. To ascertain the relationship between profile of the respondents and level of soft skills among respondents.
Materials and Methods
This study was conducted in three colleges affiliated with Vasantrao Naik Marathwada Krishi Vidyapeeth (VNMKV), namely the College of Agriculture, Parbhani, the College of Agriculture, Latur, and the College of Agriculture, Badnapur. These colleges were selected because only these three colleges have post graduate degree programme in agriculture disciplines under VNMKV, Parbhani. Total 129 postgraduate students were selected by using the 50 per cent proportionate random sampling technique. The ex-post facto research design was used for the study. The questionnaire was developed on the basis of objectives for collection of data from the selected post graduate students of respective colleges. Suitable statistical tools such as frequency, percentage, mean, standard deviation, and coefficient of correlation were used for data analysis.
Results and Discussion
Results and Discussion
Profile of the respondents
The data regarding profile of the respondents are presented in Table 1. It is revealed that 57.36 per cent of the respondents were female and the remaining 42.63 per cent were male students. It is noticed that the majority of the PG students (73.65%) hailed from rural areas. In case of family annual income of the respondents, it is observed that majority of the respondents (73.64%) reported a mediumlevel family annual income, falling between Rs. 36,356 and Rs. 5,75,564/-. In contrast, 17.05% reported a high annual family income of Rs. 5,75,565/-and above, while 9.30% indicated a low family annual income of Rs. 36,355/-and below.
| Sr. No | Category | Frequency | Per cent |
|---|---|---|---|
| I | Gender | ||
| 1 | Male | 55 | 42.63 |
| 2 | Female | 74 | 57.36 |
| II | Family Background | ||
| 1 | Rural | 95 | 73.65 |
| 2 | Urban | 34 | 26.35 |
| III | Annual Family Income | ||
| 1 | Low (Rs.36,355& below) | 12 | 9.30 |
| 2 | Medium (Rs.36,356 to5,75,564) | 95 | 73.64 |
| 3 | High (Rs.5,75,565 & above) | 22 | 17.05 |
| IV | Academic performance | ||
| 1 | First class with distinction (8.5 and above) | 37 | 28.68 |
| 2 | First class (7.5 to 8.49) | 76 | 58.91 |
| 3 | Second class (6.50 to 7.49) | 16 | 12.40 |
| 4 | Pass class (5.50 to 6.49) | 0 | 0 |
| V | Father’s education | ||
| 1 | Illiterate | 06 | 4.65 |
| 2 | Can read only | 10 | 7.75 |
| 3 | Can read and write | 06 | 4.65 |
| 4 | Primary education (1st to 5thstandard) | 06 | 4.65 |
| 5 | Middle education (6th to 8th standard) | 06 | 4.65 |
| 6 | Secondary education (9th &10th standard) | 26 | 20.155 |
| 7 | Higher secondary (11th & 12th standard) | 27 | 20.93 |
| 8 | College education (Graduation and above) | 42 | 32.55 |
| VI | Mother’s education | ||
| 1 | Illiterate | 17 | 13.17 |
| 2 | Can read only | 17 | 13.17 |
| 3 | Can read and write | 03 | 2.32 |
| 4 | Primary education (1st to 5th standard) | 06 | 4.65 |
| 5 | Middle education (6th to 8th standard) | 23 | 17.82 |
| 6 | Secondary education (9th &10th standard) | 30 | 23.25 |
| 7 | Higher secondary (11th &12th standard) | 16 | 12.40 |
| 8 | College education (Graduation and above) | 17 | 13.17 |
| VII | Medium of Instruction | ||
| 1 | Marathi | 61 | 47.28 |
| 2 | Hindi | 05 | 3.87 |
| 3 | English | 56 | 43.41 |
| 4 | Any other | 07 | 5.42 |
| VIII | Achievement motivation | ||
| 1 | Low (14.84 & below) | 24 | 18.60 |
| 2 | Medium (14.85 to 22.44) | 79 | 61.24 |
| 3 | High (22.45& above) | 26 | 20.15 |
| IX | Internet Exposure | ||
| 1 | More than 3 hours in a day | 57 | 44.18 |
| 2 | 3 hours in a day | 27 | 20.93 |
| 3 | Two hours in a day | 21 | 16.27 |
| 4 | One hour in a day | 06 | 4.65 |
| 5 | Twice in a week | 13 | 10.07 |
| 6 | Once in a week | 01 | 0.77 |
| 7 | Once in month | 01 | 0.77 |
| 8 | Once in a year | 01 | 0.77 |
| 9 | Never | 02 | 1.55 |
| X | Computer exposure | ||
| 1 | Every day | 58 | 44.96 |
Table text extracted from the original PDF; superscript letters are shown inline. The original table image is below.
View original table image
Regarding academic performance of the respondents, the majority of PG students (58.91%), achieved an OGPA between 7.5 to 8.49, which corresponds to the "First class" category. Whereas, 28.68 per cent of the respondents achieved an OGPA of more than 8.5 and above, which falls under the "First class with distinction" category and 12.40 per cent of PG students had an OGPA between 6.50 to 7.49, which falls under the "second class" category. No students were reported to have an OGPA between 5.50 to 6.49, which typically falls under the "Pass class" category.
In case of father's education of the respondents, the data presented in Table 1 reported that 32.55 per cent of the respondent's father had education up to the college level (Graduation and above), followed by 20.93 per cent of them reported that their fathers had education up to the higher secondary level (11 th &12 th standard), 20.15 per cent of the respondents' fathers had education up to the secondary level (9 th &10 th standard). Regarding mother's education of the respondents, the highest percentage of respondents, (23.25%) reported that respondent's mothers were educated up to the secondary education (9 th & 10 th standard), followed by 17.82 per cent, of respondent's mother had educated up to the middle level (6th to 8th standard), 13.17 per cent of the respondents' mothers had higher education up to the college level (Graduation and above). Data presented in Table 1 regarding medium of instruction of the respondents indicated that, 47.28 per cent of respondents completed their school education with Marathi as the medium of instruction. On the other hand, 43.41 per cent of respondents completed their school education with English as the medium of instruction, and 5.42 per cent, completed their school education with other languages like Telugu, Kannada, Tamil, etc. These languages are typically regional languages spoken in specific states or regions of India. A smaller percentage of students, 3.87 per cent of respondents completed their school education with Hindi as the medium of instruction. It indicates that significant proportion of respondents have Marathi as their medium of instruction at school level. It might be because most of the respondents are from rural background of Maharashtra state and Marathi is likely to be their native or regional language.
In case of achievement motivation of the respondents, it is reported that majority of respondents, (61.24%), fell into the "medium" category of achievement motivation. Whereas, 20.15 per cent of the respondents demonstrated a "high" level of achievement motivation and 18.60 per cent of the them belonged to the "low" category of achievement motivation. Regarding internet exposure, the result indicated that the highest percentage of respondents, (44.18%) used the internet for more than 3 hours in a day, followed by 20.93 per cent of students utilized the internet for 3 hours in a day, 16.27 per cent used it Two hours in a day, 10.07 per cent used it Twice in a week, 4.65 per cent used it one hour in a day. Only1.55 per cent, stated that they never utilized the internet, and 0.77 per cent of them used internet once in a week, once in a month and once in a year. The data regarding computer exposure of the respondents indicated that the highest percentage of respondents, comprising 44.96 per cent, used the computer every day for their academic and research-related activities. Whereas, 20.93 per cent of students utilized the computer twice a week, followed by 14.72 per cent used it once a week, 8.52 per cent used it once in a fortnight, 6.97 per cent used it once a month, 2.36 per cent used it once a year, 0.77per cent used the computer once in six months. Only 0.77per cent of the respondents stated that they never utilized the computer. No respondents reported using the computer once in three months. In case of library exposure, the data reported that, the majority of respondents, (46.51%), utilized the library every day for their academic and research-related activities. Followed by, 20.15 per cent of students used the library twice a week, 17.05 per cent used it once a week, 8.52 per cent used it once a month, 3.87 per cent used it once in a fortnight. Whereas, 1.55 per cent, reported that they never utilized the library. While, each at 0.7 per cent of them used the library once in three months, once in six months and once in a year, respectively. Data regarding job preference of the respondent also presented in Table 1, it is observed that the majority of respondents expressed their job preferences in the following order; State Agricultural Department services ranked first with an extent of 95.09 MPS, followed by university services in second place with 93.54 MPS, ICAR services in third place with 91.47 MPS, Banking sectors in fourth place with 90.15 MPS, and Farming in fifth place with 90.43 MPS. www.extensionjournal.com Relationship between profile of the respondents with their level of soft skills: Table 2 outlines the association between the respondents' profile and their level of soft skills. The results highlight a highly significant relationship between internet exposure, library exposure, and computer exposure of the respondents with level of soft skills of the respondent. Additionally, there is a significant relationship between academic performance, fathers' education, mothers' education, and achievement motivation of the respondents with their soft skills. However, no significant relationships were found between gender, family background, annual family income, medium of instruction, and job preference of the respondents with their level of soft skills. These findings are in close association with Ajit ( 2004) [1] , Choudhary (2010) [2] , Dahake (2009) [3] , Fazal (2020) [4] , Mishra (2016) [5] , Tanwar (2018) [6] and Thakur (2014) [7] .
| S. No | Independent variables | Correlation coefficient |
|---|---|---|
| 1 | Gender | 0.072 NS |
| 2 | Family background | 0.042 NS |
| 3 | Annual family income | 0.183 NS |
| 4 | Academic performance | 0.210* |
| 5 | Father’s education | 0.203* |
| 6 | Mother’s education | 0.189* |
| 7 | Medium of instruction | 0.025 NS |
| 8 | Achievement motivation | 0.209* |
| 9 | Internet exposure | 0.228** |
| 10 | Computer exposure | 0.233** |
| 11 | Library exposure | 0.245** |
| 12 | Job preference | -0.126 NS |
Table text extracted from the original PDF; superscript letters are shown inline. The original table image is below.
View original table image
| 2 | Twice in a week | 27 | 20.93 |
|---|---|---|---|
| 3 | Once in a week | 19 | 14.72 |
| 4 | Once in a fortnight | 11 | 8.52 |
| 5 | Once in a month | 09 | 6.97 |
| 6 | Once in three months | 00 | 00.00 |
| 7 | Once in six months | 01 | 0.77 |
| 8 | Once in a year | 03 | 2.32 |
| 9 | Never | 01 | 0.77 |
| XI | Library exposure | ||
| 1 | Every day | 60 | 46.51 |
| 2 | Twice in a week | 26 | 20.15 |
| 3 | Once in a week | 22 | 17.05 |
| 4 | Once in a fortnight | 05 | 3.87 |
| 5 | Once in a month | 11 | 8.52 |
| 6 | Once in three months | 01 | 0.77 |
| 7 | Once in six months | 01 | 0.77 |
| 8 | Once in a year | 01 | 0.77 |
| 9 | Never | 02 | 1.55 |
| XII | Job Preference | ||
| 1 | University services | 93.54 | II |
| 2 | ICAR services | 91.47 | III |
| 3 | Government jobs | 95.09 | I |
| 4 | Banking sector | 90.95 | IV |
| 5 | Private sectors | 86.30 | X |
| 6 | Non-governmental organizations | 85.01 | XI |
| 7 | Agriculture advice | 88.88 | VII |
| 8 | Agricultural Entrepreneurship | 88.11 | VIII |
| 9 | Co-operative society | 87.33 | IX |
| 10 | Agricultural marketing services | 89.92 | VI |
| 11 | Agriculture | 90.43 | V |
| 12 | Non-agricultural professions | 84.75 | XII |
Table text extracted from the original PDF; superscript letters are shown inline. The original table image is below.
View original table image
Acknowledgement
www.extensionjournal.com scholars of state agriculture university in Rajasthan. (Unpublished master's thesis). Sri Karan Narendra Agriculture University, Jobner; c2016. 6. Tanwar KN. Soft skills of the students of Sri Karan Narendra Agriculture University, Jobner. (Unpublished master's thesis). Sri Karan Narendra Agriculture University, Jobner; c2018. 7. Thakur S. Gap soft analysis of professional soft skills among girl students of agriculture faculty. (Unpublished master's thesis). Anand Agricultural University, Anand; c2014.