
Research article · 2024 · Full text
International Journal of Agriculture Extension and Social DevelopmentAn analysis of the reasons for stay and physical ailments of the aged in old age homes, Ludhiana
Volume 7(2S) · Pages 121–123 · DOI: 10.33545/26180723.2024.v7.i2sb.360 ↗
Research areasHealth and Well-being Studies
Abstract
Author-writtenThe United Nations Organization had declared the year 1999 as the International Year of Older Persons. Ageing is universal and inevitable phenomenon of life. Health is a crucial factor for the aged especially living in old age homes. The present study deals with the reasons for stay and the physical ailments of the aged in old age homes, Ludhiana. 90 inmates of the old age homes were studied through interview method. Time of stay at old age home, preference to stay, reasons for residing in old age homes, medical help, reasons for not taking medical help and varied health and physical problems of the inmates of old age home were seen. Nearly 37% of the respondents were staying since 1 to 4 years in the old age home. About 64% of the inmates were living forcefully here and reason for staying here was the non-cooperation of the family members. The respondents use to take medical help fortnightly and about 60% do not avail medical help due to lack of money. Most of the inmates i.e. 65% had eye sight problem. All this highlights the reasons and physical ailments of the inmates of the old age homes.
Summary
Source-checkedPlain-language reading of the full paper, prepared with AI and checked against the text. Each point links to the authors' own words.
Why it matters
- The global elderly population is growing rapidly, with projections suggesting an increase from 70 million in 1998 to 177 million by 2025. View evidence ↗
- There is a modern trend where younger generations are less inclined to live with their elderly relatives. View evidence ↗
- Maintaining health is particularly critical for elderly individuals residing in old age homes. View evidence ↗
The question
- The study aims to analyze why elderly people stay in old age homes in Ludhiana and what physical ailments they experience. View evidence ↗
What they did
- Data collection was performed through personal interviews using a structured and pre-tested schedule. View evidence ↗
- The study measured duration of stay, preference and reasons for residing in the home, medical help usage, barriers to medical aid, and specific physical ailments. View evidence ↗
What they found
- The most common duration of stay was 1 to 4 years, reported by 36.67% of the total respondents. View evidence ↗
- A majority of the inmates (63.33%) reported that they were forced to stay in the old age home. View evidence ↗
- The primary reason for residing in the home was non-cooperation from family members, affecting 52.22% of inmates. View evidence ↗
- The most frequent pattern of medical consultation was fortnightly, occurring for 27.78% of the inmates. View evidence ↗
- Lack of money was the leading barrier to medical assistance, cited by 60% of the inmates. View evidence ↗
- Eye-sight problems were the most prevalent physical ailment, affecting 64.44% of the respondents. View evidence ↗
- Joint pain was reported by 45.56% of the inmates, with a higher prevalence in females (55.88%) than males (39.29%). View evidence ↗
- Heart ailments were reported by 41.11% of the study participants. View evidence ↗
- Blood pressure, gastroenteritis, and diabetes each affected 38.89% of the respondents. View evidence ↗
What it means
- The authors conclude that government and public awareness of these issues is necessary to improve the lives of the elderly in old age homes. View evidence ↗
Figures & tables
From the original paper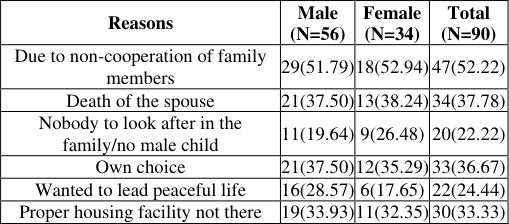 Table 3
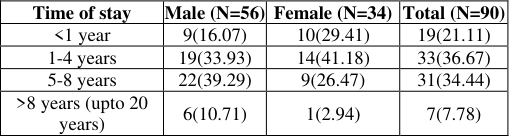 Table 1
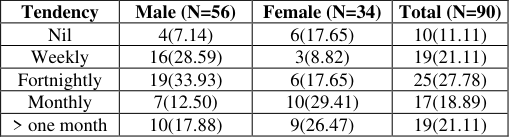 Table 4
 Table 2
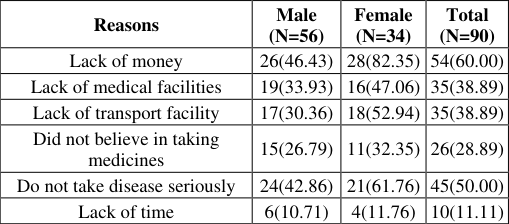 Table 4
 Table 6
Introduction
A hike in the elderly population was witnessed in the last century. The various reasons behind it were longevity in age, decline in death rate, improvement in life expectancy at birth, better and improved medical facilities and increase in average span of life. The United Nations Organisation had declared the year 1999 as the International Year of Older Persons with the objective to prepare the world for a dramatic increase in the number of such persons during the 21 st century. According to the United Nation's Projections, by the year 2050, every third person on the earth will be aged 60 years and above. The population of the elderly is increasing at a faster pace from 70 million in 1998 and expected to be 177 million by 2025. Ageing is universal and inevitable phenomenon of life. Health is a crucial factor for the aged especially living in old age homes. In the present time children and grandchildren no longer prefer to stay with their geriatric population. Zisook (2007) perceptions of old age followed two broad themes which were classified as a trend towards 'Fatalism' and 'role loss'. Fatalism here refers to the philosophical doctrine that all events are predetermined so man is powerless to alter his destiny, thereby accepts and submits to this doctrine and lacks actions and efforts to change it. On the other hand, is the role loss-as people age, they start losing roles as active parents employees and spouses which leads to feelings of loss of control over life and impaired social contact. Ghai (1990) [6] while reporting on health status of the aged in rural Punjab had concluded that 48 percent elderly suffered minor illness 10% were seriously ill. A majority suffered from hypertension, heart ailment, weak eye sight and asthma. Some others had stomach disorder, ear problem and general weakness. Ara (1995) [1] concluded that old age is often viewed as a problematic period of one's life which brings numerous problems when the capacity of adaptability is at the minimum. With advance in age the earning capacity of the individual decreases and hence the care takers become the care seekers. Bahadur B (2018) [2] Ageing is a natural phenomenon, it brings with it new challenges for the elderly. Elderly have to adapt to these changes along with the physical and emotional changes taking place in them. They demand care and respect from the society they live in. The need of the hour is to get aware of the rights of the elderly. Use these facilities to make life better. Maheshwari S (2021) [7] Old age is an inevitable developmental process which affects the psychology of the aged. Along with the increase in the life expectancy, the mental wellbeing and self-esteem of the aged is equally important. The government and the society need to bring certain changes in the community and at medical centres to improve the mental health of the aged.
Materials and Methods
The present study was conducted in Ludhiana district of www.extensionjournal.com Punjab as it is more development from agrarian and industrial point of view. All the ninety inmates of senior citizen homes of Ludhiana were taken as respondents for the present investigation. Data were collected personally with the help of the structured and pre-tested interview schedule. The results in the present study have been calculated by applying various statistical tools.
Results and Discussion
To know about the reasons for stay and the physical ailments of the aged, the respondents were asked about their duration of stay in old age home, preference of staying in old age home, reasons for residing in old age home, tendency of taking medical help, reasons for not taking medical aid and their various health and physical ailments were asked from the inmates of old age. Everyone loves their home. The value of home is much more when you are in the last years of your life. In the last faded years of life one wants to spend time with its family and in the home that they have made and decorated through their hard work. Table 1 reveals the other truth of life, it shows the number of the aged who are living in the old age homes for last many years. Majority i.e. 36.67% of them are staying in the senior citizen homes for 1-4 years, in which 41.18% were females and 33.93% were male. In comparison 21.11% of respondents were living in these old age homes for less than one year and about 8% of the inmates out of which 10.71% have been male and 2.94% have been females were living in these old age homes for more than 8 years. Staying in the senior citizen home is not always forcefully done. Some aged, themselves voluntarily opt to live here due to their self-respect and dignity. They prefer loneliness of old age home over the disgrace that is given to them by their own family members. Table 2 shows that although majority i.e. 63.33% of the inmates of senior citizen home were forcefully made to stay in old age homes out of which 64.71% were female and 62.50% were male. While nearly 37% of the respondents constituting 35.29% females and 37.50% male were residing in these old age homes willingly i.e. with their own wish. 3 indicates the varied reasons which forced the aged to take shelter in the old age home. Majority i.e. 52.22% of the inmates were staying due to non-cooperation of the members of the family out of which 51.79% were male and 52.94% were female. About 37.78% aged were staying in old age homes after the death of their spouse. Whereas nearly 37% of the inmates reported that they were voluntarily residing in the old age home (i.e. own choice). While 33.33 percent had to stay here due to no proper housing facility available with them. On the other hand desire to live peaceful life made 24.44% of the respondents to live in the senior citizen homes, out of which 28.57 percent were male and 17.65 percent were females. 4 depicts that 27.78% of the inmates, visited the doctor fortnightly i.e. 33.93% male and 17.65% female. While 21.11% of the respondents consulted the doctor in a period of less than a month and the same percentage (i.e. 21.11%) visits the doctor weekly. In comparison to this 11.11 percent of the inmates never consulted any doctor or took any medical advice. The most essential materialistic element human need to survive is money. Table 5 highlights that 60% of the inmates of old age homes could not take medical assistance due to lack of money while 50% (42.86% male and 61.76% female) do not take their disease seriously so they do not take medical help. Whereas nearly 39% aged reported that they don't get medical help due to lack of availability of transport facilities at senior citizen homes. About 12% inmates do not seek medical assistance due to lack of time as they remain busy chanting name of God or arranging their things, gardening etc. Health is wealth but this proverb is incomplete as there could be no health without wealth. Table 6 indicates the various physical and health problems faced by the inmates of old age home. Majority i.e. 64.44% of them had eye-sight problem. Pain in joints was complained by 45.56% of the respondents (55.88% female and 39.29% male). Heart ailment was reported by 41.11% of the inmates. Another 38.89% of the respondents had blood pressure, gastroenteritis and diabetes. While 17.78% were suffering from asthma, the percentage of females suffering from asthma was higher then their male counterparts.
| Problems | Male (N=56) | Female (N=34) | Total (N=90) |
|---|---|---|---|
| Heart Problem | 28(50.00) | 9(26.47) | 37(41.11) |
| Blood Pressure | 21(37.50) | 14(41.18) | 35(38.89) |
| Eye-Sight | 37(66.07) | 21(61.76) | 58(64.44) |
| Asthmatic | 9(16.07) | 7(20.59) | 16(17.78) |
| Diabetes | 19(33.93) | 16(47.06) | 35(38.89) |
| Gastroenteritis | 23(41.07) | 12(35.29) | 35(38.89) |
| Joint Pains | 22(39.29) | 19(55.88) | 41(45.56) |
| Common infection (Chronic cold, cough) | 18(32.14) | 8(23.53) | 26(28.89) |
Table text extracted from the original PDF; superscript letters are shown inline. The original table image is below.
View original table image
| Preference of stay | Male (N=56) | Female (N=34) | Total (N=90) |
|---|---|---|---|
| Own wish | 21(37.50) | 12(35.29) | 33(36.67) |
| Forcefully | 35(62.50) | 22(64.71) | 57(63.33) |
Table text extracted from the original PDF; superscript letters are shown inline. The original table image is below.
View original table image
| Time of stay | Male (N=56) | Female (N=34) | Total (N=90) |
|---|---|---|---|
| <1 year | 9(16.07) | 10(29.41) | 19(21.11) |
| 1-4 years | 19(33.93) | 14(41.18) | 33(36.67) |
| 5-8 years | 22(39.29) | 9(26.47) | 31(34.44) |
| >8 years (upto 20 years) | 6(10.71) | 1(2.94) | 7(7.78) |
Table text extracted from the original PDF; superscript letters are shown inline. The original table image is below.
View original table image
Conclusion
The problems of the old age are rapidly increasing in its magnitude. Low income, inadequate accommodation, loneliness, ill health and social neglect are the main problems faced by the elderly population of the country. Most of the respondents were staying in the old age homes since 1 to 4 years. They were staying forcefully in these homes. The reason for their stay in the old age home was the non-cooperation of the family members. Maximum inmates take medical help fortnightly lack of money was the reason for not taking medical help by the most of the respondents. Majority of them suffer from eye-sight ailment. So by understanding the above concept, the people, the govt. and we all in general can help the aged in these old age homes to improve their lives.
Figures and tables from the paper
| Reasons | Male (N=56) | Female (N=34) | Total (N=90) |
|---|---|---|---|
| Due to non-cooperation of family members | 29(51.79) | 18(52.94) | 47(52.22) |
| Death of the spouse | 21(37.50) | 13(38.24) | 34(37.78) |
| Nobody to look after in the family/no male child | 11(19.64) | 9(26.48) | 20(22.22) |
| Own choice | 21(37.50) | 12(35.29) | 33(36.67) |
| Wanted to lead peaceful life | 16(28.57) | 6(17.65) | 22(24.44) |
| Proper housing facility not there | 19(33.93) | 11(32.35) | 30(33.33) |
Table text extracted from the original PDF; superscript letters are shown inline. The original table image is below.
View original table image
| Tendency | Male (N=56) | Female (N=34) | Total (N=90) |
|---|---|---|---|
| Nil | 4(7.14) | 6(17.65) | 10(11.11) |
| Weekly | 16(28.59) | 3(8.82) | 19(21.11) |
| Fortnightly | 19(33.93) | 6(17.65) | 25(27.78) |
| Monthly | 7(12.50) | 10(29.41) | 17(18.89) |
| > one month | 10(17.88) | 9(26.47) | 19(21.11) |
Table text extracted from the original PDF; superscript letters are shown inline. The original table image is below.
View original table image
| Reasons | Male (N=56) | Female (N=34) | Total (N=90) |
|---|---|---|---|
| Lack of money | 26(46.43) | 28(82.35) | 54(60.00) |
| Lack of medical facilities | 19(33.93) | 16(47.06) | 35(38.89) |
| Lack of transport facility | 17(30.36) | 18(52.94) | 35(38.89) |
| Did not believe in taking medicines | 15(26.79) | 11(32.35) | 26(28.89) |
| Do not take disease seriously | 24(42.86) | 21(61.76) | 45(50.00) |
| Lack of time | 6(10.71) | 4(11.76) | 10(11.11) |
Table text extracted from the original PDF; superscript letters are shown inline. The original table image is below.
View original table image
References
8 in the original paper- Ara S. An analysis on the life satisfaction of elderly in rural Punjab (Ludhiana Dist.). Indian Psychological Review. 1995;54:27-32.
- Bahadur B. Elderly and changing role of families in Punjab. Indian Journal of Gerontology, 2018, 32(3).
- Bhagat D, Devi P. A study to assess the psychological problems and coping strategies of elderly persons residing in selected old age homes, Gobindgarh (Punjab). Journal of Emerging Technologies and Innovative Research, 2021, 8(12).
- Dubey A, Basin S. A study of elderly living in old age home and within family set-up in Jammu. Studies on Home and Community Science. 2011;5(2):93-98.
- Maheshwari SK, Chaturvedi, Sharma P. Effectiveness of psycho-educational intervention on psychological distress and self-esteem among resident elderly: A study from old age homes of Punjab, India. Clinical Epidemiology and Global Health, 2021, 11.
- Singh R, Raut N. Perception of old age and self: A comparative study of elderly females living in community and in old age home. Journal of Geriatric Mental Health. 2014;1(1):32-37.
- Siva Raja. Health of the elderly in India: Issues and Implications. Help Age India -Research and Development Journal. 2002;8:25-30.
- United Nations. World Population Ageing 1950-2050. New York: Population Division, Department of Economic and Social Affairs, United Nations; 2002.