
Research article · 2024 · Full text
International Journal of Agriculture Extension and Social DevelopmentValue chain analysis of honeybee (Apis cerena) products in Jajarkot district, Nepal
Volume 7(2) · Pages 407–411 · DOI: 10.33545/26180723.2024.v7.i2f.355 ↗
Research areasInsect and Pesticide ResearchInsect Utilization and Effects
Abstract
Author-writtenThis study conducted a value chain analysis of honey bee (Apis cerena) products in Jajarkot district from February to July 2021. Using a mix of random and purposive sampling, 80 respondents were surveyed, including 70 beekeepers and various stakeholders. The study categorized farmers as small and semi-commercial based on hive numbers. Primary data was collected through interviews, focus groups, and surveys, supplemented by secondary data from relevant publications. Honey emerged as the main apiary product, with bee wax as the major byproduct. Semi-commercial farmers demonstrated higher honey productivity (3.44 kg/hive) compared to small farmers (2.55 kg/hive). The study revealed gross returns, benefit-cost ratios, and value chain actors, including input suppliers, producers, middlemen, cooperatives, retailers, and consumers. Home-level processing and packaging were undertaken by producers, while honey flowed through the entire value chain. Marketing efficiency varied across selling modes, with challenges identified in scientific knowledge on beekeeping and costly transportation.
Summary
Source-checkedPlain-language reading of the full paper, prepared with AI and checked against the text. Each point links to the authors' own words.
Why it matters
- Beekeeping is a traditional and potentially profitable activity for impoverished farmers in Nepal. View evidence ↗
- Nepal's honey production is significantly below its potential, producing only 3,500 MT in 2015/16 despite a capacity for one million colonies. View evidence ↗
- Small-scale beekeepers in the Jajarkot district struggle with poor infrastructure, limited production, and a lack of modern technology. View evidence ↗
The question
- The primary goal of the study was to perform a detailed value chain analysis of honeybee products. View evidence ↗
What they did
- The research focused on Apis cerena honeybee products in the Jajarkot district between February and July 2021. View evidence ↗
- The sampling frame consisted of 250 farmers who owned more than 5 hives. View evidence ↗
- Data collection methods included questionnaire surveys, interviews, key informant surveys, rapid market appraisals, and focus group discussions. View evidence ↗
What they found
- Semi-commercial farmers had a higher average honey productivity (3.44 kg/hive) compared to small farmers (2.55 kg/hive). View evidence ↗
- Semi-commercial farmers maintained a significantly larger area of rapeseed for foraging (4.77 ropani) than small farmers (3.61 ropani). View evidence ↗
- Approximately 89.93% of the total honey produced (3,170 kg) was sold as marketed surplus. View evidence ↗
- Marketing efficiency was highest (17.83) for direct sales to local consumers and lowest for the channel involving middlemen and retailers in Kathmandu. View evidence ↗
- High transportation costs were identified as the primary marketing challenge for beekeepers in the region. View evidence ↗
What it means
- The authors conclude that the abundance of Indian butter trees, the quality of the resulting honey, and the resilience of local bee breeds are the main strengths of beekeeping in Jajarkot. View evidence ↗
- The study notes that honey production during the survey year was suppressed primarily due to drought. View evidence ↗
Visual summary
2 visualsIllustrations explain the paper; charts are replotted from the paper's own table values.
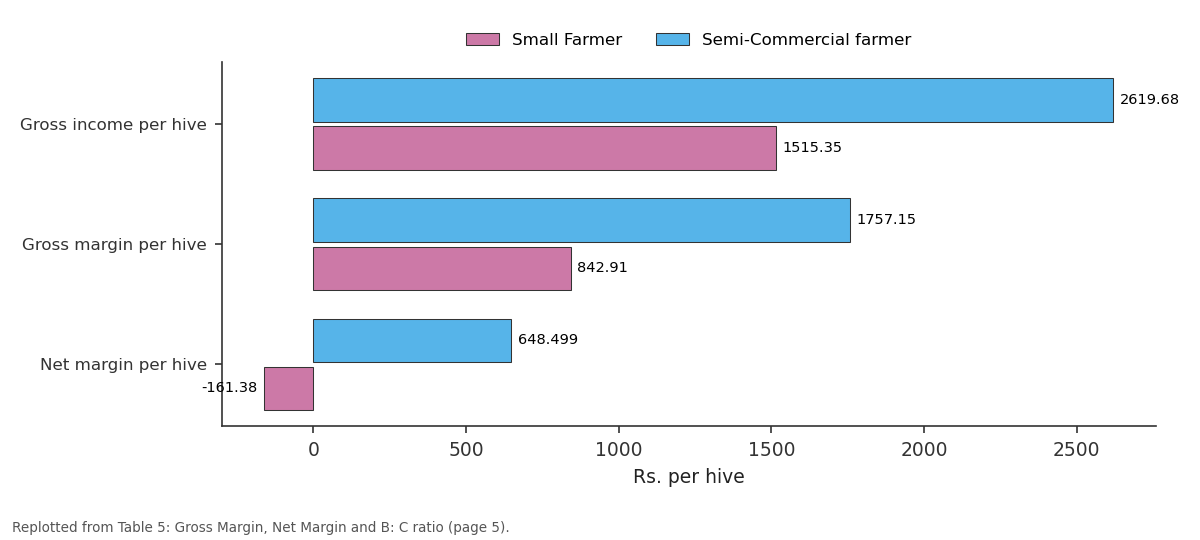
Small Farmer and Semi-Commercial farmer: Gross income per hive vs Gross margin per hive vs Net margin per hive
Replotted from Table 5 (page 5) of the original paper. Every bar is the paper's own table value.
View source evidence ↗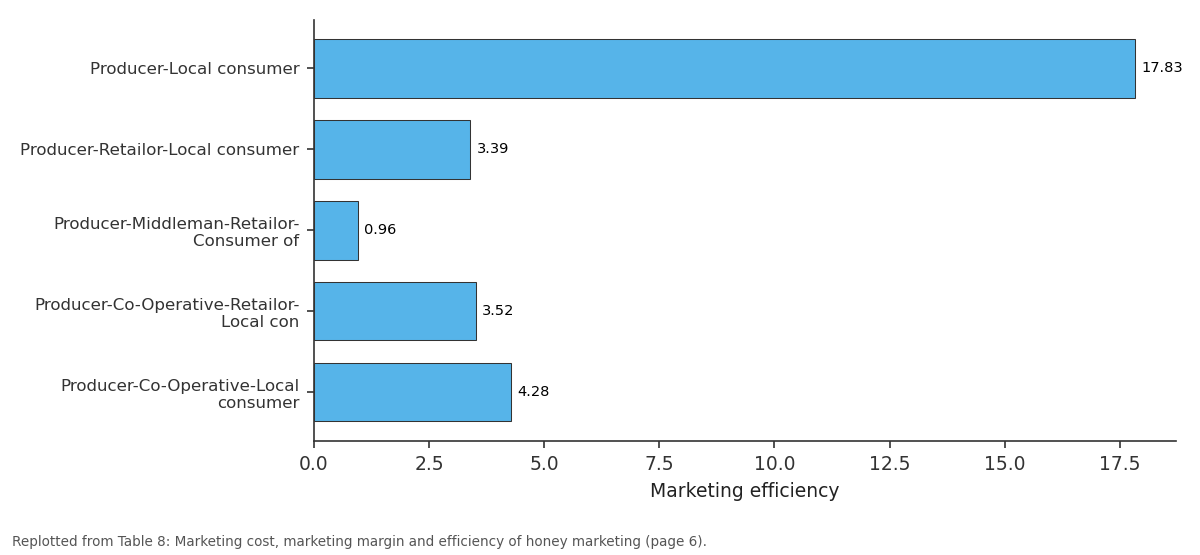
Marketing efficiency: Producer-Local consumer vs Producer-Retailor-Local... vs Producer-Middleman-Retai... vs Producer-Co-Operative-Re... vs Producer-Co-Operative-Lo...
Replotted from Table 8 (page 6) of the original paper. Every bar is the paper's own table value.
View source evidence ↗Figures & tables
From the original paper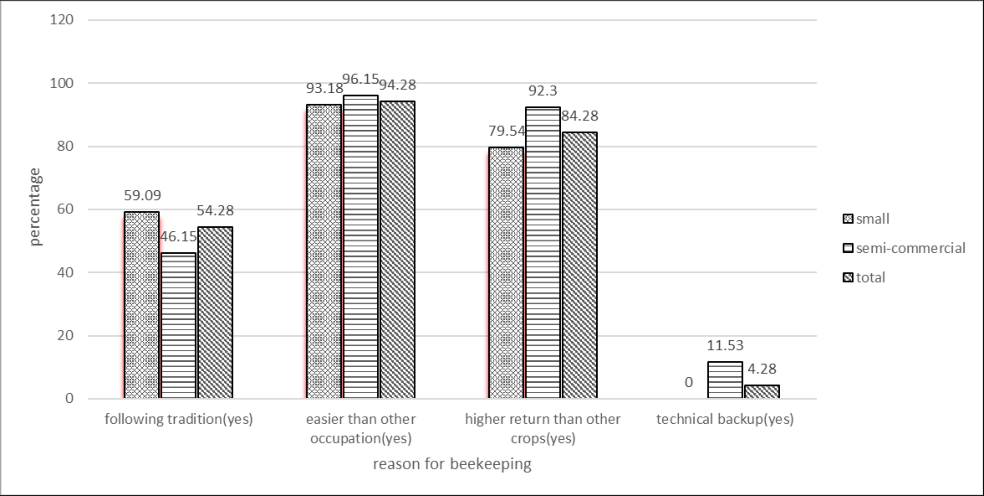 Figure 1
 Table 1
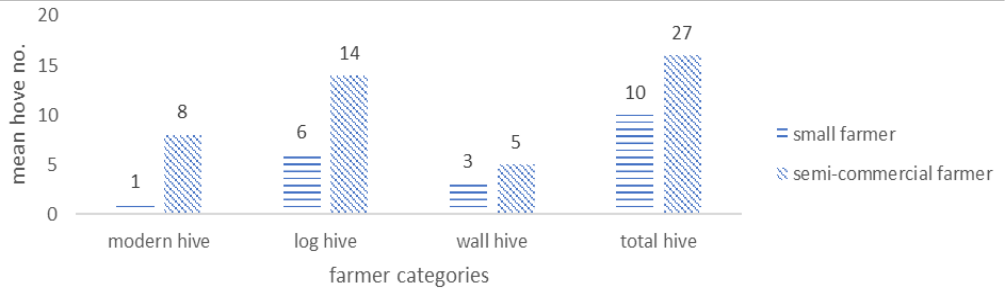 Figure 3
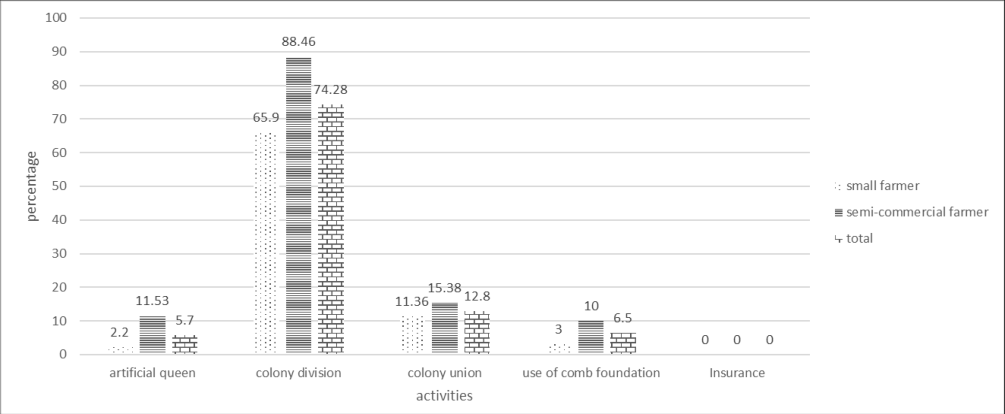 Figure 2
 Table 2
 Table 3
 Table 4
 Table 5
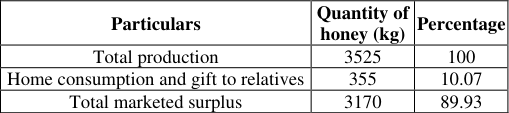 Table 6
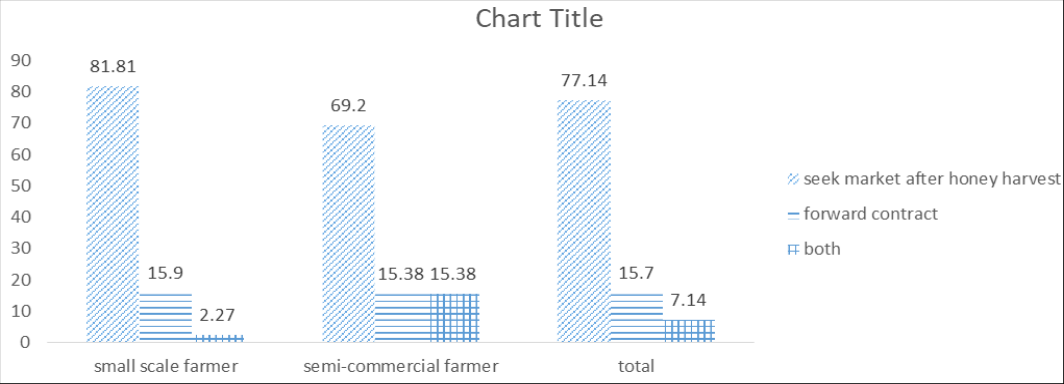 Figure 4
 Table 7
 Table 8
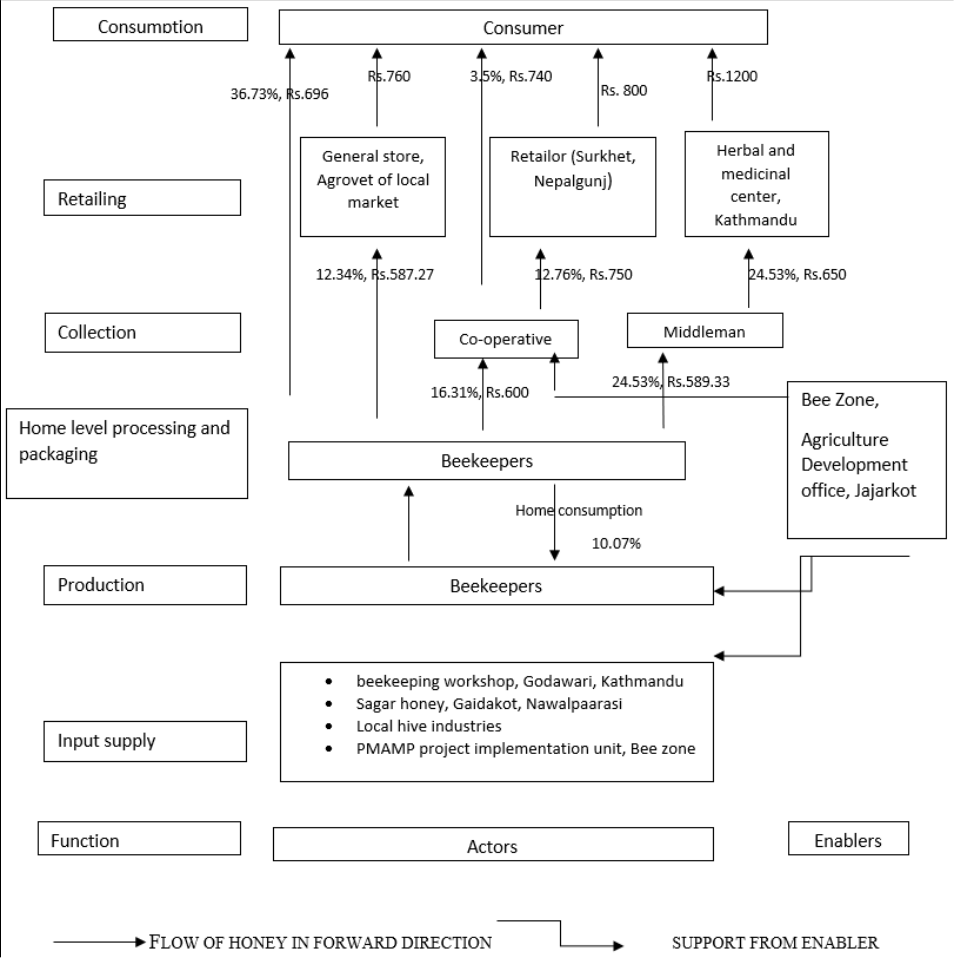 Figure 5
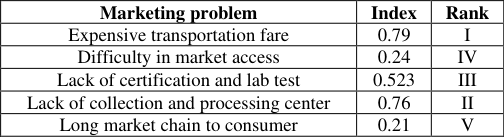 Table 9
Introduction 1.1 Background of study
Beekeeping, an ancient practice in Nepal, proves a lucrative option for poor farmers. Favorable climatic conditions and diverse flora make Nepal ideal for large-scale beekeeping, transforming lives with traditional knowledge and sustainable resource use (Bhandari & Kattel, 2020) [4] . Apiculture, covering honey hunting, involves products like honey, wax, pollen, etc. Codex Alimentarius defines honey. Nepal's honey is mainly multifloral, sourced from various plants (GTZ, 2014) [9] . Despite the potential for one million bee colonies, Nepal produced only 3,500 MT of honey in 2015/16 (Bhandari & Kattel, 2020) [4] . Three bee zones exist in Chitwan, Jajarkot, and Dang, with 5,150 registered beekeepers (Kafle & KC, 2019) [12] . Nepal's honey export is 4 MT, while imports are 300 MT to meet domestic demand. Nepali honey constitutes 45% of total consumption (Bhandari & Kattel, 2020) [4] . Nepal boasts nine honeybee species, with five economically vital species present, including Apis cerana and Apis mellifera. Jajarkot, a mountainous district in Karnali Province, has diverse zones and abundant Indian butter tree plants, making it a potential hub for beekeeping.
Problem Statement
Smallholder farmers in Jajarkot face challenges due to limited production, inadequate infrastructure, and lack of technological advancements. Issues include market information, quality improvement, and the absence of value chain schemes. Processed honeybee products are not prevalent.
Rationale of study
Honey emerges as a potential export commodity in Nepal's high hills. The value chain approach is crucial for income generation, analyzing links, information flow, and market boundaries. A systematic value chain study aids in addressing existing problems and formulating competitive market strategies.
Objectives 2.1 General objective
Conduct an in-depth value chain analysis of honeybee products.
Specific objectives
Identify actors in the honey bee product value chain. Evaluate productivity, profitability, and market efficiency for honey producers. Assess producer share and price spread across the value chain. Perform a SWOT analysis of the honey bee product value chain.
Research Methodology
This section includes the methods and procedure how the whole study was carried out. www.extensionjournal.com
Population Sample and sampling technique
There were altogether 929 registered farmers in bee zone.
Research site was purposively selected as Nalagad municipality ward no. 1, 2, 3, 4, 5 and 6 and Bheri municipality ward no. 1 and 2. Sampling frame for the research was 250 farmers having hive size more than 5. Altogether, 80 respondents were selected for questionnaire interview. 70 beekeeping farmers were selected using simple random sampling technique. 1 co-operative, 2 middleman, 4 retailors and 3 consumers were purposively selected along with 2 FGDs. Pre-testing of the questionnaire was also carried out in 10 respondents which were selected randomly.
Research instruments
Interview using semi-structured interview schedule was carried out for primary data. Different checklist was prepared to collect information from the local collectors, cooperative and retailers. Production level economic details was collected with interview schedule taking farmers as the respondent. Information on marketing and other stages of value chain was also taken with interview schedule.
Data and data types
Both primary and secondary information was collected during research study. The primary sources of information were all actors of the value chain like input suppliers, producers, traders, service providers, key informants of related sectors. Secondary information was collected from different articles, reports, journals, books and internet materials related to bee products production and marketing, and value chain approach. Primary data was collected by Key Informant Survey (KIS), Focus Group Discussion (FGD), Rapid Market Appraisal (RMA), Interview and Questionnaire Survey.
Key Informant Survey (KIS)
Key informants are the local leaders and progressive farmers. An interview with them will allow knowing about the present policies and working of value chain.
Triangulation is important with this research tool so people from different backgrounds were interviewed and their answers compared.
Interview
Semi-structured interview was conducted with the local residents, local experts, officials and concerned stakeholders.
Rapid Market Appraisal (RMA)
RMA gave an overview about the market and the value chain working of the commodity.
Focus Group Discussion (FGD)
FGD was conducted in the final session of data collection to verify the result obtained with the help of questionnaire survey. Two FGD were done. Secondary data were obtained by the desk survey, library study, data from Agriculture Knowledge Centre, Federation of National Beekeepers and other similar organizations. The literature of concern was gone through to collect the relevant information. Person and organization currently working or had worked on similar tasks were also consulted.
Techniques of data analysis
The collected data were entered and analyzed by using Microsoft Excel 2010, Statistical Package for Social Sciences (SPSS 23.0 V) and Microsoft Word 2010 was used for word processing.
Results and Discussion
Results and Discussion
Reasons for beekeeping
Beekeeping is gaining popularity among Jajarkot farmers, with motivations categorized as tradition (54.28%), ease compared to other occupations (94.28%), higher returns than other crops (84.28%), and technical support from I/NGOs (4.28%), as shown in Figure 1.
Management Practices
Beekeepers in the study area achieve higher returns and smooth enterprise operation through effective management practices. Only 5.7% practice artificial Queen Bee production, with a success rate below 5% at the farmer level. Traditional hive prevalence hinders artificial queen production and yearly queen replacement. Colony division is adopted by 74.28% of farmers for multiplication, while 12.8% opt for colony union to strengthen colonies. Only 6.5% use comb foundation, limited by the abundance of traditional hives. Insurance for bees is nonexistent in Jajarkot district, with none of the farmers opting for it, as depicted in Figure 2.
Status of beehive present in the study area
Small farmers have an average of 10 bee hives, with 1 modern hive, 6 log hives, and 3 wall hives. In contrast, semi-commercial farmers average 27 bee hives, including 8 modern hives, 14 log hives, and 5 wall hives, as depicted in Figure 3. Log and wall hives, made locally, offer protection from winter cold due to their thickness. However, the recommended modern hive (Newton A) is expensive and less available in the beekeeping area. Farmers mainly acquire modern hives through the 50% subsidy program of Bee Zone, Jajarkot, and 100% subsidies from NGOs and INGOs.
Productivity per hive
Average honey productivity for small and semi-commercial were 2.55 kg/hive and 3.44 kg/hive respectively. Honey productivity per hive of semi-commercial farmer (3.44) was significantly higher than honey productivity of small farmer (2.55) at 10* level of significance. Semi-commercial farmers had adopted some of the bee management practice but most of small farmers only harvest honey in the honey flow season so their was significant difference in productivity between farmer categories.
Harvesting of honey in 2077 B.S
The average harvesting of honey in the study area was 2.64. Number of honeys harvesting of small and semi-commercial farmers were 2.56 and 2.76 respectively. No. of honey harvesting of small and semi-commercial farmers were statistically similar as honey harvesting is completely depend on natural availability of nectar and pollen sources. Due to drought in the surveyed year, farmer could not harvest mustard honey and spring season mixed honey. Indian butter tree's honey harvesting was also reduced due to early senescence of flower (5-6 times harvesting of Indian butter tree's honey in 2076 B.S)
Maintenance of flowering plants
Rapeseed had grown in cultivable land as a foraging plant in the surveyed area. Average rapeseed grown area was 4.04 ropani. Rape seed grown area of semi-commercial farmer (4.77) was significantly higher than rapeseed grown area of small farmer (3.61) at 5% level of significance but farmer couldn't harvest mustard honey in the survey year due to drought. Indian butter tree's leaves were used as fodder in the month of March-April by completely defoliating the plant which also reduce flowering of plant. Forest fire in the month of March-April also reduce nectar and pollen source.
Bee migration
They had not practice foraging of bee because of transportation difficulty and presence of traditional hive. They also did not feel to migrate Apis cerena bee for foraging. Honey production would increase if they practiced bee migration for foraging. (Focus group discussion).
Economic of honey production 4.8.1 Production analysis
In sampled household honey found to be major apiary product and bee wax was the major by product, production of other apiary products such as pollen, royal jelly, bee sting was nil (there was no market for selling of pollen, royal jelly, bee sting). The average number of bee hive per farmer in the study area was 16.5 hives and average honey production per annum was 2.99 kg/hive.
Gross return
Average gross return of honey production and other related products for small scale and semi-commercial farmer were NRs. 1515.3/hive and NRs. 2619.68/hive respectively which is given in table 6. Gross return per kg of Indian butter tree's honey in the surveyed area was found NRs. 368 (Sharma & Bhari) 7. The B:C ratio reported by (Sharma & Bhari) was 6.4 in Jajarkot, Nepal. Honey and wax were only honeybee product produced in the study area. Honey Production per hive (2.99 kg/hive) was very low. The main reason behind low honey production was drought. Traditional hive, rare practice of use of artificial feeding, rare use of comb foundation, lack of practice bee foraging and old queen also reduce honey production. So, due to lower honey production in the surveyed year B:C ratio was found low. www.extensionjournal.com 4.9 Marketing analysis 4.9.1 Activities performed by farmer for honey sale 77.14% of the sampled farmer sought market for honey sale after honey harvesting. Likewise,15.7% of farmer did forward contract to sell honey while 7.14% of the surveyed farmer sold honey through forward contract and rest through seeking market after honey harvest which is shown in figure 9.
| Particulars | Quantity of honey (kg) | Percentage |
|---|---|---|
| Total production | 3525 | 100 |
| Home consumption and gift to relatives | 355 | 10.07 |
| Total marketed surplus | 3170 | 89.93 |
Table text extracted from the original PDF; superscript letters are shown inline. The original table image is below.
View original table image
Source: field survey, 2021)
Marketed surplus
Total marketed surplus of honey production in the sampled area was 89.93% which was 3170 kg. 10.07% of total produced honey was used for home consumption and gift to relatives. The total marketed surplus of honey found in study area was higher than marketed surplus of honey found by Prasad et al. (2012) [13] as 95 percent in Uttarakhand, India.
Major Marketing Channels
Only raw honey was produced in the studied area. Farmer did home level processing (squeezing, filtering and filling in plastic bottle). Some farmer also did tag of honey bottle but mostly tagging was done by co-operative and Herbal and medicinal Centre of Kathmandu. Five major marketing channels were identified in the study area. In the previous year honey production was high so farmer's group was also involved in honey marketing. Producer had also collected and transferred 2000kg honey to Kathmandu to export. (https://krishionline.com, 2075). Co-operative had also received more than 1000 kg so co-operative had also sold honey to wholesaler outside of district.
Farm gate price, price spread and producer's share
Farm gate price received by honey producers were varied with the mode of selling or marketing channel in the study area, because different marketing agencies offered different price to the producers and share of marketing cost to be incurred by them also differ. The highest farm gate price i.e., NRs. 659.04 was received in producers to direct consumer mode of selling and lowest farm gate price i.e. NRs. 553.14 was received in Producer-retailor-local consumer mode of selling. The highest price spread i.e. NRs. 651.54 was found in Producer-middleman-retailorwww.extensionjournal.com consumer of Kathmandu mode of selling and lowest price spread i.e. NRs. 36.96 was found in Producers to directly local consumer mode of selling. Whereas, Producer's share was highest i.e., 94.6% in the producers to directly local consumer mode of selling and lowest producer's share i.e., 46.5% was found in Producer-middleman-retailor-consumer of Kathmandu mode of selling. The details are given in Table 7.
Marketing cost, marketing margin and efficiency of honey marketing
In the entire value chain, highest marketing cost incurred to Producers (cost of transportation and plastic bottle for packaging). Rest of the intermediaries sold raw honey packed by farmer in the plastic bottle; their marketing cost was only cost of Godown but in case of distant market, market intermediaries also incurred transportation cost. Highest marketing cost of producer was found in producer to local consumer mode of selling i.e., NRs. 36.96/kg and lowest marketing cost of producer was found in Producer-Middleman-Retailor-Consumer of Kathmandu i.e., NRs. 30.87. Marketing margin in producer-local consumer mode selling was nil and highest marketing margin was found in Producer-Middleman-Retailor-Consumer of Kathmandu mode of selling i.e., NRs. 524.8. Highest marketing efficiency i.e.,17.83 was found in producer-local consumer mode of selling and lowest marketing efficiency was found in Producer-Middleman-Retailor-Consumer of Kathmandu mode of selling which is shown in table 8. Although, market intermediaries had utilized place utility to gain higher price of honey but producer hadn't got price benefit.
| Mode of selling | Marketing cost of producers (Rs.) | Marketing cost of intermediaries (Rs.) | Marketing margin of intermediaries (Rs.) | Marketing efficiency |
|---|---|---|---|---|
| Producer-Local consumer | 36.96 | 0 | 0 | 17.83 |
| Producer-Retailor-Local consumer | 34.13 | 5 | 133.6 | 3.39 |
| Producer-Middleman-Retailor-Consumer of Kathmandu | 30.87 | 55 | 524.8 | 0.96 |
| Producer-Co-Operative-Retailor-Local consumer | 35.56 | 20 | 114.44 | 3.52 |
| Producer-Co-Operative-Local consumer | 35.56 | 10 | 94.44 | 4.28 |
Table text extracted from the original PDF; superscript letters are shown inline. The original table image is below.
View original table image
Value Chain Operators 4.10.1 Input suppliers
Bee zone, Jajarkot was the major input suppliers which provide beekeeping equipment like Newton A modern hive, comb foundation, bee veil, gloves, wax machine and other beekeeping equipment at 50% subsidy. Bee zone, Jajarkot also provide training for beekeepers. Local hive industry also provides modern bee hive but beekeepers-built log hive and wall hive themselves. Some farmer bought bee keeping equipment from Chitwan and Katmandu. Beekeepers used locally available herb as medicine but some farmer bought sugar for artificial feeding through local shop. But there was rarely available beekeeping equipment and their procurement to beekeepers is so much difficult and expensive
Producers
Producer sold produced honey directly to the local consumer as honey is necessary in marriage ceremony for making a product called 'LARU' and consumed as medicine. The problem starts when the production volume increases where the beekeepers are facing difficulties in selling their honey since the huge quantity of production cannot be absorbed in the local market. Then, they sold their honey to co-operative, middleman, Retailor. Honey is the major bee product currently produced, apart from wax. The production of wax is not very significant in terms of volume and return. The currently produced honey was Rapessed, Chiuri, and spring season's mixed honey. Most of the farmer are following traditional method of beekeeping and honey productivity was low. Climate change was major problem for beekeeping.
Collectors / Middleman / Market facilitator
The normal practice among collectors is to collect the honey from the beekeepers based on individual contacts and relationships. There is no formal contractual agreement between the collectors and the beekeepers. The transactions take place purely on a trust basis. The case is the same between the collectors and wholesale and retail buyers. There is no written agreement. Most of the middleman sent honey outside the district.
Cooperatives
In ideal situation cooperatives are supposed to collect the honey from members, but this is not the common practice at www.extensionjournal.com present. The beekeepers tend to supply honey to the cooperatives only when they are unable to sell the produce in the market. Co-operative provide better price to Producers but small producers deny to sell honey to cooperative as long as they can sell in the market. Payment procedure is complicated so only semi-commercial farmer who are member and unable to sell honey completely sell their honey to co-operative. Co-operative was also involve in honey collecting and marketing. They put tag on the bottle of raw honey provided by farmer and sold as their product. Co-operative also procured honey processing machine but it isn't in run now due to insufficient voltage of locally produced electricity.
Wholesalers
Wholesaler from outside district could get chance to buy honey through contact of local level collectors in case of higher production due to favorable weather.
Retailers
Retailers are the value chain actors who buy the products from Producers and Co-operative. Local general store, agrovet are the honey retailing shop in the study area. Herbal and Ayurvedic medicinal shop of Kathmandu were also retailer of Jajarkot honey. Retailor take highest marketing margin in the market. Some retailor of Kathmandu tag their brand on raw honey and sell but most of the retailor sell untagged honey.
Consumers
Most of the consumers prefers loose pack honey from the producers they know personally. Due to low production last year, Locally produced honey fulfill market demand for only 2 month. Consumer are ready to pay higher price for locally produced honey than imported honey. Indian butter tree's honey is most preferred honey by the consumer. 15. The result showed expensive transportation fare was major marketing problem of beekeepers in the study area whereas, long market chain to consumer is the minor marketing problem spelled by beekeeper in the study area because irrespective of channel farmer get almost similar price.
Value chain map
Value chain map
Conclusion
Producers, middleman, co-operative and retailor were the major value chain actors. Honey and wax were major honeybee products. Home level processing (squeezing, filtration and packing) had been practiced in producers' level and raw honey was flowed in the entire value chain. Honey Productivity of semi-commercial farmer (3.42 kg/hive) was significantly higher than productivity of small farmer (at 10% level of significance). B:C ratio of semicommercial farmer (1.328) was greater than B;C ratio of small famer (0.903). Highest producer's share, Price spread and marketing efficiency was found in Producer-Local consumer (94.68%), Producer-Middleman-Retailor -Consumer of Kathmandu (Rs. 641.54) and Producer-Local consumer (17.68) mode of selling respectively. Abundance of Indian butter tree, premium quality honey of Indian butter tree, hardy local bee breed was the major strength of beekeeping in Jajarkot district while favorable climatic condition, government subsidy and support program, higher demand of Indian butter tree's loose pack and unprocessed honey were major opportunities of beekeeping in the Jajarkot district.
Figures and tables from the paper
| Small scale farmer | — | Semi-commercial farmer | — |
|---|---|---|---|
| Particulars | Amount | Particulars | Amount |
| Gross return per hive from honey | 1508.08 | Gross return per hive from honey | 2249.19 |
| Gross return per hive from wax | 7.26 | Gross return per hive from wax | 28.92 |
| Gross return per hive from colony sale | 0 | Gross return per hive from colony sale | 341.56 |
| Gross return | 1515.3 | Gross return | 2619.68 |
Table text extracted from the original PDF; superscript letters are shown inline. The original table image is below.
View original table image
| Particular | Small Farmer | Semi-Commercial farmer | Average |
|---|---|---|---|
| Fixed cost per hive | 10004.3 | 1108.6 | 1050.47 |
| Operating cost per hived | 595.55 | 784.37 | 689.96 |
| Marketing cost per hive | 76.88 | 78.15 | 77.51 |
| Total cost per hive | 1676.73 | 1971.18 | 1824 |
| Gross income per hive | 1515.35 | 2619.68 | 2067.5 |
| Gross margin per hive | 842.91 | 1757.15 | 1300 |
| Net margin per hive | -161.38 | 648.499 | 243.55 |
| B:C ratio | 0.903 | 1.328 | 1.116 |
Table text extracted from the original PDF; superscript letters are shown inline. The original table image is below.
View original table image
| Marketing problem | Index | Rank |
|---|---|---|
| Expensive transportation fare | 0.79 | I |
| Difficulty in market access | 0.24 | IV |
| Lack of certification and lab test | 0.523 | III |
| Lack of collection and processing center | 0.76 | II |
| Long market chain to consumer | 0.21 | V |
Table text extracted from the original PDF; superscript letters are shown inline. The original table image is below.
View original table image
References
6 in the original paper- Devkota K. Beekeeping: Sustainable Livelihoods and Agriculture production in Nepal. [Internet]. 2020 Aug 26 [cited 2024 Feb 26]. Available from: https://www.intechopen.com/chapters/70613
- FAO. [Internet]. [cited 2024 Feb 26]. Available from: http://www.fao.org/docrep/012/i0680e/i0680e.pdf
- GoN. Annual Report, 1994-1995. Kathmandu: Ministry of Agriculture and Cooperatives, Department of Agriculture; c1995.
- Krishionline. Jajarkot honey finds international market. [Internet]. 2075, Magh 24 [cited 2024 Feb 26]. Available from: https://krishionline.com/news/2019/02/07/19/24/31/197
- Kafle L, KC HB. High altitude beekeeping: Experiences from Nepal. [Internet]; c2019 [cited 2024 Feb 26]. Available from: https://www.apiservices.biz/documents/articlesen/high_altitude_beekeeping_nepal.pdf
- Prasad TN, Sudhakar P, Sreenivasulu Y, Latha P, Munaswamy V, Reddy KR, et al. Effect of nanoscale zinc oxide particles on the germination, growth and yield of peanut. Journal of plant nutrition. 2012 Apr 1;35(6):905-927.