
Research article · 2024 · Full text
International Journal of Agriculture Extension and Social DevelopmentA study on socio economic status of the farmers during COVID-19 pandemic in Cooch Behar districts of West Bengal
Volume 7(2) · Pages 449–454 · DOI: 10.33545/26180723.2024.v7.i2f.367 ↗
Research areasAgricultural Economics and PracticesCOVID-19 Pandemic Impacts
Abstract
Author-writtenThe coronavirus disease (COVID-19) has caused an unparalleled situation to arise throughout the world. This disruption has had an irredeemable impact not only on people's health but also on livelihood of the farmers, exorbitant of agricultural products, loss of employment, students' education, and the livelihood of both rural and urban communities. Although not directly, but circuitously the result of coronavirus scattering effect i.e. lockdown across the kingdom has twisted out to be a black opening for the farming community. The growers are likely to feel a dip in their returns. The state West Bengal and Cooch Behar district were selected purposively. The Cooch Behar-I and Cooch Behar-II block from selected district were selected randomly with the help of simple random sampling procedure. The Paschim Ghugumari and Hawargadi villages were selected from Cooch Behar-I block and Chattisingh Mari and Dakshin KalarayerKuthi villages were selected from Cooch Behar-II block randomly. From each village 25 numbers of respondents were selected randomly. Thus, total 100 numbers of respondents in the study area chosen as a sample for this study. The data were analyzed using range, mean, standard deviation and coeffieicnt of variation.
Summary
Source-checkedPlain-language reading of the full paper, prepared with AI and checked against the text. Each point links to the authors' own words.
Why it matters
- The COVID-19 pandemic caused significant disruptions globally, severely impacting human health and the livelihoods of both urban and rural populations, including farmers. View evidence ↗
- The agricultural sector faced disruptions in activities and supply chains primarily due to transportation issues and the lack of available migrant labor. View evidence ↗
- Reverse labor migration created workforce shortages that negatively affected the harvesting of winter crops, such as pulses and wheat, in India's north-western plains. View evidence ↗
The question
- The study aimed to assess the overall impact of the COVID-19 pandemic on the agriculture and allied sectors within West Bengal. View evidence ↗
What they did
- The Cooch Behar district in northern West Bengal was purposively selected for the study because of its vulnerability during the pandemic. View evidence ↗
- A sample of 100 respondents was selected randomly, with 25 individuals from each of four villages across the Cooch Behar-I and Cooch Behar-II blocks. View evidence ↗
- The researchers analyzed the collected data using statistical measures including mean, range, standard deviation, and coefficient of variation. View evidence ↗
What they found
- The majority of farmers (65%) were aged 30-50 years, with a mean age of 43.33 years. View evidence ↗
- Secondary education was the most common educational level among farmers (30%), while only 1% were illiterate. View evidence ↗
- Most farmers (80%) held between 1 and 3 acres of land, with a mean land holding of 1.68 acres. View evidence ↗
- Cultivation was the primary occupation for the majority of the respondents (64%). View evidence ↗
- The majority of farmers (78%) had an annual income between 13 and 31 (units not specified), with a mean income of 21.83. View evidence ↗
- Regarding material possessions (farm and home items), 90% of farmers possessed between 11 and 15 items, with a mean of 12.84. View evidence ↗
- Most farmers (69%) demonstrated a medium risk orientation (score 29-41), with a mean score of 34.55. View evidence ↗
- A high percentage of farmers (93%) had between 3 and 7 extension contacts, with a mean of 4.96. View evidence ↗
- The majority of farmers (83%) adopted mitigation strategies with a score between 47 and 57, and a mean score of 51.93. View evidence ↗
- Most farmers (73%) had a risk management capacity score between 34 and 42, with a mean score of 37.68. View evidence ↗
What it means
- The authors conclude that lockdown restrictions hindered the movement of agricultural products to consumers and that reverse migration led to a labor surplus, which reduced wages. View evidence ↗
- The authors recommend that post-pandemic research focus on improving food security and agricultural resilience through resource optimization, better post-harvest storage, and the development of disease-resistant crop varieties. View evidence ↗
Visual summary
1 visualsIllustrations explain the paper; charts are replotted from the paper's own table values.
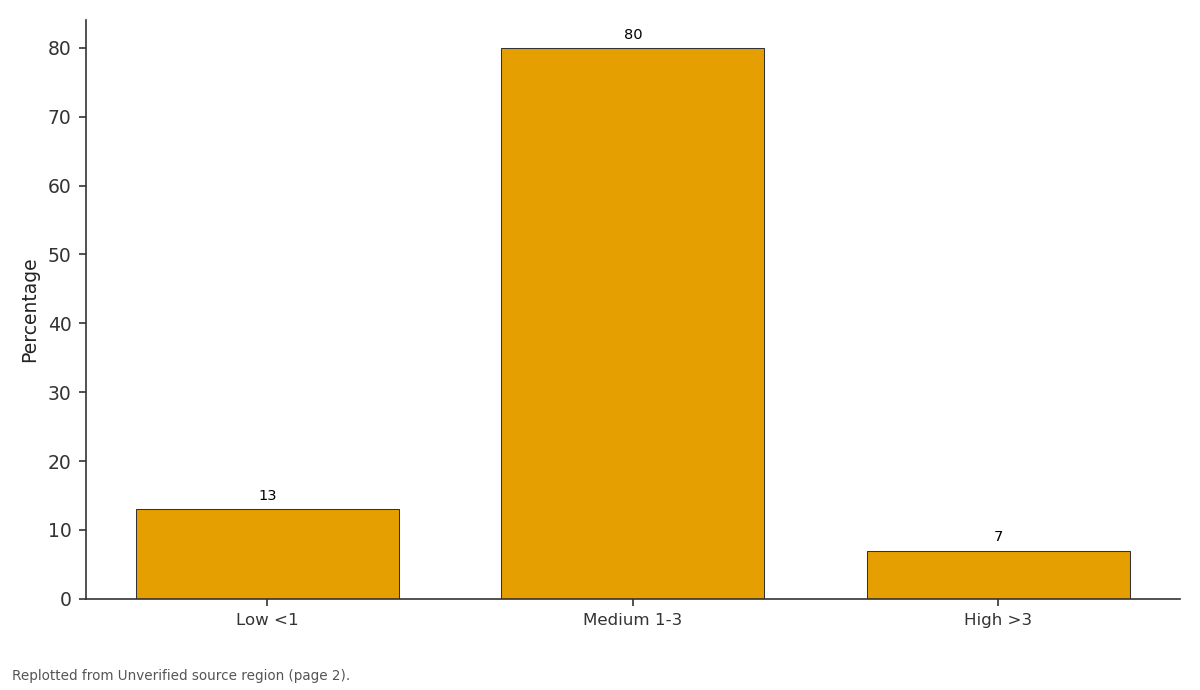
Percentage: Low <1 vs Medium 1-3 vs High >3
Replotted from a table (page 2) of the original paper. Every bar is the paper's own table value.
View source evidence ↗Introduction
At the end in December 2019, Wuhan, China, saw the appearance of a previously unnamed coronavirus that is now known as the 2019 novel coronavirus. The outbreak rapidly spread throughout several Chinese cities and beyond. On February 11, 2020, W.H.O. named the disease as Coronavirus (Wu, Y. C., Chen et al, 2020) [35] . The coronavirus disease (COVID19) has created an unusual situation globally (Alam and Khatun, 2021) [1] . In India a year ago early in the year 2020, the unusual nature of coronavirus caused most governments to implement stringent steps in their countries to restrain the virus's spread. The novel coronavirus (SARS-CoV-2) disease impacted economies throughout the world, disproportionately impacting individuals who were already susceptible to poverty and hunger (Laborde et al., 2020a; Ceballos et al., 2020) [15,4] . Pandemic (COVID19), which has caused an imbalance in every sector globally. All industrial sectors have experienced significant labor reductions and job losses as a result of social exclusion, quarantine laws, and stringent travel restrictions. The agriculture and food sector were one of the areas that was totally exposed and loss of livelihoods due to prolonged shutdowns, which had a rippling effect on the global economy (Vardhan et al., 2021, Han Q, 2020, Sridhar A. et al, 2023) [32,9,26] . Vaccination may be giving some relief but many risks are still obvious (Horner et al, 2020) [13] . India has already become a hotspot for virus, which has resulted as a decline of 23.9 percent GST during the financial year 2020-21. COVID-19 had a disastrous impact on global demography, causing more than 6 million deaths globally as of March 2022. Any interruptions in agricultural food supply will indeed result in supply and demand shocks, which will have an immediate effect on the agricultural sector of the economy with long-term economic performance and food security implications (Gregorio and Ancog, 2020, Harris J et al, [8,11,36,33] . Undoubtedly this pandemic affected the agriculture and allied system causing disruption to some activities in agriculture and supply chain because of non-availability of migrant labor and transportation problems. The reverse migration of labor led to scarcity of workforce which effected harvesting of the winter (November-March) crops like wheat and pulses adversely in the intensively cultivated north-western plains of India (Dev, 2020) [6] . According to a government audit, tones of food grains have been lost. Lockdown brought on by COVID-19 increased food loss at production, marketing, distribution and household waste level of consumption. For instance, due to lack of demand food items like milk and veggies and fruits were wasted at the farm level. People who were working in the industry, such as fishermen, seafood www.extensionjournal.com processors, fish vendors, suppliers, and transport employees, they had directly impacted by decreased customer demand, fewer supplies, and disruptions in supply chains (Purkait S et al, 2020, Minten B et al, 2020) [20,17] . Due to the dramatic increase in soybean and modest increase in maize prices, poultry feed prices have also been affected in India during pandemic (Biswal J et al, 2020, Mayur M et al, 2020) [2,16] . Threat of pandemic has restrained the door-to-door sale of liquid milk to households. This has forced the farmers to sell the entire produce to dairy cooperatives at much lower prices and private veterinary services had almost stopped due to COVID-19. This had led to the death of milch animals (Shashidhar A, 2020, Saravanan K P et al, 2021) [37,23] . Crisis of agricultural commodities have declined yet consumers are often paying more. As a productive and prevention measures the Indian government ordered on national wide lockdown affecting the agriculture-based economy. The positive growth in agriculture although attributed the bumper crop harvest coupled with relaxation in agriculture related activities during the lockdown has not witnessed a significant increase in the farm income but registered in inflation. The reverse labor migration leads to scarcity of labor which affected agricultural activities adversely. Due to the necessity to follow the social distance regulations, the Government of India sustained a social distance during the state procurement operations of the winter harvested wheat. As a result of the pandemic and the successful completion of a record breaking procurement operations, the Government of India saw an opportunity to promote three ordinance, amend the APMC (Agricultural Produce Market Committee) act to permit private trade, encourage contract farming, and minimize restrictions on the movement and sale of agricultural commodities (Cariappa A A et al., 2021) [3] . The restriction on disrupted the supply chain and hampering the uninterrupted the flow of inputs for and outputs of agricultural activities. Supplies of perishable commodities were affected more challenging the food and nutritional security of the vulnerable sections. The situation induced lockdown exacerbated food lost at production and marketing, distribution and wastage at household consumption level. The country also faces risks of the economic plunge by losing approximately 4% of its Gross Domestic Product, due to containment measures a reduction in goods importation. Keeping in view the present study has been conceptualized to assess the overall impact of COVID-19 pandemic on agriculture and allied sectors in West Bengal.
Methodology
This study dealt with the relationship between the attributes of the farmer and overall impact of COVID-19 pandemic on agriculture and allied sector in Cooch Behar district of West Bengal. The district Cooch Behar which is northern district of West Bengal selected purposively due to the vulnerability of this disadvantaged district due to COVID-19 pandemic was prevailing in this situation. Out of 12 blocks of Cooch Behar district Cooch Behar-I and Cooch Behar-II block were selected randomly with the help of simple random sampling procedure. The villages Paschim Ghugumari and Hawargadi were selected from Cooch Behar-I block and Chattisingh Mari and DakshikKalarayerKuthi villages were selected from Cooch Behar-II block randomly. From each village 25 number of respondents were selected randomly. Thus, total 100 numbers of respondents in this study area chosen as a sample for this study. The results show the majority farmers (30%) are studied the secondary education followed by higher secondary education (29%), Primary education (19%), Graduates (12%), can read and write (9%) and illiterate only 1% respectively. The mean value of the total distribution, education is 3.13 and the standard deviation of the distribution is 1.18. The coefficient of variation within the distribution, 37.69% signifies the medium consistency level of the distribution for the variable education. Distribution of farmers according to their land holding. The results show the majority farmers (80%) are holding the land between 1-3 acre followed by land holding <1 acre (13%) and >3 acre landholding (7%) respectively. The mean value of the total distribution, land holding is 1.68 and the standard deviation of the distribution is 1.04. The data in this distribution ranges from 0.5 to 5 acres. The coefficient of variation within the distribution, 61.90% signifies the medium consistency level of the distribution for the variable landholding. Distribution of farmers according to their major occupation for income. The results show the majority farmers (64%) are major occupation is cultivation followed by service (20%), business (8%), cast occupation (5%) and wage labor (3%) respectively. The mean value of the total distribution, major occupation is 3.93 and the standard deviation of the distribution is 0.86. The coefficient of variation within the distribution, 21.88% signifies the high consistency level of the distribution for the variable education. www.extensionjournal.com Distribution of farmers according to their cropping intensity. The results show the majority farmers (65%) cropping intensity is in between 112-210 followed by less than 112 cropping intensity (20%) and more than 210 cropping intensity (15%) respectively. The mean value of the total distribution, cropping intensity is 161.43 and the standard deviation of the distribution is 49.39. The cropping intensity data in this distribution ranges from 71-275.The coefficient of variation within the distribution for the variable cropping intensity is 30.59% which signifies the high consistency level of the distribution. Distribution of farmers according to their annual income.
Results and Discussion
Results and Discussion
Socio-economic characteristics of the respondents
Socio-economic characteristics of the respondents
Variables
The results show the majority farmers (78%) annual income is in between 13-31 followed by more than 31 annual income (13%) and less than 13 annual income (9%) respectively. The mean value of the total distribution, annual income is 21.83 and the standard deviation of the distribution is 9.19. The data in this distribution ranges from 10.5-55. The coefficient of variation within the distribution for the variable annual income is 42.09% which signifies the medium consistency level of the distribution. Distribution of farmers according to their material possession including both the farm and home items. The results show the majority farmers (90%) are possess the materials between 11-15 numbers followed by material count <11 (8%) and >15 materials (2%) respectively. The mean value of the total distribution is 12.84 and the standard deviation of the distribution is 1.58. The data in this distribution ranges from 9-6 number of materials. The coefficient of variation within the distribution, 12.29% signifies the high consistency level of the distribution for the variable material possession. Distribution of farmers according to their ability of taking risk. The results show the majority farmers (69%) capability to take risk is in between 29-41 followed by less than 29 risk orientation (13%) and more than 41 risk orientation (10%) respectively. The mean value of the total distribution, risk orientation is 34.55 and the standard deviation of the distribution is 5.67. The data in this distribution ranges from 14-47. The coefficient of variation within the distribution for the variable risk orientation is 16.41% which signifies the high consistency level of the distribution. Distribution of farmers according to their motivation towards income (Economic motivation). The results show the majority farmers (86%) economic motivation is in between 23-27 followed by more than 27 economic motivations (11%) and less than 23 economic motivations (3%) respectively. The mean value of the total distribution, economic motivation is 25.46 and the standard deviation of the distribution is 2.28. The data in this distribution ranges from 16-35. The coefficient of variation within the distribution for the variable economic motivation is 8.95% which signifies the high consistency level of the distribution. Distribution of farmers according to their Extension contact.
The results show the majority farmers (93%) extension contact is in between 3-7 followed by more than 7 extension contact (6%) and less than 3 extension contact (1%) respectively. The mean value of the total distribution, extension contact is 4.96 and the standard deviation of the distribution is 1.75. The data in this distribution ranges from 2-15. The coefficient of variation within the distribution for the variable extension contact is 435.28% which signifies the medium consistency level of the distribution. Distribution of farmers according to their scientific orientation. The results show the majority farmers (69%) scientifically oriented is in between 16-18 followed by less than 16 scientific orientations (31%) and more than 18 scientific orientations (0%) respectively. The mean value of the total distribution, scientific orientation is 16.79 and the standard deviation of the distribution is 1.53. The data in this distribution ranges from 14-18. The coefficient of variation within the distribution for the variable scientific orientation is 9.11% which signifies the high consistency level of the distribution. Distribution of farmers according to their social participation. The results show the majority farmers (89%) social participation is in between 4-6 followed by more than 6 social participation (11%) and less than 4 social participation (0%) respectively. The mean value of the total distribution, social participation is 5.38 and the standard deviation of the distribution is 0.94. The data in this distribution ranges from 4-8. The coefficient of variation within the distribution for the variable social participation is 17.4% which signifies the high consistency level of the distribution. Distribution of farmers according to their mass media exposure. The results show the majority farmers (94%) mass media exposure is in between 5-9 followed by less than 5 mass media exposure (4%) and more than 9 mass media exposure (2%) respectively. The mean value of the total distribution, mass media exposure is 7.09 and the standard deviation of the distribution is 1.56. The data in this distribution ranges from 1-10. The coefficient of variation within the distribution for the variable mass media exposure is 22% which signifies the high consistency level of the distribution. Distribution of farmers according to their information seeking behavior. The results show the majority farmers (85%) willing to get information is in between 18-24 followed by more than 24 information seeking behavior (8%) and less than 18 information seeking behavior (7%) respectively. The mean value of the total distribution, information seeking behavior is 20.86 and the standard deviation of the distribution is 2.64. The data in this distribution ranges from 14-33. The coefficient of variation within the distribution for the variable information seeking behavior is 12.65% which signifies the high consistency level of the distribution. Distribution of farmers according to their mitigation strategies adopted. The results show the majority farmers (83%) adopted strategies is in between 47-57 followed by less than 47 mitigation strategies adopted (9%) and more than 57 mitigation strategies adopted (8%) respectively. The mean value of the total distribution, mitigation strategies adopted is 51.93 and the standard deviation of the distribution is 5.12. The data in this distribution ranges from 45-79. The coefficient of variation within the distribution for the variable mitigation strategies adopted is 9.85% which signifies the high consistency level of the distribution. Distribution of farmers according to their resilience capacity. The results show the majority farmers (88%) resilience capacity is in between 14-16 followed by more www.extensionjournal.com than 16 resilience capacity (12%) and less than 14 resilience capacity (0%) respectively. The mean value of the total distribution, resilience capacity is 15.33 and the standard deviation of the distribution is 1.12. The data in this distribution ranges from 14-19. The coefficient of variation within the distribution for the variable resilience capacity is 7.30% which signifies the high consistency level of the distribution. Distribution of farmers according to their risk management capacity. The results show the majority farmers (73%) capability to manage the risk is in between 34-42 followed by less than 34 risk management capacity (23%) and more than 42 risk management capacity (4%) respectively. The mean value of the total distribution, risk management capacity is 37.68 and the standard deviation of the distribution is 3.77. The data in this distribution ranges from 27.48. The coefficient of variation within the distribution for the variable risk management capacity is 10% which signifies the high consistency level of the distribution.
Conclusion
The COVID-19 pandemic is a global pandemic of corona virus disease, caused by Severe Acute Respiratory Syndrome Corona Virus-2. The World Health Organization (WHO) declared the outbreak of Corona Virus as a pandemic on 11 th march 2020. The externalities of the COVID-19 eruption also affect the most resilient sector of agriculture, which is the backbone of our country.
Lockdown restrictions have made it difficult for agricultural products to get from their point of production to the final consumer. Another issue is the demand of work and reduced the wages of labor due to manpower surplus because of reverse migration brought on by the worry about viral spread, why because in researchers study area huge count of young farmers out migrants who usually go to other neighbor states to serve their livelihood. After the pandemic the field of agricultural research focused on the following areas.
Bringing resilience in agriculture and food security by developing disease resistant varieties, improving postharvest storage and optimizing resource use efficiency. One health approach in agricultural scientific research to explore the interconnections between agricultural practices, zoonotic diseases and human health. Integration of technologies like artificial intelligence (AI), machine learning, data analytics and internet of things (IOT). And greater emphasis on sustainable climate-smart agriculture.
References
36 in the original paper- Alam GM, Khatun MN. Impact of COVID-19 on vegetable supply chain and food security: empirical evidence from Bangladesh. PLoS ONE. 2021;16(3):e0248120.
- Biswal J, Vijayalakshmy K, Rahman H. Impact of COVID-19 and associated lockdown on livestock and poultry sectors in India. Vet World. 2020;13(9):19281933.
- Cariappa AA, Acharya KK, Adhav CA, Sendhil R, Ramasundaram P. Impact of COVID-19 on the Indian agricultural system: A 10-point strategy for postpandemic recovery. Outlook on Agriculture. 2021;50(1):26-33.
- Ceballos F, Kannan S, Kramer B. Impacts of a national lockdown on smallholder farmers' income and food security: empirical evidence from two states in India. World Dev. 2020;136:105069.
- Damanik IPN, Tahitu ME, Turukay M, Adam FP. Farmers empowerment level analysis in farming during the Covid-19 pandemic and its impact on farm income. IOP Conference Series: Earth and Environmental Science. 2021;883(1):012034.
- Dev SM. Addressing COVID-19 impacts on agriculture, food security, and livelihoods in India. In: COVID-19 and global food security. International Food Policy Research Institute (IFPRI); 2020. p. 33-35.
- Dev SM, Sengupta R. Covid-19: Impact on the Indian economy. Indira Gandhi Institute of Development Research, Mumbai; April 2020.
- Gregorio GB, Ancog RC. Assessing the impact of the COVID-19 pandemic on agricultural production in Southeast Asia. Toward Transform Change Agric Food Syst. 2020;17(1):1-14.
- Han Q. Introduction: The COVID-19 pandemic calls for the strengthening of scientific culture. Cultures of Science. 2020;3(4):223-226.
- Hanna R, Xu Y, Victor DG. After COVID-19, green investment must deliver jobs to get political traction. Nature. 2020;582:178-180.
- Harris J, Dpnbusch L, Pal AA, Nair RM, Ramasamy S. Food system disruption: Initial livelihood and dietary effects of COVID-19 on vegetable producers in India. Food Security. 2020;12(4):841-551.
- Hashem NM, Gonzalez-Bulnes A, Rodriguez-Morales AJ. Animal Welfare and Livestock Supply Cain Sustainability Under the Covid-19 Outbreak: An Overview. Front Vet Sci. 2020;7:582528.
- Horner R. Towards a new paradigm of global development? Beyond the limits of international development. Prog Hum Geogr. 2020;44(3):415-436.
- Joshi R, Pathak R, Rawal R, Thakur S, Negi V, Bhatt I. Challenges and opportunities under COVID-19 on rural populace in Kailash Sacred Landscape (KSL) -India. Environ Challenges. 2020;7:100497.
- Laborde D, Martin W, Vos R. Poverty and food insecurity could grow dramatically as COVID-19 spreads. International Food Policy Research Institute (IFPRI), Washington; 2020.
- Mayur M, Vispute, Ashwini R, Chaple, Mukesh T, Nampalee. Strategies to combat the impact of covid-19 on poultry industry and road ahead. Pashudhanpraharee. 2020.
- Minten B, Mohammed B, Tamru S. Emerging mediumscale tenant farming, gig economies and the COVID-19 disruption: the case of commercial vegetable clusters in Ethiopia. Eur J Dev Res. 2020;32(5):1402-1429.
- Mukharjee A, Kumar U, Shubha K, Anand S. Implications of COVID-19 on agriculture in eastern region. Food Sci Rep. 2020;1(5):63-66.
- Pu M, Zhong Y. Rising concerns over agricultural production as COVID-19 spreads: lessons from China. Global Food Secur. 2020;26:100409.
- Purkait S, Karmakar S, Chowdhuri S, Mail P, Sau SK. Impacts of novel coronavirus (COVID-19) pandemic on fisheries sector in India: A mini review. Ind J Pure App www.extensionjournal.com Biosci. 2020;8(3):487-492.
- Reardon T, Bellemare MF, Ziberman D. How COVID19 may disrupt food supply chains in developing countries. In: COVID-19 and global food security. International Food Policy Research Institute (IFPRI); 2020. p. 78-80.
- Rothan HA, Byrareddy SN. The epidemiology and pathogenesis of coronavirus disease (COVID-19) outbreak. J Autoimmun. 2020;102433.
- Saravanan K, Silambarasan P, Manivannam A, Sasikala V, Sivakumar T. Constraints and management practices of dairy farming during Covid-19 pandemic situation. Asian J Dairy Food Res. 2021;1620.
- Saravanabavan V, Vinothini C, Balaji D, Manna A, Mohan A, Rajesh A. A geo-spatial approach on COVID-19 mortality in Tamil Nadu. Int. J Geogr Geol. Environ 2022;4(1):123-131.
- Singh PK, Anvikar A, Sinha A. COVID-19 related knowledge, attitude, and practices in the Indian population: An online national cross-sectional survey. PLoS ONE. 2022;17(3):2-17.
- Sridhar A, Balakrishnan A, Jacob MM, Sillanpää M, Dayanandan N. Global impact of COVID-19 on agriculture: role of sustainable agriculture and digital farming. Environ Sci Pollut Res. 2023;30(15):4250942525.
- Supe SV. Factors related to differential degrees of rationality decision making among farmers. Ph.D. Thesis. Indian Agricultural Research Institute, New Delhi; Unpubl. 1969.
- Supe SV. Measurement techniques in Social Sciences. Agrotech Publishing Academy, Udaipur; 2007.
- Tamru S, Hirvonen K, Minten B. Impacts of the COVID-19 crisis on vegetable value chains in Ethiopia. In: IFPRI book chapters. International Food Policy Research Institute (IFPRI); 2020. p. 81-83. https://doi.org/10.2499/p15738coll2.133762_18.
- Taubenberger JK, Morens DM. The 1918 influenza pandemic and its legacy. Cold Spring Harb Perspect Med. 2020;10(10):a038695.
- Peddi Naga Harsha Vardhan, Prabhat Kumar Pal, Deepa Roy. Influence of Krishi Vigyan Kendras and Socio -Economic Characteristics towards Adoption of Climate-Resilient Technologies. Int J Environ Clim Change. 2021;11(12):38-43.
- Peddi Naga Harsha Vardhan, Prabhat Kumar Pal, Deepa Roy, Sabita Mondal. Analysis of SocioEconomic and Personal Characteristics of Adopters and Non-Adopters of Climate Resilient Technologies in North Bengal Districts of West Bengal. Int J Environ Clim Change. 2022;12(11):920-926.
- Vos R, Martin W, Laborde D. As COVID-19 spreads, no major concern for global food security yet. International Food Policy Research Institute Blog. 2020.
- Wu YC, Chen CS, Chan YJ. The outbreak of COVID19: An overview. J Chin Med Assoc. 2020;83(3):217.
- Xu Z, Elomri A, El Omri A, Kerbache L, Liu H. The compounded effects of COVID-19 pandemic and desert locust outbreak on food security and food supply chain. Sustainability. 2021;13(3):1063.
- Shashidhar A. Corona Virus impact: Dairy industry faces 30% dip in demand. Business Today. 2020;400517.
Cited by 1
From OpenAlex, OpenCitations and reference lists read by Scinovex
- Contract farming in northern district of West Bengal: A socio-economic profile study
Basu Anand, K. Pradhan, Simadri Rajasri, Chigilipalli Mounika, Suman Prosad Saha · International Journal of Agriculture Extension and Social Development · 2024
This manuscript investigates the socio-economic profile of the contract farmers in the Coochbehar district of West Bengal, emphasizing the key attributes influencing their participation in contract farming. An ex-post-facto research design was adopted, utilizing a purposive, multistage, and random sampling procedure. The Coochbehar district was selected purposively. Among the thirteen gram-panchayats, five-gram panchayats of the Coochbehar II block such as Dhang Dhingguri, Pundibari, Ambari, Marich Bari Kholta, and Patlakhawa were selected randomly. A total number of ten (10) villages were sel