
Research article · 2024 · Full text
International Journal of Agriculture Extension and Social DevelopmentComparative analysis of assets status of beneficiaries and non-beneficiaries of Pashu Bhagya scheme
Volume 7(2) · Pages 443–448 · DOI: 10.33545/26180723.2024.v7.i2f.366 ↗
Research areasSmart Systems and Machine LearningUrban Transport Systems Analysis
Abstract
Author-writtenAsset generation and its possession has direct relation to economic development of a person. Asset status is one of the prominent parameters to study the economic status of livestock rearing farmers. The study was conducted for systematic measurement and comparison of Pashu Bhagya Scheme beneficiaries and non-beneficiaries’ asset status. Research was carried out by randomly selecting 90 beneficiaries and 30 non-beneficiaries of Pashu Bhagya Scheme from Vijayapura and Indi taluks. Nearly half (48.88%) of beneficiaries and 53.33 per cent of the non-beneficiaries had medium and low level of human assets, respectively. Over half (52.22%) of beneficiaries and 46.67 per cent non-beneficiaries had medium level of physical assets. Two- third (67.78%) of beneficiaries and half of the non-beneficiaries (50%) had medium level of natural assets. Nearly half (47.77%) of the beneficiaries had medium level of social assets whereas, among the non-beneficiaries, 46.67 per cent had low level of social assets. Sixty per cent of beneficiaries and half of the non-beneficiaries (50%) had medium level of financial assets. There was a significant difference in overall and component wise asset status of beneficiaries and non-beneficiaries. In the economic sense, the beneficiaries were able to set up their own animal unit, animal shed, machineries, land, house and re-invest in additional income generating activities or units. Providing education to their off-springs, participating in extension activities, building the connections or contacts with extension personnel, local leaders and progressive farmers were the changes brought socially.
Summary
Source-checkedPlain-language reading of the full paper, prepared with AI and checked against the text. Each point links to the authors' own words.
Why it matters
- The possession and generation of assets are directly linked to a person's economic development and are key indicators for studying the economic status of farmers who rear livestock. View evidence ↗
- The Pashu Bhagya Scheme, launched on March 13, 2015, aims to improve the livelihood of livestock farmers by providing back-ended subsidies to establish animal units. View evidence ↗
- Under the Pashu Bhagya Scheme, farmers can access loans from commercial banks up to Rs.1.20 lakhs. View evidence ↗
The question
- The study aimed to assess and compare the asset status of Pashu Bhagya Scheme beneficiaries versus non-beneficiaries and determine if there were significant differences between the two groups. View evidence ↗
What they did
- The researchers used an ex-post facto design to study 120 participants across the Indi and Vijayapura taluks in Karnataka state. View evidence ↗
- Asset status was analyzed using mean and standard deviation, while differences between groups were evaluated using Z-tests and Chi-square tests. View evidence ↗
What they found
- Beneficiaries more commonly had medium assets (47.78%), whereas the majority of non-beneficiaries had low assets (60.00%). View evidence ↗
- A statistically significant difference in overall asset status was found between beneficiaries and non-beneficiaries (Chi-square = 8.93). View evidence ↗
- Z-test analysis revealed significant differences between the two groups across all asset components: human (1.69), physical (1.64), natural (1.78), social (1.84), and financial (1.95). View evidence ↗
- Component-wise analysis showed significant differences at the 5% level for human (8.54), physical (9.03), natural (5.99), social (8.12), and financial (9.19) assets. View evidence ↗
- Beneficiaries had a higher prevalence of medium-level natural assets (67.78%) compared to non-beneficiaries (50%). View evidence ↗
- While nearly half of beneficiaries (47.77%) had medium social assets, 46.67% of non-beneficiaries had low social assets. View evidence ↗
What it means
- The authors conclude that the Pashu Bhagya Scheme significantly improved the socio-economic status of its beneficiaries. View evidence ↗
- The authors recommend that extension personnel should actively disseminate information about similar schemes and engage non-beneficiaries in activities such as public talks, exhibitions, and group discussions. View evidence ↗
Visual summary
2 visualsIllustrations explain the paper; charts are replotted from the paper's own table values.
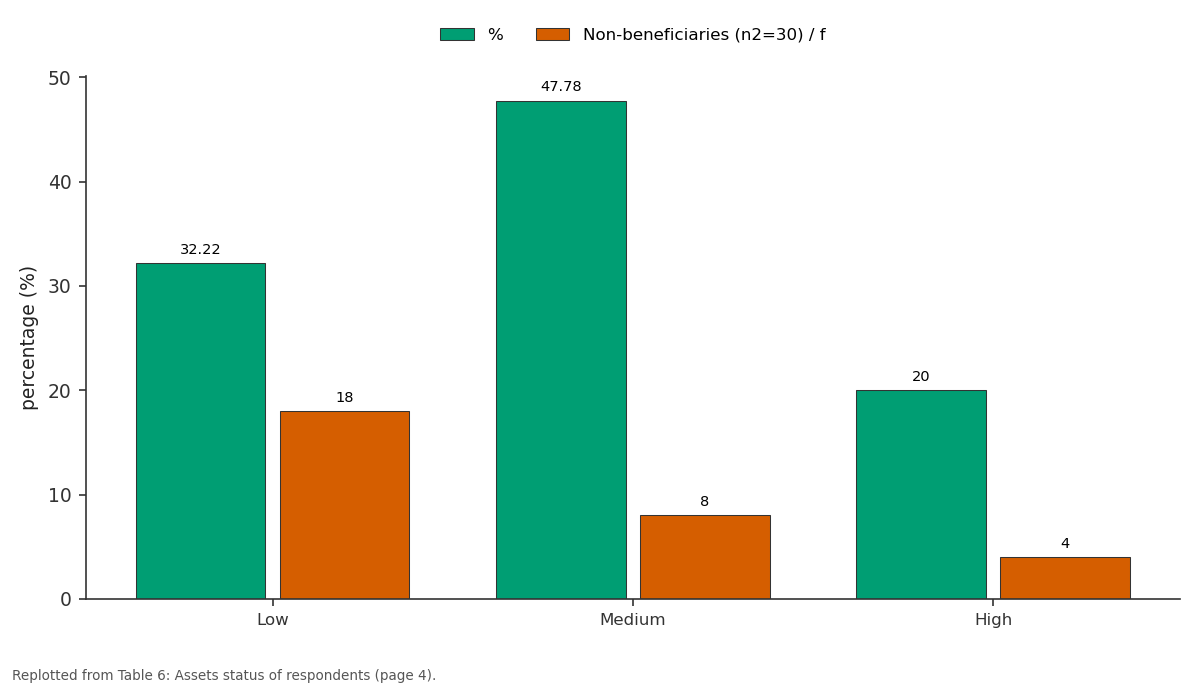
% and Non-beneficiaries (n2=30) / f: Low vs Medium vs High
Replotted from Table 6 (page 4) of the original paper. Every bar is the paper's own table value.
View source evidence ↗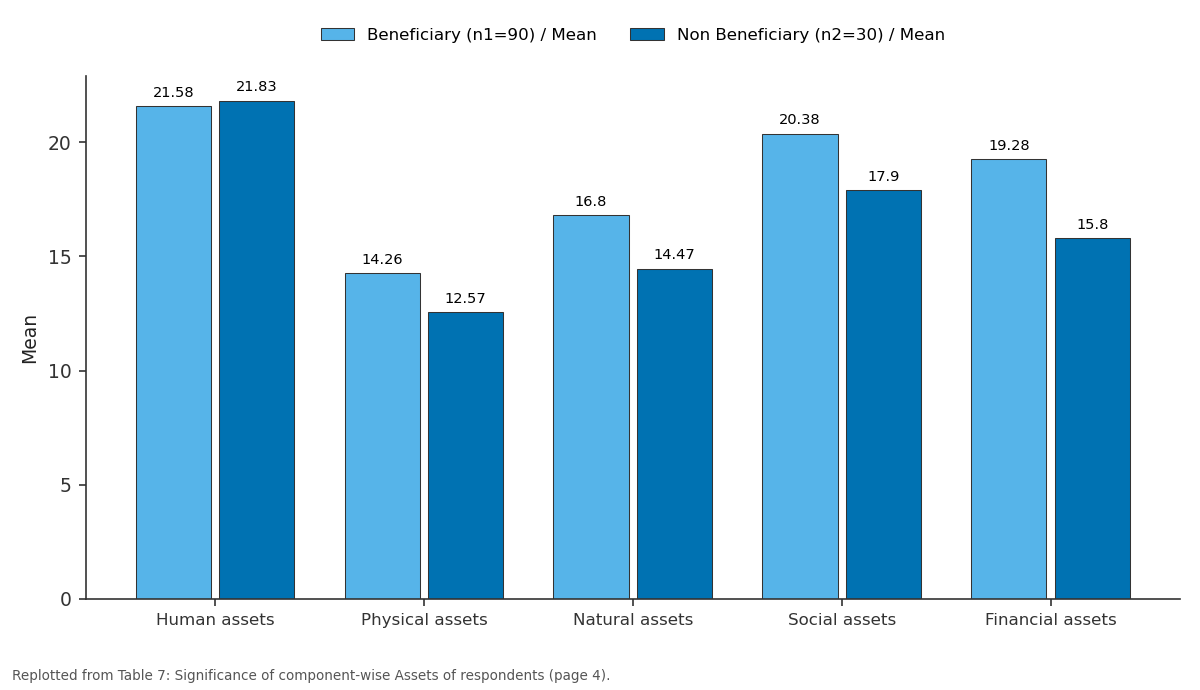
Beneficiary (n1=90) / Mean and Non Beneficiary (n2=30) / Mean: Human assets vs Physical assets vs Natural assets vs Social assets vs Financial assets
Replotted from Table 7 (page 4) of the original paper. Every bar is the paper's own table value.
View source evidence ↗Figures & tables
From the original paper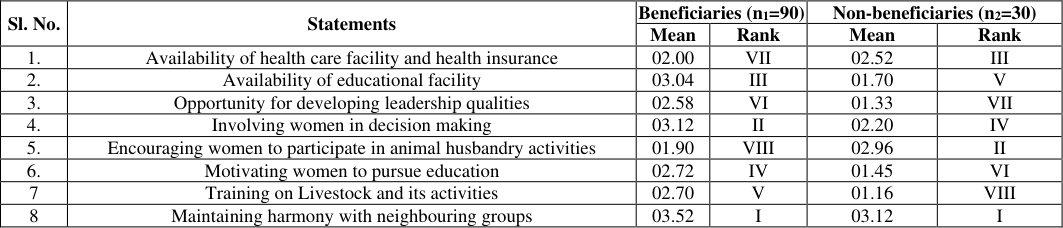 Table 1
 Table 2
 Table 3
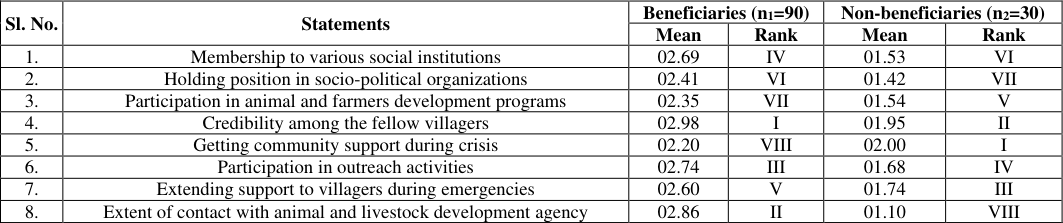 Table 4
 Table 5
 Table 6
 Table 7
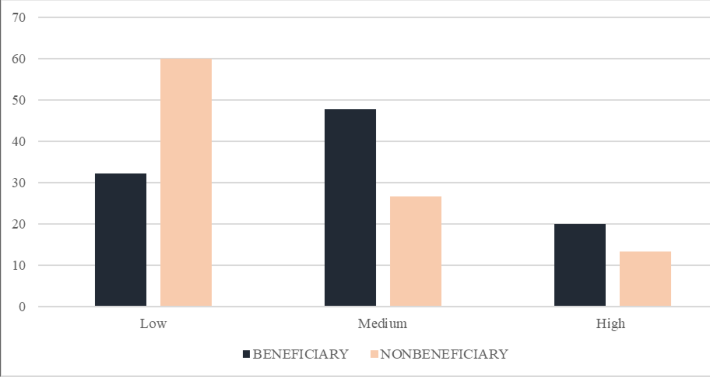 Figure 1
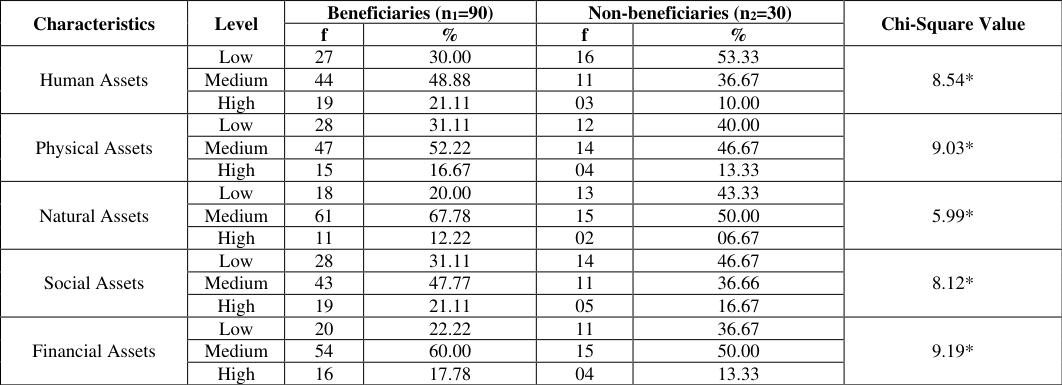 Table 8
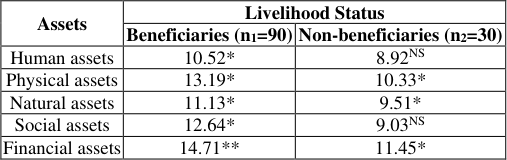 Table 9
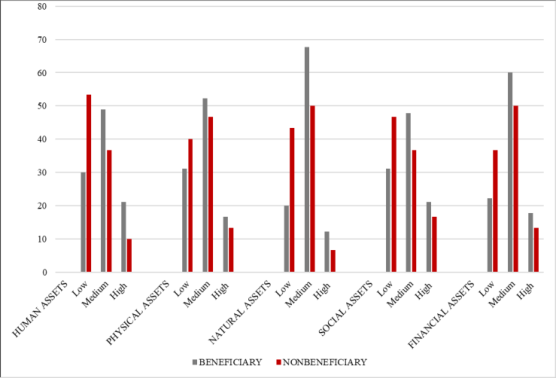 Figure 2
Introduction
Asset refers to the resource with value that a respondent owns or controls with the expectation that it will provide for future benefit. Assets include: Human assets (education, health and employment generation) refers to the skills, knowledge and experience possessed by respondent viewed in terms of their value or cost to country or community used to measure the human capital of respondents. Physical assets (house, household and farm equipment) refer to acquisition like house, household articles, entertainment materials or farm equipment are used to measure the physical capital of respondents. Natural assets (land, vegetation and livestock) refer to stock of renewable and non-renewable natural resources that are useful to respondents is referred to natural capital, including land vegetation and livestock owned by the respondents. Social assets (social contact and social status) refer to the networks of relationships among people who live and work in a particular society, enabling that society to function freely. The social contact and status of the respondent is considered to measure social capital. Financial assets (financial sources and savings) refer to any economic resource measured in terms of money or the assets needed by the individual to provide goods or services as measured in terms of money value. This was measured based on the access to financial sources and accumulation of financial capital in terms of savings. Tanvir et al. (2007) [6] reported that the participatory forest management system introduced by the FSP (Forestry Sector Project) had a definite impact on increasing the natural and social assets of forest dwellers and reducing vulnerability to their livelihood. People's livelihood and access to assets may be affected by critical trends, shocks and seasonality, over which there is limited or no control. There are five capital assets which people can build up and/or draw upon viz, human, natural, financial, social and physical. Hahn et al. (2009) [2] adopted the Sustainable Livelihoods Approach considering five household assets namely, natural, social, financial, physical and human capital. The approach enhanced the ability of households to withstand shocks such as epidemics or civil conflict and climate change. Mutenje et al. (2010) [3] confirmed that livelihood strategies used by households and individuals in rural communities are shaped by human, natural, financial, social and physical resources that can be accessed. The ability to diversify livelihood depends on assets portfolios and the economic shocks that rural households face. According to Nesar et al. (2010) [4] , the sustainable livelihood framework shows way for achieving sustainable livelihood through access to a range www.extensionjournal.com of livelihood assets viz., natural, physical, financial, human and social which are combined in the pursuit of different livelihood context and strategies. From these reviews, it is concluded that the livelihood status of the people majorly depends on their asset viz., Human, Physical, Natural, Social and Financial status. Pashu Bhagya Scheme was announced on 13 th March, 2015 with a primary objective to set up animal units with a backended subsidy and help the livestock farmers to improve their livelihood status. Further, Pashu Bhagya Scheme can avail loan upto Rs.1.20 lakhs from commercial banks. This has made a prominent mark on the asset generation and possession. It brought the significant changes in the assets of beneficiaries from owning an animal unit, land and other resources, participating in social activities, easy accessibility to agricultural products and investment in additional enterprises/ units. With this background the study was conceptualized with the following objectives 1. To assess and compare the asset status of beneficiaries and non-beneficiaries of Pashu Bhagya Scheme 2. To find out significant difference in the asset status of beneficiaries and non-beneficiaries
Methodology
Ex-post facto research design was used for the study. The study was carried in Vijayapura and Indi taluks of Vijayapura district in Karnataka state with total sample size of 120. Based on the highest number of beneficiaries and livestock population, three villages were selected from each selected taluk. fifteen beneficiaries and five nonbeneficiaries were selected from each village randomly i.e., from each taluk 45 beneficiaries and 15 non-beneficiaries. Scale developed by Bharathkumar (2018) [1] with suitable modifications was administered for the study. Mean and Standard deviation were used to analyze the asset status of respondents and the significant difference between beneficiaries and non-beneficiaries' asset status was measured using Chi-square test and Z-test.
Results and Discussion
The results of the study were as follows.
Human assets of respondents
Results in Table 1 depicts the ranking based on the mean score of human assets of beneficiaries. It is observed that maintaining harmony with neighbouring groups was recorded as first rank and Involvement of women in decision making (Rank II). Based on the mean score of human assets of non-beneficiaries, it is observed that maintaining harmony with neighboring groups was recorded as first rank and Encouraging women to participate in animal husbandry activities (Rank II).
| Sl. No. | Statements | Beneficiaries (n1=90) | — | Non-beneficiaries (n2=30) | — |
|---|---|---|---|---|---|
| Mean | Rank | Mean | Rank | ||
| 1. | Availability of health care facility and health insurance | 02.00 | VII | 02.52 | III |
| 2. | Availability of educational facility | 03.04 | III | 01.70 | V |
| 3. | Opportunity for developing leadership qualities | 02.58 | VI | 01.33 | VII |
| 4. | Involving women in decision making | 03.12 | II | 02.20 | IV |
| 5. | Encouraging women to participate in animal husbandry activities | 01.90 | VIII | 02.96 | II |
| 6. | Motivating women to pursue education | 02.72 | IV | 01.45 | VI |
| 7 | Training on Livestock and its activities | 02.70 | V | 01.16 | VIII |
| 8 | Maintaining harmony with neighbouring groups | 03.52 | I | 03.12 | I |
Table text extracted from the original PDF; superscript letters are shown inline. The original table image is below.
View original table image
Beneficiaries were able to meet the basic expenses required for education and health facilities when compared to nonbeneficiaries. The reason might be the increased income due to the scheme. Other factors like education, motivation level, leadership quality of beneficiaries might have made them to use the facilities effectively. Further, cosmopoliteness due to scheme might have brought the awareness about education and health facilities. The nonbeneficiaries' women involved more in house chores and farming activities rather than decision making and education. It might be due to their low education level, old aged/ traditional thinking and financial situations.
Physical assets of respondents
Statements in Table 2 reveal the ranking based on the mean score of physical assets of beneficiaries as owning comfortable house (Rank I) and possess vehicles like bullock cart, tractor, two wheelers etc. (Rank II). Based on the mean score of physical assets of non-beneficiaries, it is observed that they own comfortable house (Rank I) and connect roads to villages and cities (Rank II).
| Sl. No. | Statements | Beneficiaries (n1=90) | — | Non-beneficiaries (n2=30) | — |
|---|---|---|---|---|---|
| Mean | Rank | Mean | Rank | ||
| 1. | Owning a comfortable house | 03.38 | I | 02.79 | I |
| 2. | Possession of improved livestock equipment and machinery | 02.15 | V | 01.13 | V |
| 3. | Availability of transport facilities | 02.89 | III | 02.49 | III |
| 4. | Access to connecting roads to the villages and cities | 02.58 | IV | 02.50 | II |
| 5. | Possession of vehicle (bullock cart, tractors etc.) | 03.26 | II | 02.32 | IV |
Table text extracted from the original PDF; superscript letters are shown inline. The original table image is below.
View original table image
Both beneficiaries and non-beneficiaries owned comfortable house, easy transport facilities towards cities and possessed the vehicles like bullock cart, two wheelers, tractors, pump sets. Beneficiaries were only provided with the facilities like animal units (except livestock equipment and machinery), training and animal insurance.
Natural assets of respondents
Table 3 depicts the ranking based on the mean score of natural assets of beneficiaries and non-beneficiaries. It is observed that access to animal products for domestic use is assigned first rank followed by access to livestock and animal products (Rank II) in beneficiary category. Whereas, among non-beneficiaries, it is observed that access to animal products for domestic use is assigned first rank followed by access to livestock and animal products (Rank II).
| Sl. No. | Statements | Beneficiaries (n1=90) | — | Non-beneficiaries (n2=30) | — |
|---|---|---|---|---|---|
| Mean | Rank | Mean | Rank | ||
| 1. | Access to livestock and animal products | 02.98 | II | 02.00 | II |
| 2. | Access to animal products for domestic use | 03.22 | I | 02.20 | I |
| 3. | Land ownership enhances livelihood status | 02.36 | VI | 01.78 | IV |
| 4. | Livestock ownership enhances livelihood status | 02.87 | III | 01.90 | III |
| 5. | Assured facilities for increasing livestock productivity | 02.62 | V | 01.21 | VI |
| 6. | Agriculture + livestock enhances livelihood status | 02.75 | IV | 01.66 | V |
Table text extracted from the original PDF; superscript letters are shown inline. The original table image is below.
View original table image
Both beneficiaries and non-beneficiaries had access to animal products for domestic use. Majority of the beneficiaries possessed landholdings and livestock units with timely trainings on scientific management of animals, which encouraged them to practice the scientific methods of animal rearing. Further, frequent visits to department and participation in various extension activities motivated them to use innovative ideas in agriculture that resulted in better livestock productivity. The reason might be that many of the non-beneficiaries were not exposed to social activities due to their old age, traditional thinking, social status and low motivation level unlike young enthusiastic beneficiaries who had participated actively in many animal development programs and social activities.
Financial assets of respondents
In the Table 5, mean score of financial assets of beneficiaries were used for the ranking. Income from agriculture and livestock practices (Rank I), income from livestock and animal products (Rank II).
| Sl. No. | Statements | Beneficiaries (n1=90) | — | Non-beneficiaries (n2=30) | — |
|---|---|---|---|---|---|
| Mean | Rank | Mean | Rank | ||
| 1. | Investment in income generating activities | 02.80 | IV | 02.18 | IV |
| 2. | Availability of credit facilities from formal institutions for livestock activities | 02.47 | VI | 01.82 | V |
| 3. | Income from agriculture and livestock | 03.16 | I | 02.42 | II |
| 4. | Income from livestock and animal products | 03.10 | II | 02.51 | I |
| 5. | Possession of cash/jewellery | 02.50 | V | 01.58 | VII |
| 6. | Practicing animal husbandry, apiculture etc., provides supplementary income | 02.92 | III | 02.21 | III |
| 7. | Getting financial assistance from institutions during crisis | 02.33 | VII | 01.75 | VI |
Table text extracted from the original PDF; superscript letters are shown inline. The original table image is below.
View original table image
Assets status of respondents
Results in Table 6 and Figure 1 show that 47.78 per cent of beneficiaries had medium level of assets followed by low level (32.22%) and high (20.00%) level of assets. Whereas, among non-beneficiaries 60.00 per cent had low level, 26.67 per cent had medium level and 13.33 per cent had high level assets. There is significant difference between the asset status of beneficiaries and non-beneficiaries (8.93*).
| Characteristics | Level | Beneficiaries (n1=90) | — | Non-beneficiaries (n2=30) | — | Chi-square value |
|---|---|---|---|---|---|---|
| f | % | f | % | |||
| Assets | Low | 29 | 32.22 | 18 | 60.00 | 8.93* |
| Medium | 43 | 47.78 | 08 | 26.67 | ||
| High | 18 | 20.00 | 04 | 13.33 |
Table text extracted from the original PDF; superscript letters are shown inline. The original table image is below.
View original table image
Significance of component-wise Assets of respondents
From Table 7, it is known that there was also statistical difference in the means of two categories i.e., Human assets (1.69*), Physical assets (1.64*), Natural assets (1.78*), Social assets (1.84*) and Financial assets (1.95*) by employing Z-test analysis. With this, it was also found that there was significant difference in overall Assets (1.74*) of the two categories. There is a greater difference in the asset status of the beneficiaries and non-beneficiaries. With the effective use of the facilities of education, health, training, access to natural resources, involvement of family members and extension contact along with participation in extension activities made the beneficiaries to improve their physical, social and financial assets.
| Sl. No | Category | Beneficiary (n1=90) | — | Non Beneficiary (n2=30) | — | ‘Z’ value |
|---|---|---|---|---|---|---|
| Mean | SD | Mean | SD | |||
| Assets | 92.75 | 11.34 | 65.85 | 10.41 | 1.74* | |
| i | Human assets | 21.58 | 3.67 | 21.83 | 3.60 | 1.69* |
| ii | Physical assets | 14.26 | 2.55 | 12.57 | 2.84 | 1.64* |
| iii | Natural assets | 16.80 | 2.81 | 14.47 | 1.91 | 1.78* |
| iv | Social assets | 20.38 | 3.67 | 17.90 | 3.35 | 1.84* |
| v | Financial assets | 19.28 | 2.75 | 15.80 | 2.03 | 1.95* |
Table text extracted from the original PDF; superscript letters are shown inline. The original table image is below.
View original table image
Categorization of respondents based on components of Assets
From Table 8 it is evident that 48.88 per cent of beneficiaries had medium level of human assets, and among the non-beneficiaries, 53.33 per cent had low level of human assets. Over half (52.22%) of the beneficiaries and 46.67 per cent of non-beneficiaries had medium level of physical assets. Two-third (67.78%) of the beneficiaries and half of non-beneficiaries (50%) had medium level of natural assets. Nearly half (47.77%) of beneficiaries had medium level of social assets whereas, the, 46.67 per cent of nonbeneficiaries had low level. Sixty per cent of beneficiaries and half of non-beneficiaries (50%) had medium level of financial assets. www.extensionjournal.com There is significant difference between the human asset (8.54*), physical asset (9.03*), natural asset (5.99*), social asset (8.12*) and financial asset (9.19*) status of beneficiaries and non-beneficiaries at 5 per cent level of significance. With better use of education, health and training facilities, more involvement in outreach and other development activities beneficiaries were able to raise their human asset status. Objectives of the scheme was to enhance productivity and creating employment opportunities through livestock production. Hence, increased income and employment opportunities provided better physical capital among beneficiaries. Possession of landholdings, herds and access to the facilities to improve livestock productivity made majority of beneficiaries to have medium level of natural assets than non-beneficiaries. Increased extension contacts and participation paved the way to progress in the economic as well as social aspects of beneficiaries. Active involvement of beneficiaries in development programs, demonstrations, trainings, village meetings, field and home visits, mass media usage made their social capital better when compared to non-beneficiaries. Investment in subsidiary activities like backyard poultry, apiculture, sericulture, kitchen gardens along with the increased income from agriculture, livestock and animal products built the confidence of beneficiaries in getting financial assistance from institutions to sustain their financial capital. These all factors affected the livelihood status of respondents (Table 9). Whereas, non-beneficiaries lagged in terms of providing education, updating and using scientific technologies, participation in extension activities and managing the credit and animals efficiently. Hence, beneficiaries had better asset status than non-beneficiaries.
| Assets | Livelihood Status | — |
|---|---|---|
| Beneficiaries (n1=90) | Non-beneficiaries (n2=30) | |
| Human assets | 10.52* | 8.92NS |
| Physical assets | 13.19* | 10.33* |
| Natural assets | 11.13* | 9.51* |
| Social assets | 12.64* | 9.03NS |
| Financial assets | 14.71** | 11.45* |
Table text extracted from the original PDF; superscript letters are shown inline. The original table image is below.
View original table image
| Characteristics | Level | Beneficiaries (n1=90) | — | Non-beneficiaries (n2=30) | — | Chi-Square Value |
|---|---|---|---|---|---|---|
| f | % | f | % | |||
| Human Assets | Low | 27 | 30.00 | 16 | 53.33 | 8.54* |
| Medium | 44 | 48.88 | 11 | 36.67 | ||
| High | 19 | 21.11 | 03 | 10.00 | ||
| Physical Assets | Low | 28 | 31.11 | 12 | 40.00 | 9.03* |
| Medium | 47 | 52.22 | 14 | 46.67 | ||
| High | 15 | 16.67 | 04 | 13.33 | ||
| Natural Assets | Low | 18 | 20.00 | 13 | 43.33 | 5.99* |
| Medium | 61 | 67.78 | 15 | 50.00 | ||
| High | 11 | 12.22 | 02 | 06.67 | ||
| Social Assets | Low | 28 | 31.11 | 14 | 46.67 | 8.12* |
| Medium | 43 | 47.77 | 11 | 36.66 | ||
| High | 19 | 21.11 | 05 | 16.67 | ||
| Financial Assets | Low | 20 | 22.22 | 11 | 36.67 | 9.19* |
| Medium | 54 | 60.00 | 15 | 50.00 | ||
| High | 16 | 17.78 | 04 | 13.33 |
Table text extracted from the original PDF; superscript letters are shown inline. The original table image is below.
View original table image
Conclusion
Asset status decides the socio-economic reputation or growth of the person. In this study, it was found that the Pashu Bhagya Scheme brought the significant improvement in the socio-economic status of the beneficiaries. In the economic sense, the beneficiaries were able to set up their own animal unit, animal shed, machineries, land, house and re-invest in additional income generating activities or units. Providing education to their off-springs, participating in extension activities, building the connections or contacts with extension personnel, local leaders and progressive farmers were the changes brought socially. The study compared the beneficiaries and non-beneficiaries' asset status and found that beneficiaries have better status than non-beneficiaries. Hence, there is need to bring improvement in overall assets status of the both nonbeneficiaries and beneficiaries in general, non-beneficiaries in particular. Extension personnel must take responsibility in disseminating information about the similar schemes and try to involve non-beneficiaries in several extension activities like group discussion, exhibitions, public talks, campaigns and others.
Conflict of Interest
"The authors declare no potential conflicts of interest with respect to research, authorship and/or publication of this articles".
Figures and tables from the paper
| Sl. No. | Statements | Beneficiaries (n1=90) | — | Non-beneficiaries (n2=30) | — |
|---|---|---|---|---|---|
| Mean | Rank | Mean | Rank | ||
| 1. | Membership to various social institutions | 02.69 | IV | 01.53 | VI |
| 2. | Holding position in socio-political organizations | 02.41 | VI | 01.42 | VII |
| 3. | Participation in animal and farmers development programs | 02.35 | VII | 01.54 | V |
| 4. | Credibility among the fellow villagers | 02.98 | I | 01.95 | II |
| 5. | Getting community support during crisis | 02.20 | VIII | 02.00 | I |
| 6. | Participation in outreach activities | 02.74 | III | 01.68 | IV |
| 7. | Extending support to villagers during emergencies | 02.60 | V | 01.74 | III |
| 8. | Extent of contact with animal and livestock development agency | 02.86 | II | 01.10 | VIII |
Table text extracted from the original PDF; superscript letters are shown inline. The original table image is below.
View original table image
References
4 in the original paper- Hahn MB, Riederer AM, Foster SO. The livelihood vulnerability index: A pragmatic approach to assessing risks from climate variability and change: A case study in Mozambique. Glob Environ Change. 2009;30:30-33.
- Mutenje MJ, Ortmann GF, Ferrer SRD, Darroch MAG. Rural livelihood diversity to manage economic shocks: Evidence from South-East Zimbabwe. Agrekon: Agric Econ Res Poli Prac in Southern Africa. 2010;49(3):338357.
- Nesar A, Maxtroel EHA, James FM. Prawn post larvae fishing in coastal Bangladesh: Challenges for sustainable livelihoods. Mar Policy. 2010;34(1):218227.
- Tanvir A, Munir A, Babar S, Abid S. Impact of participatory forest management on vulnerability and livelihood assets of forest-dependent communities in northern Pakistan. Int J Sust Devel World Eco. 2007;14(2):211-223.