
Research article · 2024 · Full text
International Journal of Research in AgronomyStudies on climate smart IFS model for marginal farmers
Volume 7(2S) · Pages 81–84 · DOI: 10.33545/2618060x.2024.v7.i2sb.336 ↗
Research areasWireless Sensor Networks and IoTRemote Sensing and Land UseAgricultural Systems and Practices
Abstract
Author-writtenStudy on Climate smart 0.4 hectare Integrated Farming System Model was taken under All India Co-Ordinated Research Project on Farming system, College of Agriculture Rewa during 2022-23. The study reveals that 0.4 ha IFS Model with different components gave Rice Equivalent Yield 130.95 q, Gross Return Rs. 279242 and Net Profit Rs. 139352 with B:C ratio 1.99. Income flow in IFS Model was year round and varied from Rs. 3000 per month in July to Rs. 27944 per month in April. Employment generation was 526 man days which varied from 36 labours per month to 51 labour per month which is sufficient for average small family size. Greenhouse gas emission was -2436.5 kg CO2 equivalent by which IFS Model was climate smart.
Summary
Source-checkedPlain-language reading of the full paper, prepared with AI and checked against the text. Each point links to the authors' own words.
Why it matters
- The agricultural sector must balance the need for food and livelihood security with the goal of reducing its ecological and carbon footprint. View evidence ↗
- In India, agriculture is a significant contributor to climate change, accounting for 28% of total greenhouse gas emissions. View evidence ↗
- Integrated Farming Systems (IFS) are viewed as a holistic method to improve productivity and sustainability while mitigating greenhouse gas emissions. View evidence ↗
The question
- The study aimed to evaluate a 0.4-hectare climate-smart Integrated Farming System (IFS) model for marginal farmers in the Rewa region during 2022-23. View evidence ↗
What they did
- The 0.4 ha model integrated several components: crops, agri-horticulture, dairy, vermicompost, and boundary plantations. View evidence ↗
- Specific land allocations included 0.2 ha for Rice-Wheat-Green Manure, 0.06 ha each for agri-horticulture and fodder crops, and small plots for dairy and vermicompost. View evidence ↗
- Greenhouse gas emissions were measured in kg CO2 equivalent using applications developed by IIFSR, Modipuram. View evidence ↗
What they found
- The 0.4 ha IFS model achieved a total Rice Equivalent Yield (REY) of 132.95 q. View evidence ↗
- The model generated a total net profit of Rs. 139,352, with the dairy component being the largest contributor at Rs. 95,880. View evidence ↗
- The system generated a total of 526 labour man days of employment. View evidence ↗
- Gross returns totaled Rs. 279,242, with monthly income flowing year-round, ranging from Rs. 3,000 in July to Rs. 27,944 in April. View evidence ↗
- The model is considered climate-smart because its total carbon sink (9600.6 kg) exceeded its sources (7164 kg), resulting in a net emission of -2436.5 kg CO2 equivalent. View evidence ↗
What it means
- The authors conclude that this one-acre IFS model can help double the income of marginal farmers in the Rewa region. View evidence ↗
- The authors state the model is climate-smart due to its net negative carbon emission of -2436.5 kg CO2 equivalent. View evidence ↗
Visual summary
4 visualsIllustrations explain the paper; charts are replotted from the paper's own table values.
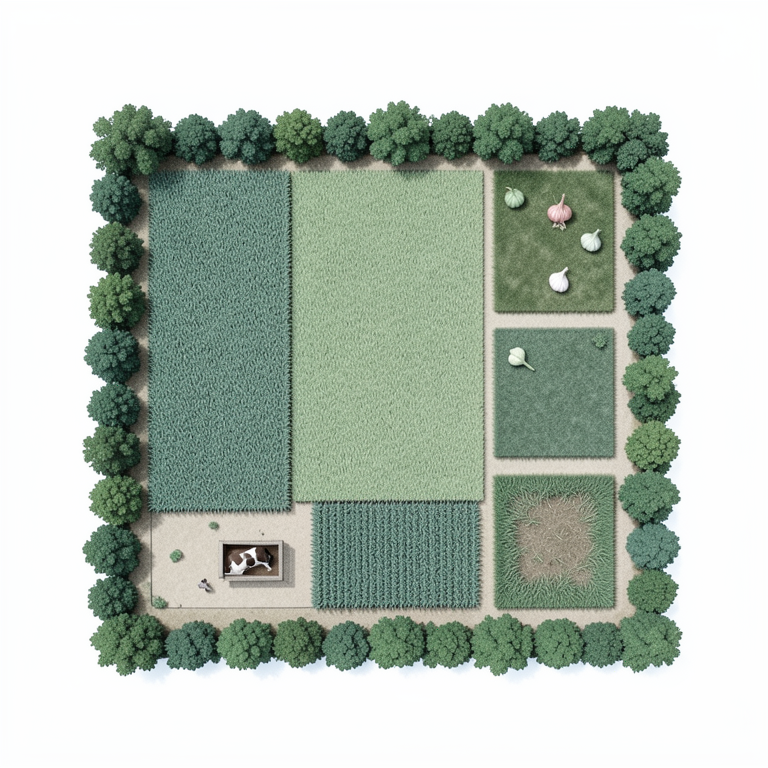
IFS Model Layout
AI-generated conceptual illustration (a small-scale integrated farming system on a 0.4 hectare plot of land). It explains the idea and does not show study data.
View source evidence ↗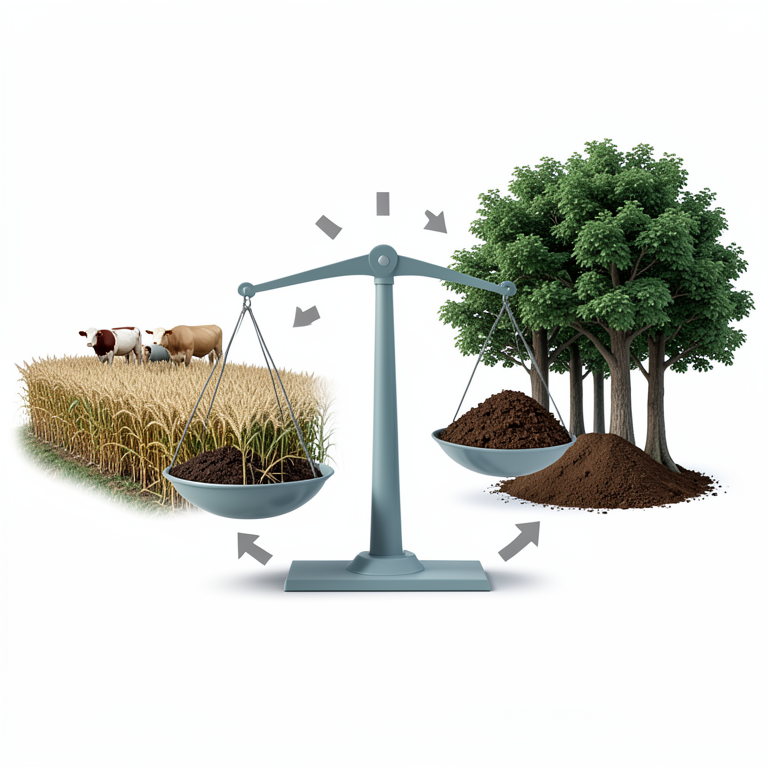
Carbon Balance Concept
AI-generated conceptual illustration (Integrated farming system with livestock, crops, and agro-forestry trees). It explains the idea and does not show study data.
View source evidence ↗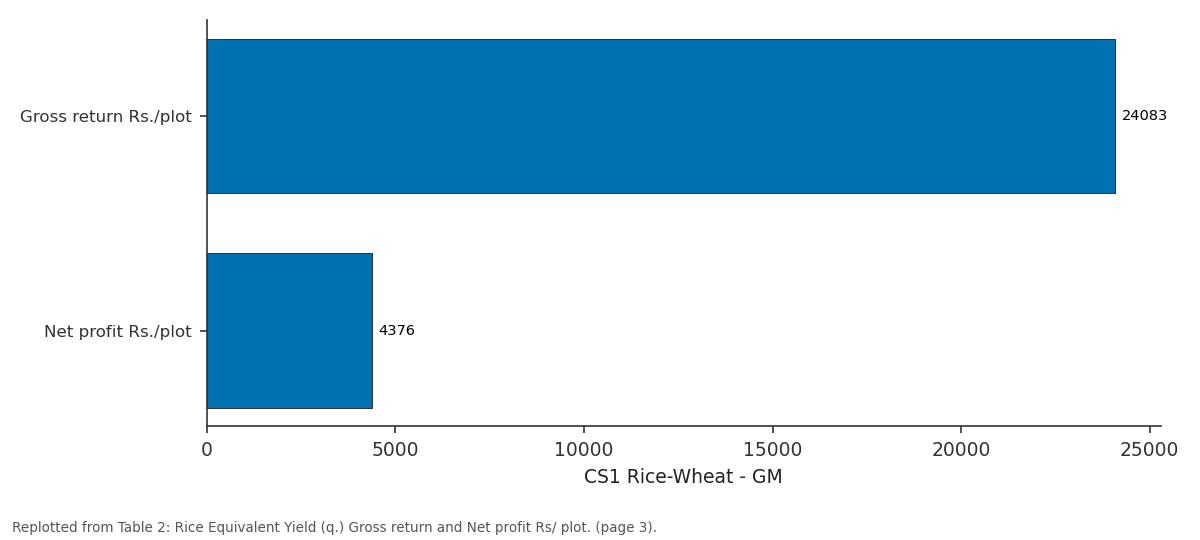
CS1 Rice-Wheat - GM: Gross return Rs./plot vs Net profit Rs./plot
Replotted from Table 2 (page 3) of the original paper. Every bar is the paper's own table value.
View source evidence ↗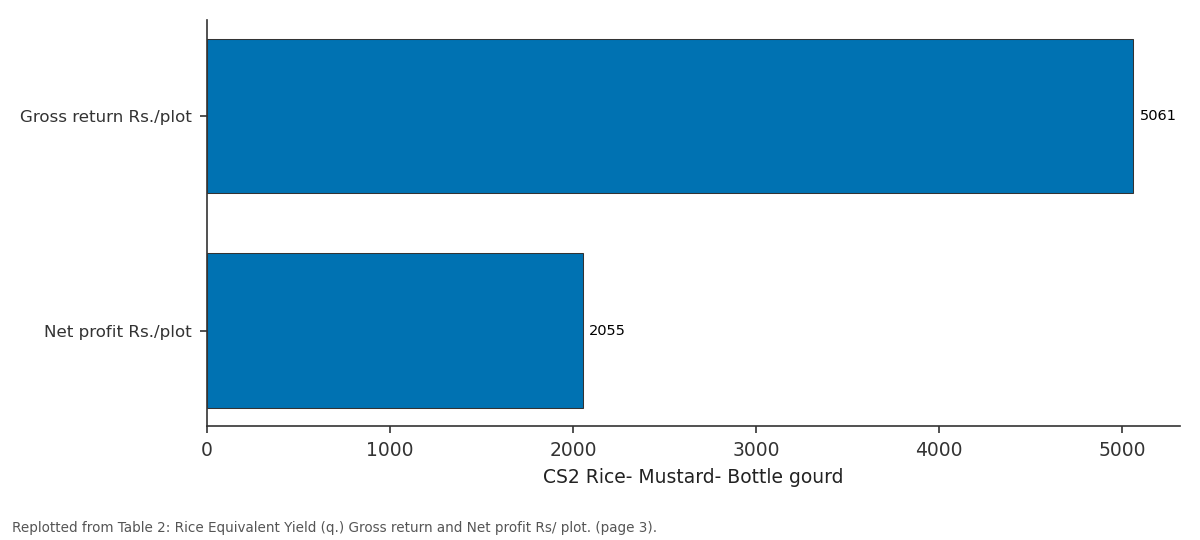
CS2 Rice- Mustard- Bottle gourd: Gross return Rs./plot vs Net profit Rs./plot
Replotted from Table 2 (page 3) of the original paper. Every bar is the paper's own table value.
View source evidence ↗Figures & tables
From the original paper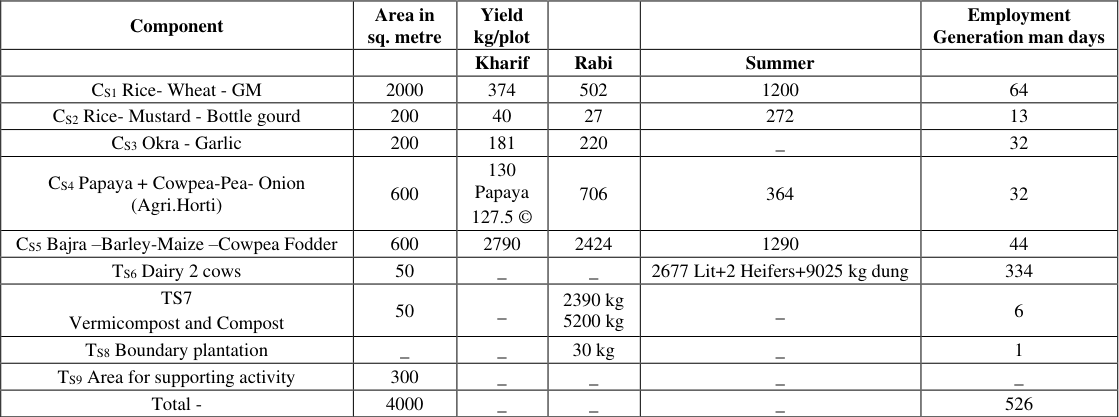 Table 1
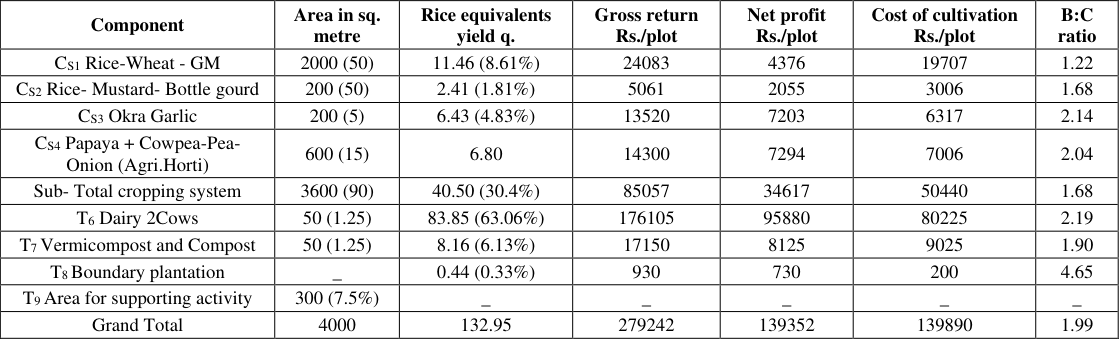 Table 2
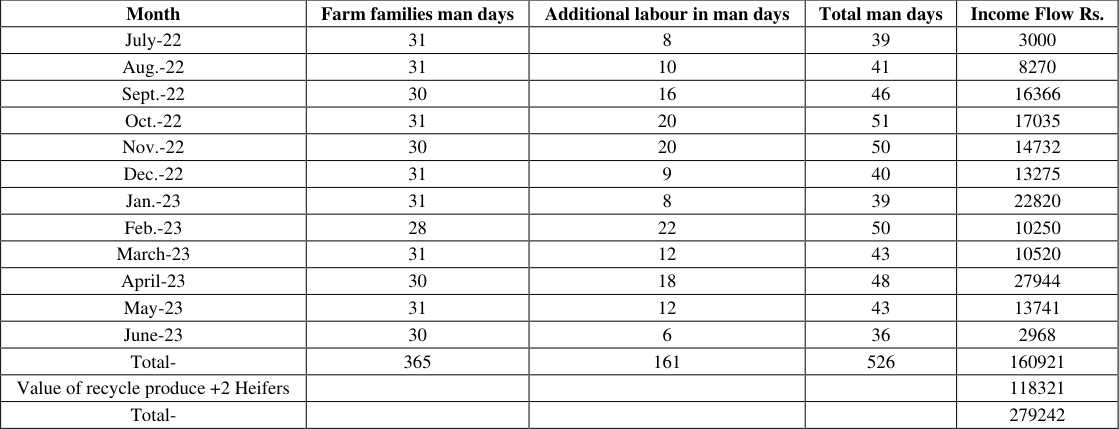 Table 3
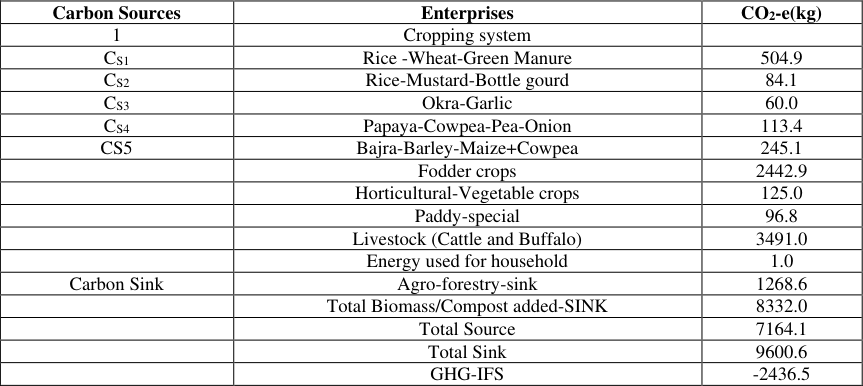 Table 4
Introduction
As the global population continues to increase the agriculture sector faces the intricate challenge of ensuring food, nutritional and livelihood security while minimizing it's ecological or carbon footprint. Agriculture contributes to greenhouse effect primarily through the emission and consumption of greenhouse gases such as CH 4 , N 2 O and CO 2 . Various Agricultural practices act as a source as well as sink of greenhouse gases. The Agriculture sector in India contributes 28 percent of the total greenhouse gas emissions. According to IPCC, the average global emissions from agriculture was only 12 percent. Emissions from agriculture are primarily due to methane emission from lowland rice (23%). Fermentation in ruminant animals and nitrous oxide from the application of manures and fertilizers. Agriculture activities such as land clearing, cultivation of crops, irrigation, animal husbandry, fisheries, aquaculture have a significant impact on emission of greenhouse gases and consequent climate change (IPCC 2014) [2] . For the mitigation of the problem of Greenhouse gases IFS have emerged as a holistic approach comprising various agricultural practices to enhanced sustainability and productivity. IFS embody a suitable blend of various farming enterprises (cropping, horticulture, livestock, poultry, fishery, forestry etc.) and the resources at the farmers disposal to cultivate them profitably. They engage effectively with the environment aiming to avoid disrupting ecological and socio-economic balances while striving to achieve national goals (Jayanthi et al., 2002) [3] . However, the emission of greenhouse gases with IFS requires meticulous scrutiny. Singh et al., (2006) [4] reported that Rice-pea-okra was the most remunerative cropping sequence with highest rice equivalent yield of 17.88ton/ha and net return than the conventional rice wheat sequence. The rice based integrated farming system compromising of crop component dairy poultry and fisheries was the most suitable and efficient farming system model which gave highest system productivity and ensured the multiple usage of water. This model generated significantly higher level of employment than rice-wheat system. Behra & Mahapatra (1999) [1] reported that Integrated Farming System increase the income and employment from a small holding by integrating various farm enterprises and recycing crop residue and by product within the farm itself. So thus, farming system approaches is one of the effective approaches to improves farmer income and livelihood by integrating different farm enterprises which must taken carefully location specific based on resources which will result into sustainable development of Rewa region. Keeping above fact in view present study has been taken.
Materials and Methods
The present field study was conducted under All India Coordinated Research Project on Integrated Farming System during the year (2022-23). The experimental field was silty clay loam in texture and neutral in reaction (soil PH 7.1). Organic carbon status was medium and experimental soil was low in available N (239.5 kg / ha), medium in available P 2 O 5 and high in available K (284.5 kg /ha). The size of IFS Model was 0.4 ha in which crop +agri-horticulture+ dairy + vermicompost+ boundary plantation was adopted. The major components in IFS Model were Rice-Wheat -Green Manure (0.2ha), Rice-Mustard-Bottle gourd (0.02 ha), Okra-Garlic (0.02 ha), Papaya +Cowpea -Vegetable pea -Onion (0.06 ha), Bajra -Barley -Maize + Cowpea fodder (0.06), Dairy 2 Cow (0.005 ha), Vermicompost + Compost (0.005 ha) and border plantation of karonda / citrus /guava. The total area under different activity was 0.37 ha while 0.03 ha area was kept for supporting activity. The study was started in the year 2020 and in the same year vermicompost structure was also prepared. Assured irrigation facilities was available for IFS Model. Greenhouse gases emission in terms of kg CO 2 equivalent was calculated by adopting apps of IIFSR, Modipuram (Meerut).
Results and Discussion
Yield: Data pertaining to yield under different components of 0.4 ha size of IFS Model has been given in Table -1. It is evident from the data that Rice -Wheat in 0.2 ha area gave 375 kg Rice and 502 kg Wheat, Rice -Mustard -Bottle gourd system in 0.02 ha gave 40 kg Rice, 27 kg Mustard and 272 kg Bottle gourd. Okra -Garlic in 0.02 ha area gave 181 kg Okra pod and 220 kg Garlic bulb. Papaya + Cowpea -Pea -Onion under Agrihorticulture system in 0.6 ha area gave 130 kg papaya, 127.5 kg Cowpea, 706 kg pea pod and 364 kg onion bulb. Bajra-Barley -Maize + Cowpea for fodder in 0.06 ha area gave total 6504 kg fodder yield. Dairy component with two cross breed Cow gave 2677 litre milk, two heifers and 9025 kg dung. Under vermicompost and Compost component in 0.005 ha area gave 2390 kg vermicompost and 5200 kg Compost. Boundary plantation of guava gave 30 kg guava fruits. (Nayak PK, 2019) [5] .
Rice Equivalent
After perusal of the result it is evident that Rice Equivalent Yield was varied from 0.44 q to 83.85 q under different component. Area alloted to Rice -Wheat cropping system under IFS model was 0.2 ha which was equal to 50 percent of the total IFS Model gave 11.46 q REY. The contribution of Rice -Wheat system in total production of IFS model was 8.61 percent. Okra -Garlic and Papaya + Cowpea -Pea -Onion under Agrihorticulture system which was taken in 0.08 ha area (20%) Contributed 19.8 q REY which was equal to 14.88% of the total production. Bajra -Barley -Maize + Cowpea fodder in 0.06 ha gave 6.8 q REY. So, thus total crop component in 0.36 ha area gave 30.4 percent of total REY while Dairy component in 1.25 percent area with two cross breed cow gave 83.85 q REY which was equal to 63.06 percent of the total produce. Vermicompost + Compost and boundary plantation gave 8.16 and 0.44 q REY respectively. Total Rice Equivalent Yield was 132.95 q from 0.4 ha IFS Model. It is too much higher than Rice -Wheat system alone. It may be due to integration of different crop component, Dairy component, Vermicompost and boundary plantation increase the yield by which REY was increased. Similar, finding was also reported by Singh et al., (2006) [4] from Uttar Pradesh.
Net Return: The data on gross and net profit along with cost of cultivation have been given in Table .2 reveals that total net profit Rs. 139352 was obtained from 0.4 ha lFS model in which dairy components contributes Rs. 95880, Vermicompost and Compost Rs.8125, Boundary plantation of guava Rs.730 while crop and agri-horticulture system in 0.36ha area gave net profit Rs. 37617. Higher income under IFS system is due to integration of different component in different ratio increase the net profit. Singh et al., (2006) [4] also reported higher net profit from IFS than Rice -Wheat cropping system. Benefit cost ratio of IFS model was 1.99 in which dairy component gave B:C ratio 2.19 and Okra-Garlic 2.14. Remaining component of IFS gave B:C ratio below 2. .1 reveals that Rice -Wheat system gave employment for labour man days. Other components gave labour employment from 6 to 44 labour man days under different cropping components. Dairy component gave maximum employment for 334 days and other vermicompost component gave 7 days employment. Labour employment was generated throughout the year which varied from 36 labour man days in June to 51 labour man days in October. Total employment was generated for 526 labour man days from 0.4 ha IFS model. Farm families get 365 days work while additional labour requirement was 161 days. Behera and Mahapatra (1999) [1] also reported that IFS increases the income and employment from small holding by integrated various. : 03 reveals that income was varied from Rs. 3000 per month in July to Rs. 27944 per month in April and total two heifers and recycled produce, costing Rs. 118321.So, thus total Rs. 279242 was produce as gross return from 0.4 ha IFS model. Singh et al., (2006) [4] also reported year round income from integration of cow & fisheries with Rice based cropping system. Behera and Maha (1999) [1] reported higher employment and profit.
Employment Generation: Employment generation under different crop component has been presented in Table
Employment Generation: Employment generation under different crop component has been presented in Table
Flow of Income: Data pertaining to flow of Income in different month of the year has been given in Table
Greenhouse Gas Emission: Greenhouse gas emission in IFS model was calculated from the apps developed by IIFSR, Modipuram which is given in Table .4 reveals that total sources of different component produces 7164kg CO 2 equivalent while total sink was 9600.6 kg. So, thus greenhouse gases emission was -2436.5kg CO 2 equivalent by which IFS model was climate smart. (Kumar S, 2012) [6] .
Figures and tables from the paper
| Component | Area in sq. metre | Yield kg/plot | — | — | Employment Generation man days |
|---|---|---|---|---|---|
| Kharif | Rabi | Summer | |||
| CS1 Rice- Wheat - GM | 2000 | 374 | 502 | 1200 | 64 |
| CS2 Rice- Mustard - Bottle gourd | 200 | 40 | 27 | 272 | 13 |
| CS3 Okra - Garlic | 200 | 181 | 220 | _ | 32 |
| CS4 Papaya + Cowpea-Pea- Onion (Agri.Horti) | 600 | 130 Papaya 127.5 © | 706 | 364 | 32 |
| CS5 Bajra –Barley-Maize –Cowpea Fodder | 600 | 2790 | 2424 | 1290 | 44 |
| TS6 Dairy 2 cows | 50 | _ | _ | 2677 Lit+2 Heifers+9025 kg dung | 334 |
| TS7 Vermicompost and Compost | 50 | _ | 2390 kg 5200 kg | _ | 6 |
| TS8 Boundary plantation | _ | _ | 30 kg | _ | 1 |
| TS9 Area for supporting activity | 300 | _ | _ | _ | _ |
| Total - | 4000 | _ | _ | _ | 526 |
Table text extracted from the original PDF; superscript letters are shown inline. The original table image is below.
View original table image
| Month | Farm families man days | Additional labour in man days | Total man days | Income Flow Rs. |
|---|---|---|---|---|
| July-22 | 31 | 8 | 39 | 3000 |
| Aug.-22 | 31 | 10 | 41 | 8270 |
| Sept.-22 | 30 | 16 | 46 | 16366 |
| Oct.-22 | 31 | 20 | 51 | 17035 |
| Nov.-22 | 30 | 20 | 50 | 14732 |
| Dec.-22 | 31 | 9 | 40 | 13275 |
| Jan.-23 | 31 | 8 | 39 | 22820 |
| Feb.-23 | 28 | 22 | 50 | 10250 |
| March-23 | 31 | 12 | 43 | 10520 |
| April-23 | 30 | 18 | 48 | 27944 |
| May-23 | 31 | 12 | 43 | 13741 |
| June-23 | 30 | 6 | 36 | 2968 |
| Total- | 365 | 161 | 526 | 160921 |
| Value of recycle produce +2 Heifers | 118321 | |||
| Total- | 279242 |
Table text extracted from the original PDF; superscript letters are shown inline. The original table image is below.
View original table image
| Carbon Sources | Enterprises | CO2-e(kg) |
|---|---|---|
| 1 | Cropping system | |
| CS1 | Rice -Wheat-Green Manure | 504.9 |
| CS2 | Rice-Mustard-Bottle gourd | 84.1 |
| CS3 | Okra-Garlic | 60.0 |
| CS4 | Papaya-Cowpea-Pea-Onion | 113.4 |
| CS5 | Bajra-Barley-Maize+Cowpea | 245.1 |
| Fodder crops | 2442.9 | |
| Horticultural-Vegetable crops | 125.0 | |
| Paddy-special | 96.8 | |
| Livestock (Cattle and Buffalo) | 3491.0 | |
| Energy used for household | 1.0 | |
| Carbon Sink | Agro-forestry-sink | 1268.6 |
| Total Biomass/Compost added-SINK | 8332.0 | |
| Total Source | 7164.1 | |
| Total Sink | 9600.6 | |
| GHG-IFS | -2436.5 |
Table text extracted from the original PDF; superscript letters are shown inline. The original table image is below.
View original table image
References
7 in the original paper- Behra UK, Mahapatra IC. Income and Employment Generation of Small and Marginal Farmers through Integrated Farming System. *Indian Journal of Agronomy. 1999;44(3):431-439.
- IPCC [Intergovernment Panel on Climate Change]. Climate Change 2014: Syntesis Report. Contribution of Working Groups I, II and III to the 5 Assessment Report of the Intergovernmental Panel on Climate Change [Core Writing Team, Pachauri R K and Meyer L A (eds.)].
- IPCC, Geneva, Switzerland. 2014, p. 151.
- Jayanthi C, Rangasamy A, Chinnusamy C. Water budgeting for components in lowland integrated farming systems. Agricultural Journal. 2002;87:411-414.
- Singh K, Bohra JS, Singh Y, Singh JP. Development of Farming System Model for the Northeastern Plain Zone of Uttar Pradesh. Indian Farming. 2006;56(7):5-11.
- Nayak PK, Nayak AK, Kumar U, Tripathi R, Panda BB, Kumar A. Crop-livestock and agroforestry-based integrated farming system: A climate smart technology for small and marginal farmers in India. Climate Resilient Agricultural Technologies for Future. Training Manual, Model Training Course on Climate Resilient Agricultural Technologies for Future, ICAR-National Rice Research Institute, Cuttack. 2019;3:78.
- Kumar S, Subash N, Shivani S, Singh SS, Dey A. Evaluation of different components under integrated farming system (IFS) for small and marginal farmers under semi-humid climatic environment. Experimental agriculture. 2012 Jul;48(3):399-413.
Cited by 1
From OpenAlex, OpenCitations and reference lists read by Scinovex
- Effect of crop and livestock based integrated farming system on livelihood improvement of marginal farmers
Jitendra Singh Baghel, Prachi Chouhan, BM Maurya · International Journal of Agriculture Extension and Social Development · 2026
The present field study was taken under all India coordinated research project on farming system, College of Agriculture, JNKVV, Rewa Madhya Pradesh during 2021-2022 to 2024-2025. On the basis of four year pooled data, it is clear that 0.4ha IFS model gave 133.76 quintal rice equivalent yield, gross return Rs 297056/-, net return Rs 116663/- & B:C ratio of 1.79. IFS dairy contributed 61.01% yield and 58.72% net profit while cropping system contributed net profit Rs 35731/- from 0.36 ha area. The present IFS model gave employment for 483 labours man-days in which farm family got 339 Man-days em