
Research article · 2024 · Full text
International Journal of Statistics and Applied MathematicsUrbanization impacts on health of metro cities in India
Volume 9(1S) · Pages 380–386 · DOI: 10.22271/maths.2024.v9.i1sf.1619 ↗
Research areasGlobal Public Health Policies and EpidemiologyCOVID-19 epidemiological studiesCOVID-19 impact on air quality
Abstract
Author-writtenIndia is consistently urbanizing along with the other developing countries. The metropolitan cities in India are witnessing sustained population growth together with urbanization and industrialization. Large cities, in particular, are horizontal to suffer from health, environmental and poor living conditions of slums. The direct effect of poor living conditions is poor health. This paper provides a critical outlook on the factors affecting the health and other living conditions of slum population in metro cities by considering the data of NFHS-3 and Census of India, furthermore the study analyze the factors through logistic regression analysis and computing composite index score and ranks for Health, Slum Living Performance indicators in the metropolitan cities of India.
Summary
Source-checkedPlain-language reading of the full paper, prepared with AI and checked against the text. Each point links to the authors' own words.
Why it matters
- India is experiencing consistent urbanization, with the urbanization level rising from 27.8% in 2001 to 31.1% in 2011. View evidence ↗
- Slum dwellers in Indian cities face constant health risks due to unhygienic environments and inadequate basic services like sanitation and water supply. View evidence ↗
- Large metropolitan cities are prone to poor living conditions in slums, which directly results in poor health outcomes. View evidence ↗
The question
- The study aims to analyze the factors that affect the health and living conditions of the slum population in Indian metropolitan cities. View evidence ↗
What they did
- The researchers used logistic regression analysis and computed composite index scores and ranks to evaluate health and slum living performance. View evidence ↗
- The analysis was based on data obtained from the National Family Health Survey-3 (NFHS-3) and the Census of India. View evidence ↗
What they found
- Chennai achieved the highest child immunization coverage (77.7%) among the four cities, followed by Mumbai (69.8%) and Kolkata (67.6%). View evidence ↗
- Only Chennai (18.3) and Mumbai (30.3) met the Infant Mortality Rate (IMR) goal of 30 per thousand, while Delhi (40.6) and Kolkata (41.3) remained higher. View evidence ↗
- Mumbai slums showed the best performance across all living condition indicators, including 100% access to improved drinking water sources. View evidence ↗
- Education significantly increases the likelihood of migration, with those having primary education being 2.64 times more likely to migrate than those with no education. View evidence ↗
- Migrants employed in services are 4.95 times more likely to migrate to cities compared to daily wage workers. View evidence ↗
- Wealth increases migration probability relative to the poorest group, with 'poorer' individuals being 2.99 times and 'richest' individuals 1.53 times more likely to migrate. View evidence ↗
What it means
- The authors recommend encouraging rural progress and reducing rural poverty to minimize the pressure of migration on cities. View evidence ↗
- The authors conclude that the government must provide basic facilities, including sanitation and clean water, to all slum households to improve living conditions. View evidence ↗
Visual summary
2 visualsIllustrations explain the paper; charts are replotted from the paper's own table values.
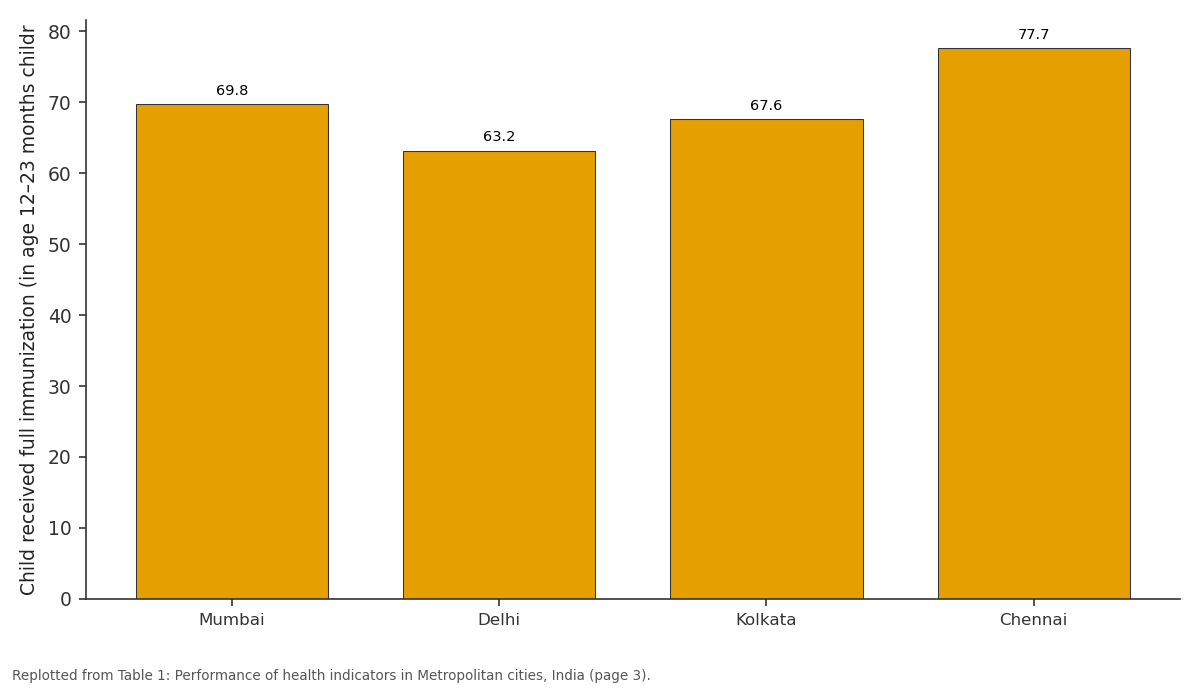
Child received full immunization (in age...: Mumbai vs Delhi vs Kolkata vs Chennai
Replotted from Table 1 (page 3) of the original paper. Every bar is the paper's own table value.
View source evidence ↗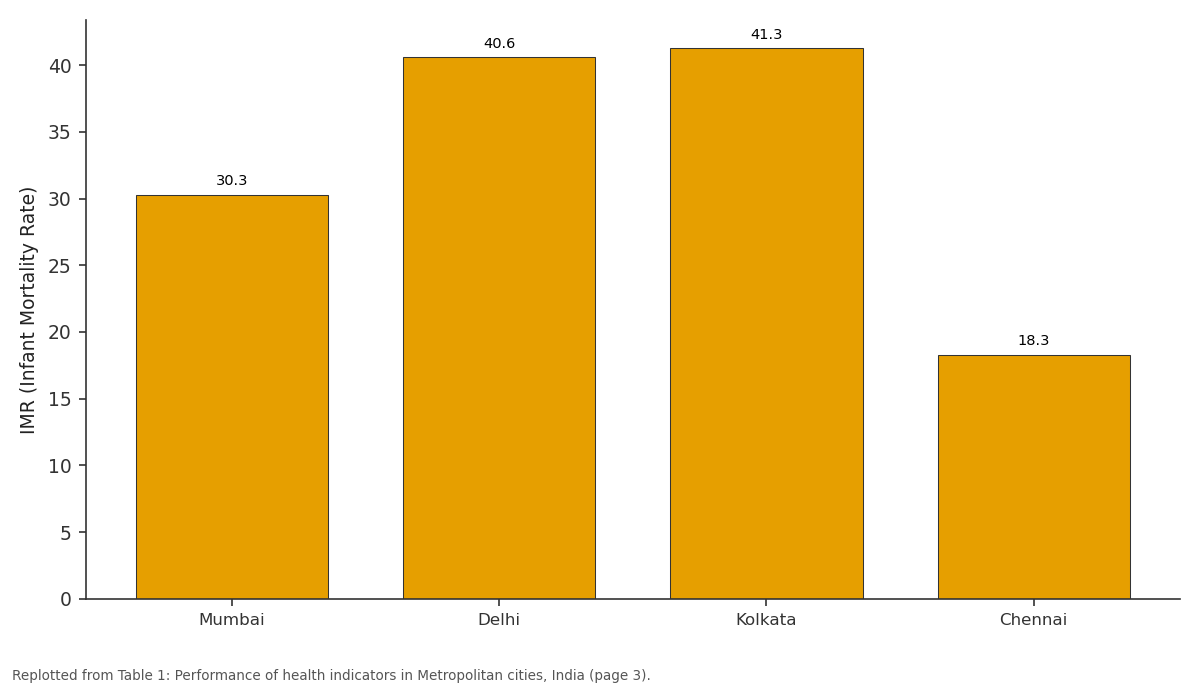
IMR (Infant Mortality Rate): Mumbai vs Delhi vs Kolkata vs Chennai
Replotted from Table 1 (page 3) of the original paper. Every bar is the paper's own table value.
View source evidence ↗Figures & tables
From the original paper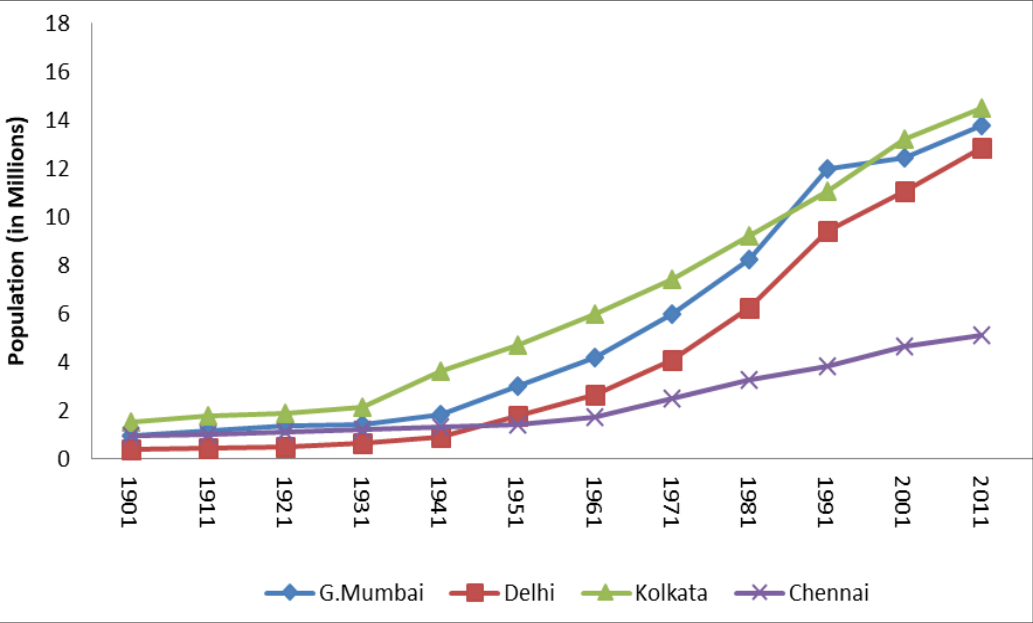 Figure 1
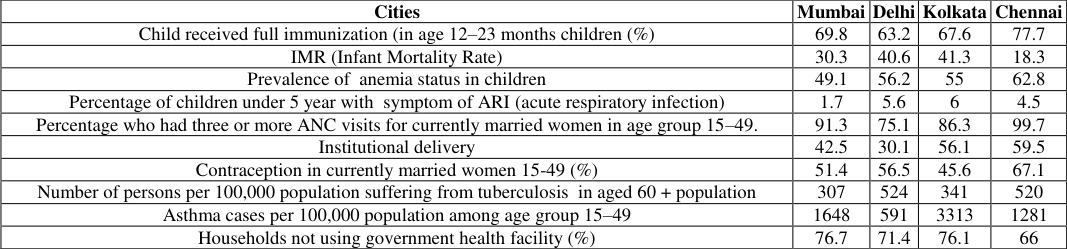 Table 1
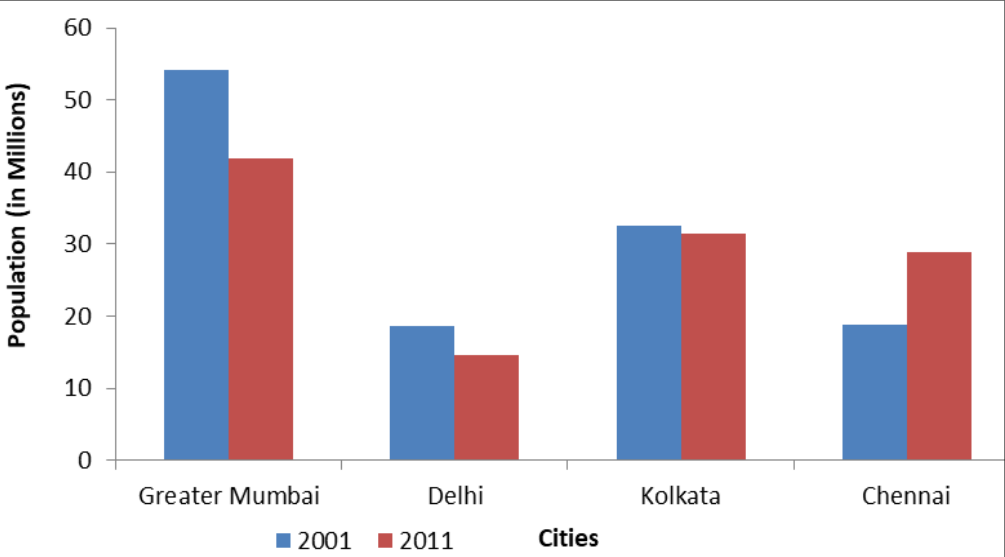 Figure 2
 Table 2
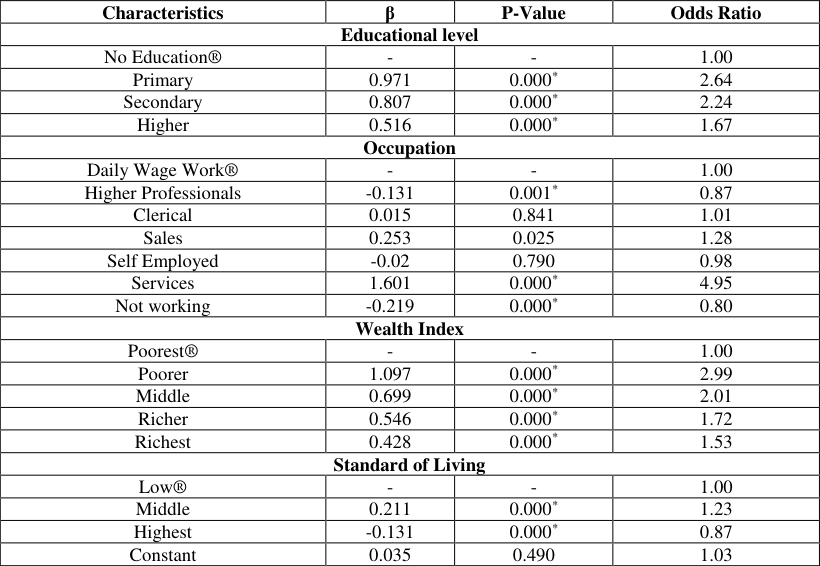 Table 3
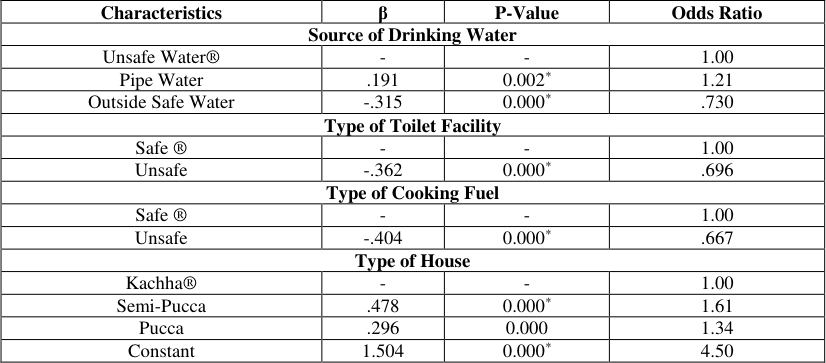 Table 4
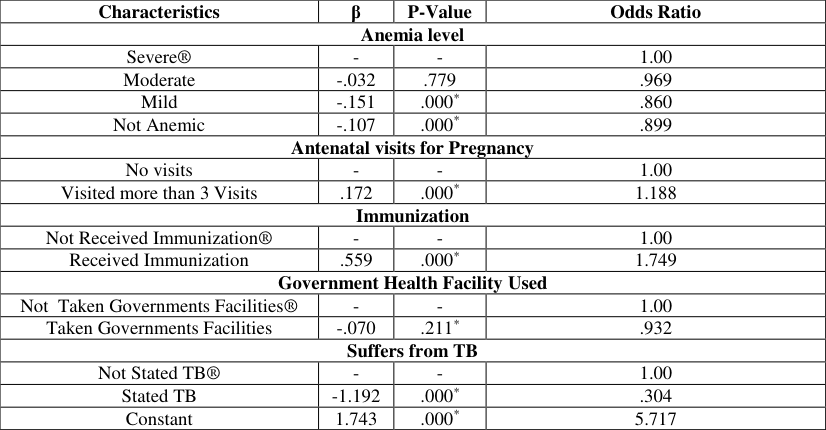 Table 5
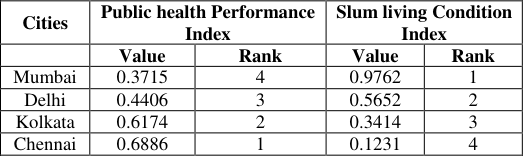 Table 6
Introduction
India is urbanizing. Level of urbanization here has increased from 27.8 per cent in 2001 to 31.1 percent in 2011 (Census of India 2001; 2011) [10,11]. As per the United Nations projections, if urbanization continues at the present rate, then India's urban population is likely to set double and will reach 600 million by 2030, a value twice as high as its present urban population. For any nation, cities play a vital role in the development of its sound economy. India is not an exception. The Indian cities attracted migrants during their growth, as a result the rural-tourban migration phenomenon significantly increased. Over the last few years, the cities are attempting to integrate themselves with globalization, as they cannot afford to remain unresponsive to the global requirements. The government is however, aware of the grim situation and is trying its level best to promote the sustainability in all the cities but the enormous growth of slum population in urban areas due to migration and other factors, the problems of health and living environment of urban population has become more ironical in Indian metropolitan cities. Rapid urbanization along with slum population growth especially in the developing countries like India are crucial issues and these are characterized by unplanned and uncontrolled growth leading to urban sprawl. There are different reasons in growth of urban population; the major contributory factor is migration apart from rate of natural increase. The metropolitan cities in India are witnessing sustained population growth together with urbanization and industrialization. Cities have always been the epicenter of economic growth. The economic vibrancy of these large urban centers offers diverse employment opportunities and means of livelihood. Migration, urbanization and mushrooming growth of slum are direct manifestations of the process of economic development, particularly in the contemporary phase of globalization. Migration from rural to urban areas the people are on constant move from backward areas to potential areas for better employment opportunities and better amenities and facilities (Rasool et al. 2012; Dyson 2011; Parkins 2010) [6,1,4] . The other reasons may be reclassification of villages and towns. The number of towns have increased from 4,378 in 2001 to 7,935 in 2011 while the number of metropolitan cities having million plus population has increased from 35 in 2001 to 53 in 2011 (Census of India, 2011; 2001) [10] .
In spite of its much constructive aspects, migration to urbanization is not without its harms. Large cities, in particular, are horizontal to suffer from health, environmental and poor living conditions of slums. The direct effect of poor living conditions is poor health. The health conditions have become uncertain in majority of the cities because uncontrolled urbanization in India has lead to various problems like contamination of environmental conditions in urban centers. The heavy influx of migration from rural areas to urban places has contributed to urban growth which in turn has resulted in the development of squatter settlements and slums especially in metros and in large cities. The slum has now become an inescapable, vulnerable and blighted part of the Indian urban landscape. The slum dwellers are at constant risk of health hazards due to inadequate services particularly water supply, sanitation, clogged drainage, health care facilities; unhealthy site location; living and working in unhygienic environmental conditions, and are bearing the brunt of increasing urban environmental problems (Karan 2003; Parkinson 2007) [2,5] . This paper provides a critical outlook on the factors affecting the health and other living conditions of slum population like immunization, anemia status, ANC visits, drinking water facilities etc., by considering the data of NFHS-3, Census of India, and analyzing through logistic regression analysis and calculating composite index score and ranks for Health, Slum Living Performance indicators in the metropolitan cities of India.
Trends and Levels of Urban and Slum Population
Urbanization has become a major issue in 21st century and growth of million plus cities is the major concern. Population explosion is one of the most threatening issues which contemporary large cities are facing and are resulting in large scale rural-urban migration and rapid urbanization. In this context, census data from 1901 to 2011 and existing literature has been used to concentrate on some aspects of population growth in the metropolitan cities of India. Kolkata, Mumbai and Chennai were developed to facilitate trade of raw material for the imperial power, whereas Delhi functioned as an administrative city. Kolkata was only million plus city in India in 1901. Mumbai was added to this category in 1911 and the number of such cities remained constant at two till 1941. During this period urban population growth was very slow. In the beginning of the century Kolkata and Mumbai recorded slow growth rate of less than 25 per cent but after 1931 both have recorded high growth rate.
Source: Census of India
Source: Census of India
Source: Census of India
Source: Census of India
Performance of health and household living conditions of slums in metropolitan cities, India
Health plays vital role in standard development of the country's population. Table 1 examines the performance of health situation in metropolitan cities by considering different health conditions for understanding the status. Immunization includes children of age group 12-24 months who have received all the basic vaccination (BCG, Polio, DPT etc). The highest immunization coverage is achieved in the slum areas of Chennai followed by Mumbai and Kolkata. Infant Mortality rate is the sensitive indicator often used to access the child health status of a population. The estimated level of IMR shows that only Chennai and Mumbai have achieved the goal of IMR 30 per thousand while other two cities still have high IMR. Anemia is major nutritional deficiency among India children in India. Findings in the table 5.1 suggest that 50% of the children in all four metropolitan cities are Anemic with high level in Chennai and low level Mumbai. Acute respiratory infection (ARI) is one of the leading causes of childhood morbidity and mortality throughout the world and children in Indian cities are no exception to that. Kolkata and Delhi are having more than 5% of the children who have been reported with ARI. Antenatal care (ANC) or pregnancy-related health care is a critical requirement for women's health during pregnancy to reduce infant and maternal mortality. More than 90% women in Chennai and Mumbai received three ANCs however; Delhi and Kolkata are lagging behind. The performances in terms of institutional delivery coverage in public health facilities are poor in Delhi and Mumbai when compared with the other two cities. Contraception is the major determinant of many health indicators associated with reproductive process and unwanted fertility however none of the city has achieved more than 70% use of modern contraception. The prevalence of tuberculosis among the population aged 60 and above is high in the Delhi and Chennai, while the prevalence of asthma is high in Mumbai. 70% of the metropolitan cities are not utilising Government health facility because of poor quality of care. Living conditions in the absence of basic civic amenities such as safe and adequate water supply, sewerage and sanitation amenities have been precarious and miserable for the health (Marina, 1999) [3] . Analyses of data with reference to housing, sanitation, electricity, cooking fuel and number of persons sleeping per room are included to assess present living conditions of slums in the metropolitan cities. Mumbai slums living conditions show better performance in terms of all the factors considered for the index whereas remaining cities have to come up with the provision of basic amenities (See Table 2).
| Characteristics | β | P-Value | Odds Ratio |
|---|---|---|---|
| Anemia level | |||
| Severe® | - | - | 1.00 |
| Moderate | -.032 | .779 | .969 |
| Mild | -.151 | .000* | .860 |
| Not Anemic | -.107 | .000* | .899 |
| Antenatal visits for Pregnancy | |||
| No visits | - | - | 1.00 |
| Visited more than 3 Visits | .172 | .000* | 1.188 |
| Immunization | |||
| Not Received Immunization® | - | - | 1.00 |
| Received Immunization | .559 | .000* | 1.749 |
| Government Health Facility Used | |||
| Not Taken Governments Facilities® | - | - | 1.00 |
| Taken Governments Facilities | -.070 | .211* | .932 |
| Suffers from TB | |||
| Not Stated TB® | - | - | 1.00 |
| Stated TB | -1.192 | .000* | .304 |
| Constant | 1.743 | .000* | 5.717 |
Table text extracted from the original PDF; superscript letters are shown inline. The original table image is below.
View original table image
| Cities | Mumbai | Delhi | Kolkata | Chennai |
|---|---|---|---|---|
| Child received full immunization (in age 12–23 months children (%) | 69.8 | 63.2 | 67.6 | 77.7 |
| IMR (Infant Mortality Rate) | 30.3 | 40.6 | 41.3 | 18.3 |
| Prevalence of anemia status in children | 49.1 | 56.2 | 55 | 62.8 |
| Percentage of children under 5 year with symptom of ARI (acute respiratory infection) | 1.7 | 5.6 | 6 | 4.5 |
| Percentage who had three or more ANC visits for currently married women in age group 15–49. | 91.3 | 75.1 | 86.3 | 99.7 |
| Institutional delivery | 42.5 | 30.1 | 56.1 | 59.5 |
| Contraception in currently married women 15-49 (%) | 51.4 | 56.5 | 45.6 | 67.1 |
| Number of persons per 100,000 population suffering from tuberculosis in aged 60 + population | 307 | 524 | 341 | 520 |
| Asthma cases per 100,000 population among age group 15–49 | 1648 | 591 | 3313 | 1281 |
| Households not using government health facility (%) | 76.7 | 71.4 | 76.1 | 66 |
Table text extracted from the original PDF; superscript letters are shown inline. The original table image is below.
View original table image
Binary Logistic Regression Analysis: Binary logistic regression is the method of choice if your dependent variable is binary (dichotomous) and you wish to explore the relative influence of continuous and/or categorical independent variables on your dependent variable, and to assess interaction effects between the independent variables. To understand the influence of various sustainable, health and basic facilities factors on migrants in cities. The binary logistic regression has been carried out to comprehend these aspects. The response for the dependent variable (y) is binary i.e., migrants and non-migrants. The model can be written as fallows.
Where, p(y) is the probability of being migrated and {1-p(y)} is the probability of not being migrated.
Here X1, X1, X1 ……. , Xk denotes the independent variables. β0 is the intercept and β1, β2, ………., βk are the regression coefficients.
The results of logistic regression estimates for the effect on migrants with sustainable living have been shown in the Table 3. Educational level plays a significant role in migration to cities. The significant results revels that educational level is the primary motive for risk of migration. The regression coefficients for primary, secondary and higher educational levels are 0.97, 0.80 and 0.516 respectively. The corresponding odds ratios are 2.64, 2.24 and 1.67, which implies that the migrants having primary, secondary and higher educational levels are more likely to migrate to cities than not having education. The results of logistic regression estimates for the effect on migrants with basic facilities factors have been shown in the Table 4. The basic facilities are the fundamental issue for survival in cities. Source of drinking water is the main factor among the basic facility factor for living. The regression coefficients of the pipe water and outside safe water are 0.919 & -0.315 which are significant. The subsequent odds ratios are 1.21 and 0.730 which reflects that the effect on migration is more likely to pipe water and less likely to outside safe water than unsafe water. Sanitation facility is an essential element for sustainability. The regression co-efficients of the unsafe toilet facility is -0.362 which is significant and corresponding odds ratio is 0.696 which shows less likely to safe sanitation. Apart from sanitation cooking fuel and type of the house is also a prominent factor for living. The beta co-efficients for unsafe cooking fuel, semi-pucca and pucca houses are -0.404, 0.478 and 0.296 and are statistically significant. The subsequent odds ratio for unsafe cooking fuel is less likely to opt than the safe one. In case of type of houses the both, semipucca and pucca houses odds ratios is more likely to decide on for migration than kachha houses. The results of logistic regression estimates for the effect on migrants with Health Factors have been shown in the Table 5 Urban health is very important factor for migration to cities. The regression co-efficients of the migrants with anaemia level moderate, mild, not anaemic are -0.032, -0.151 and -0.107 correspondingly which are negative. This implies that anaemia level with moderate, mild and not anaemic is less likely to migrate to cities with 0.96, 0.86 and 0.89 respectively. The regression co-efficients of the migrants who visited more than three antenatal visits for pregnancy is 0.172, which is positive and significant. This explains that the risk of migration is 1.18 times more likely than the non-visits.
| Characteristics | β | P-Value | Odds Ratio |
|---|---|---|---|
| Source of Drinking Water | |||
| Unsafe Water® | - | - | 1.00 |
| Pipe Water | .191 | 0.002* | 1.21 |
| Outside Safe Water | -.315 | 0.000* | .730 |
| Type of Toilet Facility | |||
| Safe ® | - | - | 1.00 |
| Unsafe | -.362 | 0.000* | .696 |
| Type of Cooking Fuel | |||
| Safe ® | - | - | 1.00 |
| Unsafe | -.404 | 0.000* | .667 |
| Type of House | |||
| Kachha® | - | - | 1.00 |
| Semi-Pucca | .478 | 0.000* | 1.61 |
| Pucca | .296 | 0.000 | 1.34 |
| Constant | 1.504 | 0.000* | 4.50 |
Table text extracted from the original PDF; superscript letters are shown inline. The original table image is below.
View original table image
| Characteristics | β | P-Value | Odds Ratio |
|---|---|---|---|
| Educational level | |||
| No Education® | - | - | 1.00 |
| Primary | 0.971 | 0.000* | 2.64 |
| Secondary | 0.807 | 0.000* | 2.24 |
| Higher | 0.516 | 0.000* | 1.67 |
| Occupation | |||
| Daily Wage Work® | - | - | 1.00 |
| Higher Professionals | -0.131 | 0.001* | 0.87 |
| Clerical | 0.015 | 0.841 | 1.01 |
| Sales | 0.253 | 0.025 | 1.28 |
| Self Employed | -0.02 | 0.790 | 0.98 |
| Services | 1.601 | 0.000* | 4.95 |
| Not working | -0.219 | 0.000* | 0.80 |
| Wealth Index | |||
| Poorest® | - | - | 1.00 |
| Poorer | 1.097 | 0.000* | 2.99 |
| Middle | 0.699 | 0.000* | 2.01 |
| Richer | 0.546 | 0.000* | 1.72 |
| Richest | 0.428 | 0.000* | 1.53 |
| Standard of Living | |||
| Low® | - | - | 1.00 |
| Middle | 0.211 | 0.000* | 1.23 |
| Highest | -0.131 | 0.000* | 0.87 |
| Constant | 0.035 | 0.490 | 1.03 |
Table text extracted from the original PDF; superscript letters are shown inline. The original table image is below.
View original table image
The regression coefficients of the migrants who have received immunization are 0.559 which is positive and significant. This
gives that the risk of migration is 1.74 times more likely than not received immunization. The beta value of the migrants who have taken government facilities and suffered from TB is -0.070 and -1.192 which are negative and insignificant. The corresponding odds ratios are 0.932 and 0.304 which indicates that the event is less likely to occur.
Figures and tables from the paper
| Cities | Public health Performance Index | — | Slum living Condition Index | — |
|---|---|---|---|---|
| Value | Rank | Value | Rank | |
| Mumbai | 0.3715 | 4 | 0.9762 | 1 |
| Delhi | 0.4406 | 3 | 0.5652 | 2 |
| Kolkata | 0.6174 | 2 | 0.3414 | 3 |
| Chennai | 0.6886 | 1 | 0.1231 | 4 |
Table text extracted from the original PDF; superscript letters are shown inline. The original table image is below.
View original table image
References
3 in the original paper- Dyson T. The role of the demographic transition in the process of urbanization. Popul Dev Rev. 2011;37:11-28.
- Parkins NC. Push and Pull Factors of Migration. Am Rev Political Econ. 2010;8:6-24.
- Rasool F, Botha CJ, Bisschoff CA. Push and Pull Factors in Relation to skills shortages in South Africa. Soc Sci. 2012;30:16-29.