
Research article · 2024 · Full text
International Journal of Geography Geology and EnvironmentScenario of tribal household distribution and residential household size in Dhule district (Maharashtra)
Volume 6(1) · Pages 162–166 · DOI: 10.22271/27067483.2024.v6.i1c.215 ↗
Research areasIncome, Poverty, and InequalitySocial and Economic Development in IndiaUrban and Rural Development Challenges
Abstract
Author-writtenHouse is the basic need of the human being, it can be a hut or a multistory building, or a bungalow with number of amenities. Number of materials is used to build up a house. It depends on the economic condition of the people. Type of the construction material used in the house, built-up area, number of rooms, and persons living in houses are the main indicators used to measure the living conditions of the residential houses in the study region. Household structure plays an important role in the economic and social well-being of families and individuals. The number and characteristics of household members affect the types of relationships and the pool of economic resources available within the household. This research explores the trend and spatial pattern in the Residential household size in Dhule district using village-level data.
Summary
Source-checkedPlain-language reading of the full paper, prepared with AI and checked against the text. Each point links to the authors' own words.
Why it matters
- Household structure is critical to the social and economic well-being of individuals and families, as it influences available resources and interpersonal relationships. View evidence ↗
- Living conditions in the study region are measured using indicators such as the number of residents, the number of rooms, the built-up area, and the materials used for construction. View evidence ↗
- Recent scholarly interest in household size changes in the developing world is driven by urbanization and demographic shifts, including declining mortality and fertility. View evidence ↗
What they did
- Researchers analyzed tribal household distribution over a 30-year period (1981 to 2011) using a combination of secondary census data and primary data from custom questionnaires. View evidence ↗
- Using an area sampling method, 17 tribal villages were selected for a detailed study, with 324 households serving as respondents. View evidence ↗
What they found
- Among the sampled villages, Varzadi showed the highest growth rate at 208.33%, followed by Godas (183.33%), Malkater (181.87%), HattiBk (170.45%), Budki (170.22%), and Charanmal (164.17%). View evidence ↗
- While 98.19% of total households own their own home, there is significant variation in the built-up area of these residences. View evidence ↗
What it means
- The authors conclude that the size, shape, and structure of houses in the Dhule region are primary expressions of the residents' socio-economic conditions. View evidence ↗
- The study indicates that the region is trending toward smaller household sizes. View evidence ↗
Visual summary
1 visualsIllustrations explain the paper; charts are replotted from the paper's own table values.
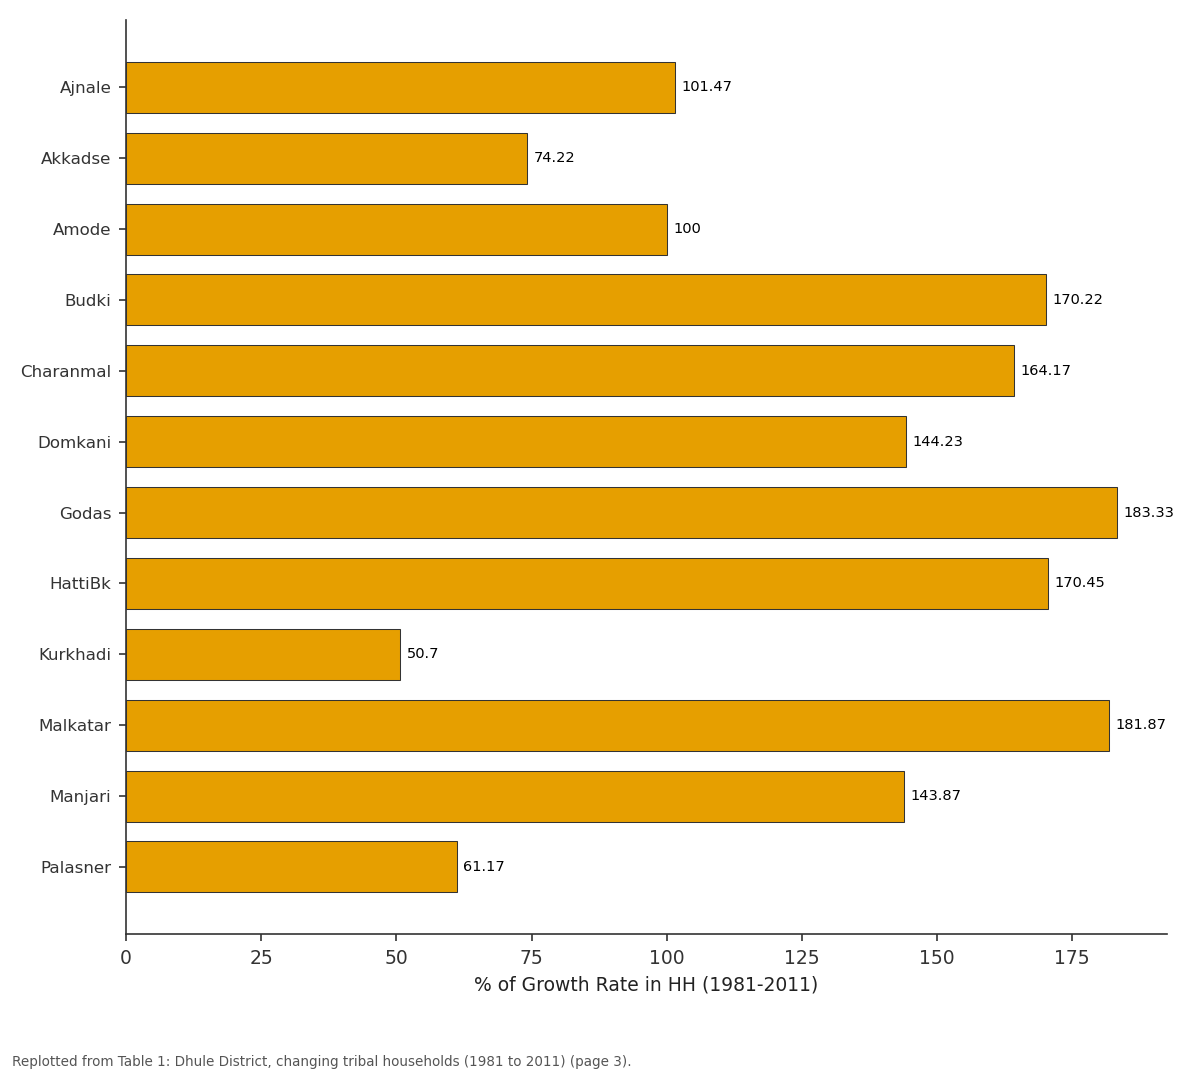
% of Growth Rate in HH (1981-2011): Ajnale vs Akkadse vs Amode vs Budki vs Charanmal
Replotted from Table 1 (page 3) of the original paper. Every bar is the paper's own table value.
View source evidence ↗Figures & tables
From the original paper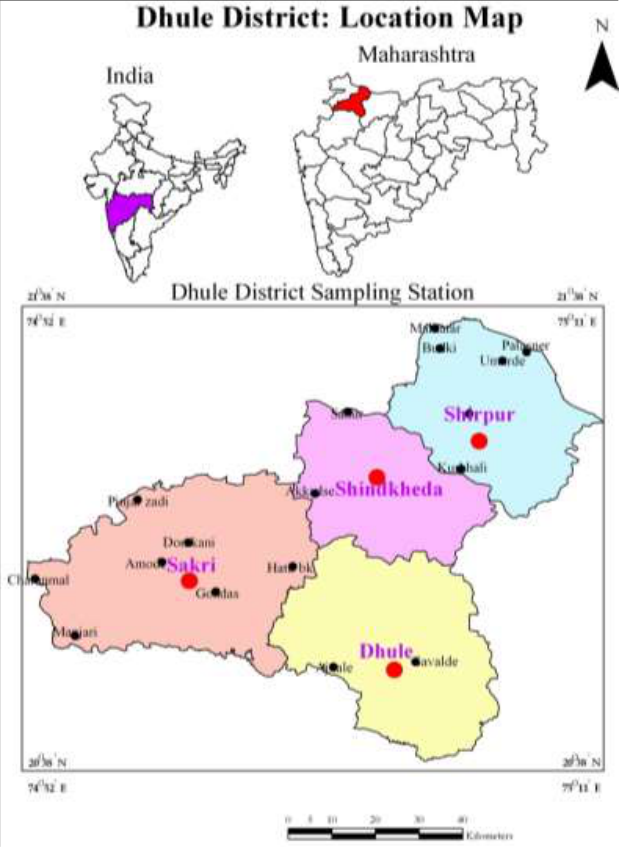 Figure 1
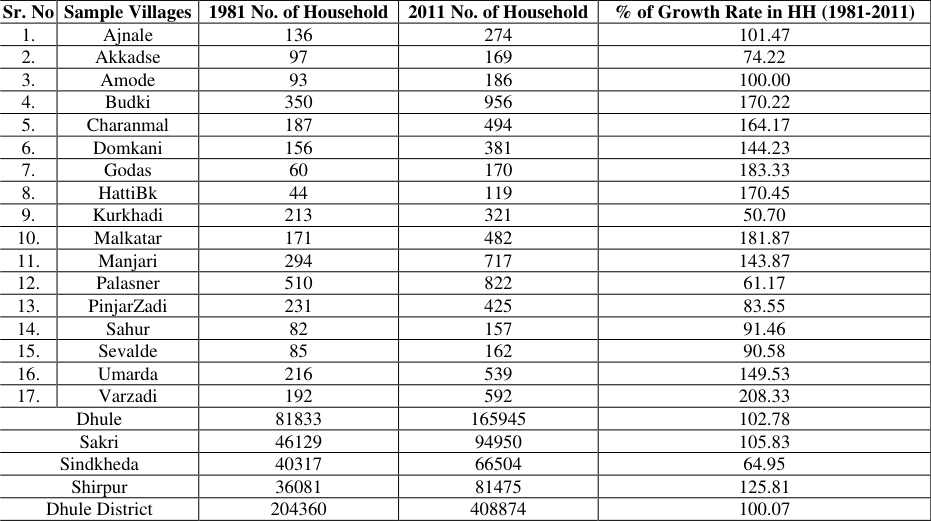 Table 1
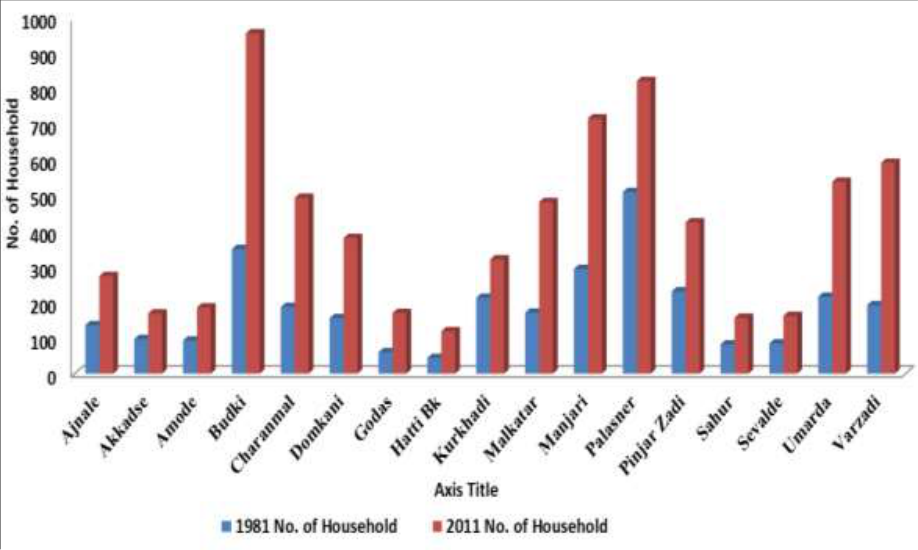 Figure 1
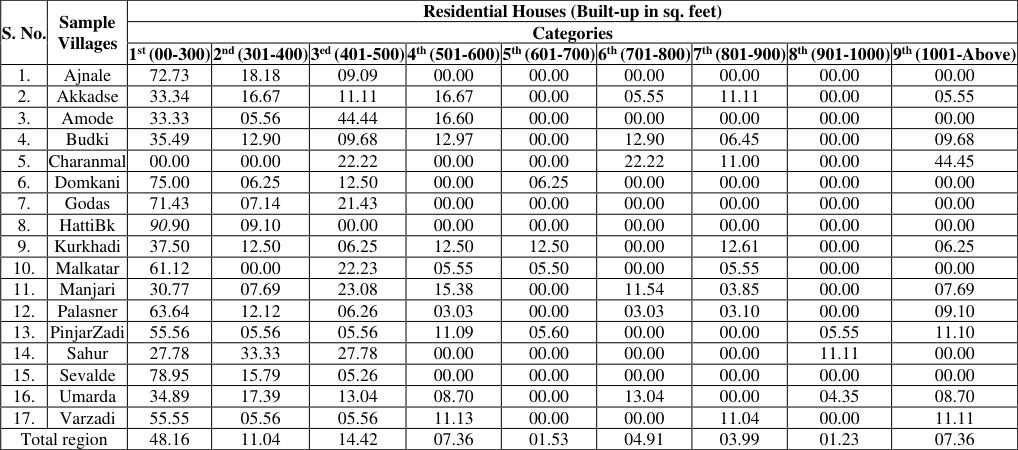 Table 2
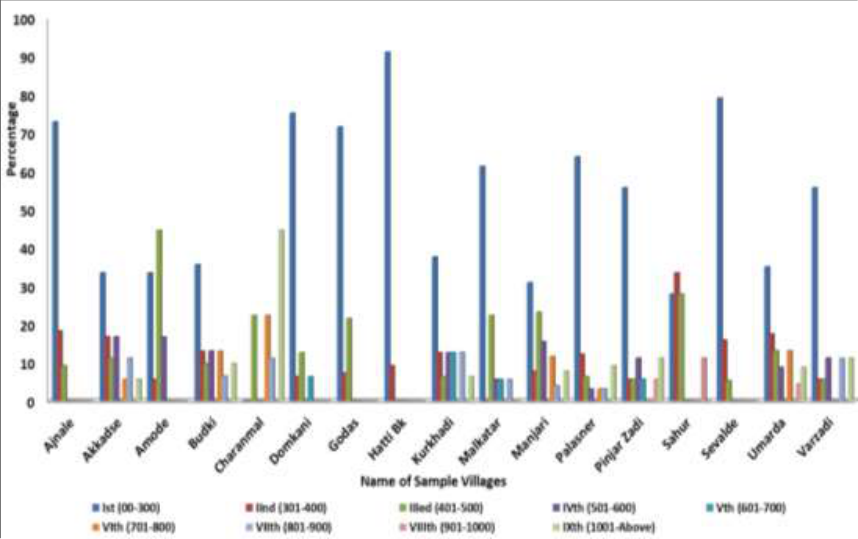 Figure 2
Introduction
A 'household' is usually a group of persons who normally live together and take their meals from a common kitchen unless the exigencies of work prevent any of them from doing so. Persons in a household may be related or unrelated or a mix of both. However, if a group of unrelated persons live in a census house but do not take their meals from the common kitchen, then they are not constituent of a common household. Each such person was to be treated as a separate household. In the important link in finding out whether it was a household or not was a common kitchen. There may be one member households, two member households or multi-member households. A household is usually defined as a group of persons (Or one person) who make common provision for food, shelter, and other essentials for living, but practices vary significantly among countries. As a consequence, measures of household size and composition obtained from censuses or other sources in different countries are sometimes not directly comparable. Changes in household size are clear reflections of changes in living arrangements as well as in household composition. However, aggregate demographic statistics generally must substantial changes in the size and number of households. As in most indicators of demographic, economic, and social changes, household changes are neither uniform in their social and spatial content. The family and the household are the most fundamental socioeconomic institutions in human society. The issue of changes of household size and composition in developing world is attracting scholarly attention only in recent years due largely to significant demographic changes of declining fertility, mortality, and urbanization in most countries and due to sociological changes towards smaller households. Such changes have been quite widespread in economically developed countries. The decline in fertility explains part of this change. The average household has fewer parents, fewer siblings, fewer grandchildren, and fewer other relatives of the household head. The social sciences, including sociology, economics and anthropology, have a long tradition of scholarly contribution on issues pertaining to families and households and there are extensive corresponding literatures.
Ringen (1991) [8] explained various aspects of standard of living and per capita income and the income also affects on household size. Aiyappan (1972) [1] analyzed households changes in family size from 1871 to 1961 in Kerala, particularly drawing interesting conclusions on the basis of data contained in the 1891 census report. Studies of developing countries have focused on several socio-cultural as well as socioeconomic factors associated with fertility and household size. Dreze and Srinivasan (1997) [4] observe on India's National Sample Survey data that poverty indices for different household types are quite sensitive to the level of economies of scale.
Data base and methodology
The study is based upon the secondary census data as well as the primary data through village and household questionnaire designed for the purpose. In 1981 to 2011 there is found a variations in the tribal household's growth in sample villages. Among the sample villages of the region, the highest tribal household growth was found in Varzadi village with 208.33 percent followed by Godas, Malkater, HattiBk, Budki, and Charanmal with 183.33, 181.87, 170.45, 170.22, and 164.17% respectively. In this period the lowest tribal household growth observed in Kurkhadi sample village with 50.70% followed by Palasner, Akkadse, PinjarZadi, Sevalde, and Sahur with 61.17, 74.22, 83.55, 90.58 and 91.46% respectively. While in five sample villages, the growth rate of tribal households was from 100.00% to 149.53%. The study region there is found a close relationship of high tribal concentration. While the mean size of households has decreased across regions, inter-regional variations in the average size are still staggering. The Hilly and mountainous regions continue with much higher household sizes on the study regions. A suitable house is one of the basic needs of human life without which one cannot perceive of a life worth living. It influences ones physical health and mental efficiency, therefore, future skill and productivity which ultimately determines individuals socio-economic status. The process of development has brought economic prosperity; scheduled tribes people have started investing a lot of money in improving their housing size and condition. Though almost 98.19% of the total households have their own house but variations in their built-up area has been recorded. Proportion of large houses has increased. It has found that people of the sample villages have start investing to improve their houses in size and facilities. Many respondents have converted their Kuccha house to Pucca as well as have constructed additional rooms. Facilities in the house like latrine, bathroom, electricity connection, and water has also increased over a period of time.
In the study region Charanmal sample villages recorded zero percent in houses group with 300 sq. feet built-up area, while in 09 villages the proportion of categories 1 st built-up area varies from 27.78 to 55.56 percent categories II nd built-up area is found almost the highest proportion has been recorded by Sahur with 33.33 percent followed by Ajnale, Umarda, Akkadse, and Sevalde with 18.18, 17.39, 16.67 and 15.79% respectively. In remaining 10 sample villages the proportion is ranging from 05.56 to 12.90%. Charnmal and Malkatar sample villages recorded zero percent in houses with categories II nd built-up area. Categories III rd built-up area is a standard size of middle class people. The highest proportion of this size has been recorded in Amode with 44.44% followed by Sahur, Manjari, Malkatar, Charanmal, and Godas with 27.78, 23.08, 22.23, 22.22 and 21.43% respectively. In remaining 10 sample villages the proportion is ranging from 05.26 to 13.04%. About 07.36 percent respondents have categories IV th builtup area is preferred by upper middle class people. The highest proportion of this category is found in Akkadse with 16.67 percent followed by Amode, Manjari, Budki, Kurkhadi, and varzadi sample villages with 16.60, 15.38, 12.97, 12.50 and 11.13% respectively. In remaining 04 villages built-up area is found 03.03 to 11.09% respectively. Seven sample villages recorded zero percent in houses with categories IV th built-up area. According to available data and field observations most of the small farmers have built-up their houses up to categories V th . In this group are only Kurkhadi (12.50%), Domkani (06.25%), PinjarZadi (05.60%) and Malkatar (05.50%) sample village's household size. Categories VIth this category is six sample villages available built-up area. Categories VII th this category is eight sample villages and category VIII th is only three villages are available of built-up area. In the study region categories IX th built-up area is largest size among the residential houses in sample villages. In this category highest proportion has been recorded in Charanmal sample village with 44.45 percent. In this category Varzadi sample village ranks second and Pinjar Zadi Sample Village has ranks third with 11.11 and 11.10% respectively. Eight sample villages recorded zero percent in houses with above 1001 sq. feet built-up area. While 6 sample villages proportion ranges from 05.55 to 09.68%. Due to the availability of land, improving economic status, and expanding needs with increasing number of family members, people now have started purchasing houses with large built-up area.
Conclusion
The discussion suggests that socio-economic conditions play vital role which is best expressed in the size, shape and structures of the houses found in the study region. This is clearly reflected in empirical study conducted by the researcher in the Dhule region of Maharashtra. Within the study area, considerable diversity in the morphology of traditional peasant's dwellings has been found. The basic form and type of houses in the area is influenced by the availability of building materials and its use in response to physical and human elements. Any change in the household size or lack of it is a reflection of complex economic, social, and demographic process. Likewise, any change in household size has serious social, economic, and demographic implications. The study underscores this fact as the study region is surely moving towards smaller household size. Only the pace and magnitude of this decline in household size varies from village to village and Tahasil to Tehsil.
Figures and tables from the paper
| Sr. No | Sample Villages | 1981 No. of Household | 2011 No. of Household | % of Growth Rate in HH (1981-2011) |
|---|---|---|---|---|
| 1. | Ajnale | 136 | 274 | 101.47 |
| 2. | Akkadse | 97 | 169 | 74.22 |
| 3. | Amode | 93 | 186 | 100.00 |
| 4. | Budki | 350 | 956 | 170.22 |
| 5. | Charanmal | 187 | 494 | 164.17 |
| 6. | Domkani | 156 | 381 | 144.23 |
| 7. | Godas | 60 | 170 | 183.33 |
| 8. | HattiBk | 44 | 119 | 170.45 |
| 9. | Kurkhadi | 213 | 321 | 50.70 |
| 10. | Malkatar | 171 | 482 | 181.87 |
| 11. | Manjari | 294 | 717 | 143.87 |
| 12. | Palasner | 510 | 822 | 61.17 |
| 13. | PinjarZadi | 231 | 425 | 83.55 |
| 14. | Sahur | 82 | 157 | 91.46 |
| 15. | Sevalde | 85 | 162 | 90.58 |
| 16. | Umarda | 216 | 539 | 149.53 |
| 17. | Varzadi | 192 | 592 | 208.33 |
| Dhule | 81833 | 165945 | 102.78 | |
| Sakri | 46129 | 94950 | 105.83 | |
| Sindkheda | 40317 | 66504 | 64.95 | |
| Shirpur | 36081 | 81475 | 125.81 | |
| Dhule District | 204360 | 408874 | 100.07 |
Table text extracted from the original PDF; superscript letters are shown inline. The original table image is below.
View original table image
| S. No. | Sample Villages | Residential Houses (Built-up in sq. feet) | — | — | — | — | — | — | — | — |
|---|---|---|---|---|---|---|---|---|---|---|
| Categories | ||||||||||
| 1st (00-300) | 2nd (301-400) | 3ed (401-500) | 4th (501-600) | 5th (601-700) | 6th (701-800) | 7th (801-900) | 8th (901-1000) | 9th (1001-Above) | ||
| 1. | Ajnale | 72.73 | 18.18 | 09.09 | 00.00 | 00.00 | 00.00 | 00.00 | 00.00 | 00.00 |
| 2. | Akkadse | 33.34 | 16.67 | 11.11 | 16.67 | 00.00 | 05.55 | 11.11 | 00.00 | 05.55 |
| 3. | Amode | 33.33 | 05.56 | 44.44 | 16.60 | 00.00 | 00.00 | 00.00 | 00.00 | 00.00 |
| 4. | Budki | 35.49 | 12.90 | 09.68 | 12.97 | 00.00 | 12.90 | 06.45 | 00.00 | 09.68 |
| 5. | Charanmal | 00.00 | 00.00 | 22.22 | 00.00 | 00.00 | 22.22 | 11.00 | 00.00 | 44.45 |
| 6. | Domkani | 75.00 | 06.25 | 12.50 | 00.00 | 06.25 | 00.00 | 00.00 | 00.00 | 00.00 |
| 7. | Godas | 71.43 | 07.14 | 21.43 | 00.00 | 00.00 | 00.00 | 00.00 | 00.00 | 00.00 |
| 8. | HattiBk | 90.90 | 09.10 | 00.00 | 00.00 | 00.00 | 00.00 | 00.00 | 00.00 | 00.00 |
| 9. | Kurkhadi | 37.50 | 12.50 | 06.25 | 12.50 | 12.50 | 00.00 | 12.61 | 00.00 | 06.25 |
| 10. | Malkatar | 61.12 | 00.00 | 22.23 | 05.55 | 05.50 | 00.00 | 05.55 | 00.00 | 00.00 |
| 11. | Manjari | 30.77 | 07.69 | 23.08 | 15.38 | 00.00 | 11.54 | 03.85 | 00.00 | 07.69 |
| 12. | Palasner | 63.64 | 12.12 | 06.26 | 03.03 | 00.00 | 03.03 | 03.10 | 00.00 | 09.10 |
| 13. | PinjarZadi | 55.56 | 05.56 | 05.56 | 11.09 | 05.60 | 00.00 | 00.00 | 05.55 | 11.10 |
| 14. | Sahur | 27.78 | 33.33 | 27.78 | 00.00 | 00.00 | 00.00 | 00.00 | 11.11 | 00.00 |
| 15. | Sevalde | 78.95 | 15.79 | 05.26 | 00.00 | 00.00 | 00.00 | 00.00 | 00.00 | 00.00 |
| 16. | Umarda | 34.89 | 17.39 | 13.04 | 08.70 | 00.00 | 13.04 | 00.00 | 04.35 | 08.70 |
| 17. | Varzadi | 55.55 | 05.56 | 05.56 | 11.13 | 00.00 | 00.00 | 11.04 | 00.00 | 11.11 |
| Total region | 48.16 | 11.04 | 14.42 | 07.36 | 01.53 | 04.91 | 03.99 | 01.23 | 07.36 |
Table text extracted from the original PDF; superscript letters are shown inline. The original table image is below.
View original table image
References
6 in the original paper- Blake J. Number of siblings, family background and the process of educational attainment. Society of Biology. 1986;33(1-2):5-21.
- Burch TK. Household and family demography: A bibliographic essay. Popul Index. 1979;45(2):173-195.
- Dreze J, Srinivasan PV. Widowhood and poverty in rural India: Some inferences from household survey data. Journal of Development Economics. 1997;54(2):217-234.
- Nayak DK, Behera RN. Changing household size in India: An inter-state comparison. Transactions of the Institute of Indian Geographers. 2014;36(1):1-18.
- Nile UV, Bhavsar SS. Changing tribal population growth in Dhule District, Maharashtra. Bhugol Shastra Sanshodhan Patrika. 2013;30:30-36.
- Ringen S. Households, standard of living and inequality. Rev Income Wealth. 1991;37(1):1-13.