
Research article · 2024 · Full text
International Journal of Geography Geology and EnvironmentGeographical study of seasonal variation in water quality parameters of Prakasha barrage on Tapi River in Nandurbar district
Volume 6(1) · Pages 88–92 · DOI: 10.22271/27067483.2024.v6.i1b.205 ↗
Research areasWater resources management and optimizationWater Quality and Pollution AssessmentAgricultural Economics and Practices
Abstract
Author-writtenWater is perhaps the most precious natural resource after air. Though the surface of the earth is mostly consists of water, only a small part of it is usable, which makes this resource very limited. This precious and limited resource, Therefore, must be used with prudence. As water is required for different purposes, the suitability of it must be checked before use. Also, sources of water must be monitored regularly to determine whether they are in sound health or not. Poor. Poor condition of water bodies are not only the indictor of environmental degradation, it is also a threat to the ecosystem. Condition of water bodies are not only the indictor of environmental degradation. The purpose of this study was to assess the degree of pollution of Prakasha barrage on Tapi river water by determining various physico-chemical parameters. Water samples were collected three times per year during winter, summer and rainy season at the following locations. Most of the measured physicochemical parameters exceeded permissible limit of drinking water.
Summary
Source-checkedPlain-language reading of the full paper, prepared with AI and checked against the text. Each point links to the authors' own words.
Why it matters
- Monitoring the health of water bodies is essential because poor water quality indicates environmental degradation and threatens the ecosystem. View evidence ↗
- Studying water quality near dams is important as these structures can significantly impact water quality through various factors. View evidence ↗
- Seasonal changes can alter water temperature, nutrient concentrations, and dissolved oxygen, which affects the aquatic ecosystem. View evidence ↗
The question
- The study aimed to assess the pollution level of the Prakasha barrage on the Tapi River by measuring various physico-chemical parameters. View evidence ↗
What they did
- Water samples were collected three times annually, covering the summer, rainy (monsoon), and winter seasons. View evidence ↗
- Analysis of parameters such as nitrate, sulphate, and electrical conductivity was performed at the GSDA laboratory in Nandurbar. View evidence ↗
What they found
- During the summer season, most tested water parameters remained within the permissible limits set by the GSDA. View evidence ↗
- In the monsoon season, iron levels reached 1.2 mg/l, exceeding the BIS permissible limit of 1 mg/l. View evidence ↗
- Turbidity during the monsoon season was 18 NTU, which is significantly higher than the permissible limit of 5 NTU. View evidence ↗
- Bacterial testing in the monsoon season showed total coliform levels of 9.0 MPN/100 ml, exceeding the permissible limit of 0 MPN/100 ml. View evidence ↗
- Water quality in the winter season generally met BIS standards, featuring a very low turbidity level of 0.05 NTU. View evidence ↗
- Except for the monsoon season, E. coliform and total coliform levels remained within BIS permissible limits throughout the year. View evidence ↗
What it means
- The authors conclude that seasonal fluctuations in water quality mean the water is not consistently suitable for drinking throughout the year. View evidence ↗
- The authors recommend further analysis and active water quality management to ensure the water is safe for drinking. View evidence ↗
Visual summary
2 visualsIllustrations explain the paper; charts are replotted from the paper's own table values.
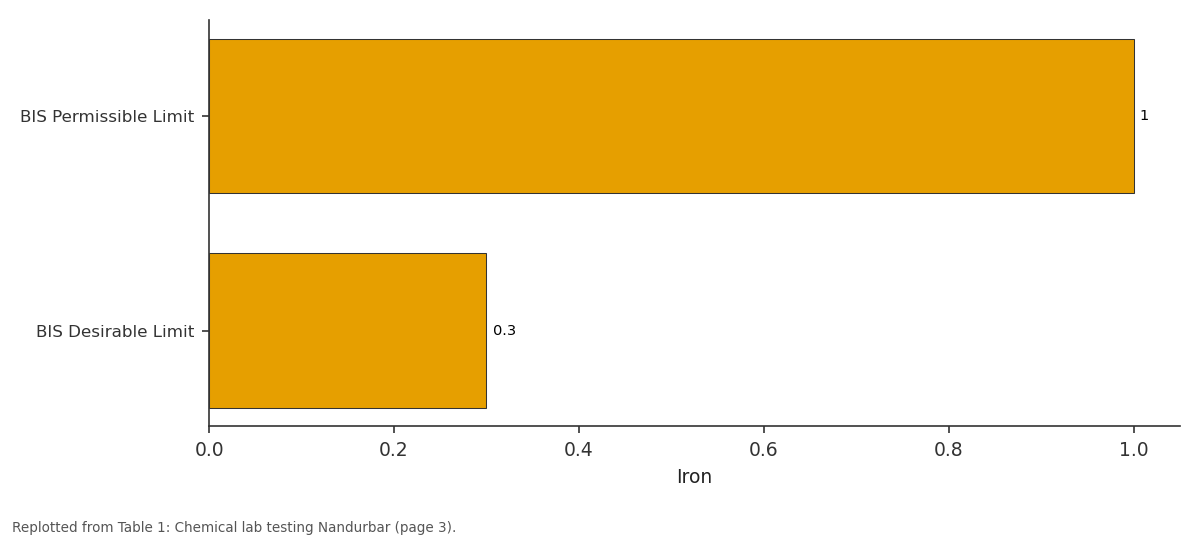
Iron: BIS Permissible Limit vs BIS Desirable Limit
Replotted from Table 1 (page 3) of the original paper. Every bar is the paper's own table value.
View source evidence ↗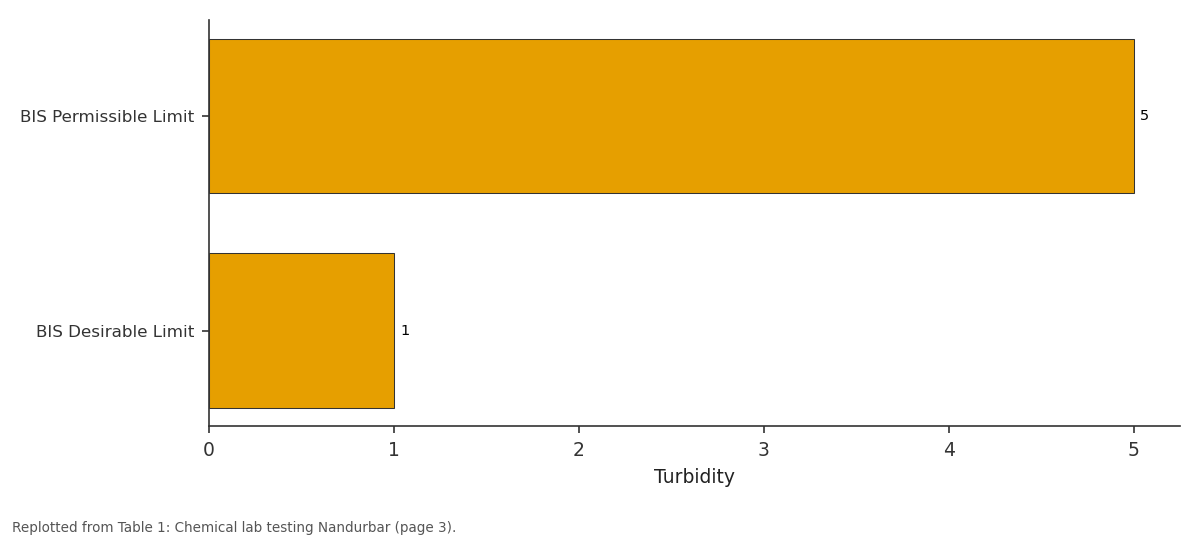
Turbidity: BIS Permissible Limit vs BIS Desirable Limit
Replotted from Table 1 (page 3) of the original paper. Every bar is the paper's own table value.
View source evidence ↗Figures & tables
From the original paper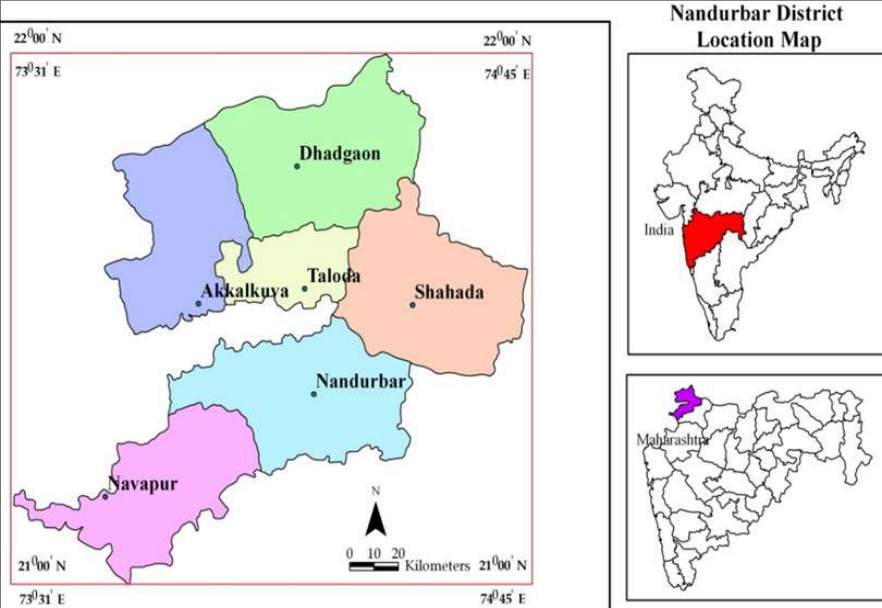 Figure 1
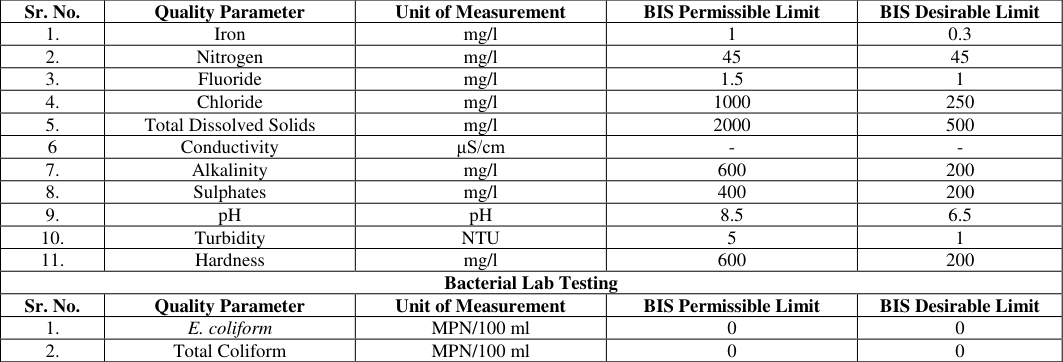 Table 1
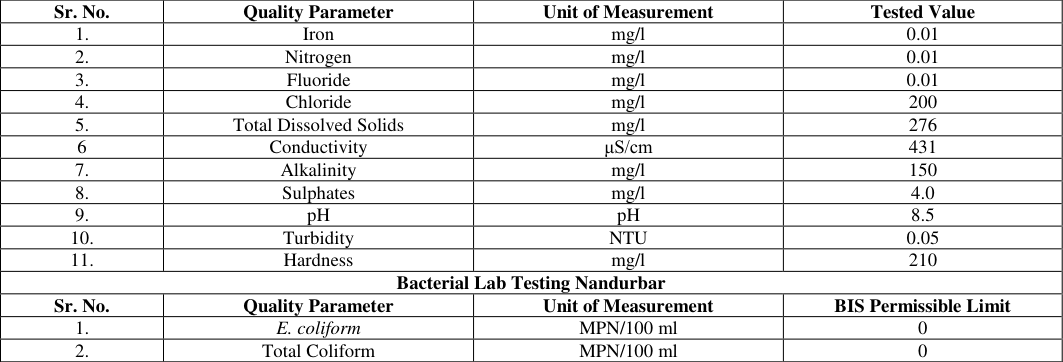 Table 2
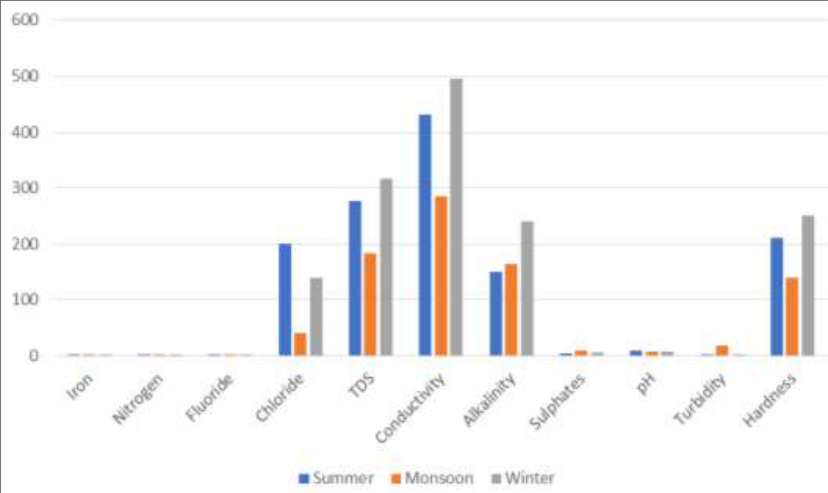 Figure 2
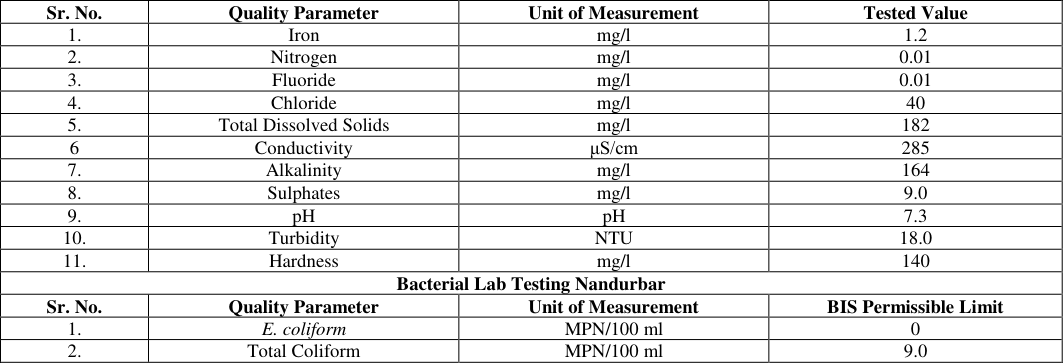 Table 3
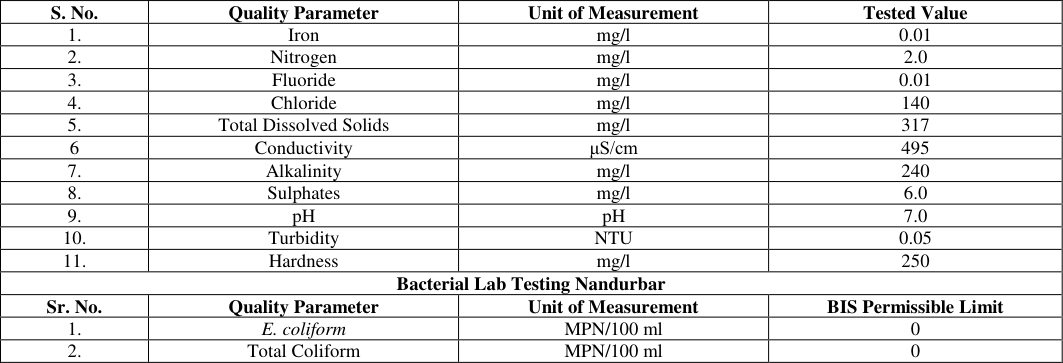 Table 4
Introduction
The study of water quality near dams of the river is of immense importance because dams and reservoirs can have a significant impact on water quality due to several factors Dams and reservoirs play a crucial role in addressing water pollution by storing and treating water, acting as natural filters, trapping sediments, pollutants, and excess nutrients carried by the incoming water However, dams can fragment river systems, disrupting the natural connectivity between different habitats, and alter the natural flow patterns of rivers by storing water in reservoirs and selectively releasing it, leading to sedimentation, changes in water temperature, dissolved oxygen levels, and nutrient concentrations, affecting the overall aquatic ecosystem The study of water quality near dams can help assess the impact of dams on water quality and identify potential sources of contamination, enabling the implementation of effective measures to mitigate water contamination near dams and reservoirs The study of water quality near dams can also help in the management of dam operations to minimize downstream ecological impacts, following the concept of environmental flows [1] . The study of seasonal variation of water quality near dams of the river is crucial due to the significant impact of dams on water quality. Seasonal variations can lead to changes in water temperature, dissolved oxygen levels, and nutrient concentrations, which in turn affect the overall aquatic ecosystem. For example, the implementation of a dam reservoir was found to have a positive effect on reducing the concentration of total phosphorus in the water, highlighting the seasonal influence on water quality. Additionally, the study of seasonal variation is essential for understanding the impact of dams on water quality during different periods, such as droughts and floods, and for implementing effective measures to mitigate water contamination near dams and reservoirs. Therefore, studying seasonal variation in water quality near dams is vital for assessing and managing the impact of dams on the aquatic ecosystem and ensuring sustainable water management [2] .
Study Area
Astronomically Nandurbar district extends between 21°0' to 22°03' north latitude and 73°47' to 74°47' east longitude.
Nandurbar district lies in the north western part of Maharashtra. Nandurbar district was created with bifurcation of Dhule district on 1 st July, 1998. The region is bounded by Dhule district on east and south, while on the west by Seurat district of Gujarat state and on the north by Badwani and Jhabua district of Madhya Pradesh. The Nandurbar district with a geographical area of 5034.23 sq.km. has an amorphous shape. The region presents a very interesting case study for social change. A meeting ground of several languages, families, ethnic groups and a mosaic of cultural patterns. According to 2011 census Nandurbar district accommodates 16, 48,295 people with 69.28% of scheduled tribe population, which ranks first in the state with 39 tribal groups being accommodated in various tehsils of the region. According to census 2011 proportion of urban population is very low with 16.71% of total population in the district and 83.29% of the total is living in rural areas. Decadal population growth rate in the region has been 25.66% with annual growth rate of 2.21%. The Prakasha Dam, also known as the Prakasha Barrage Medium Irrigation Project, is situated in the Tapi basin in the Nandurbar district of Maharashtra, India. The dam plays a crucial role in the region's irrigation and water resource management. Prakasha Dam is located in Prakasha village, which is around 15 km south-west of Shahada in the Nandurbar district of Maharashtra, India. The dam is located at coordinates 21.512232, 74.345367. The Nandurbar district is situated in the northern part of Maharashtra and is known for its natural beauty, including the Toranmal hill station, which is the second-highest hill station in Maharashtra. The district is also known for its hydrogeological features [3] . 3. To analyses the status of water quality and their quality index of Prakasha barrage in Nandurbar District [4] .
Data and Methodology
The research work is entirely based on primary data, water samples are collected in Prakasha barrage in three season Water samples have been analyzed for 11 physico-chemical parameters such as pH, Calcium, Magnesium, Chloride, Sulphate, Nitrate and Electrical Conductivity in the GSDA laboratory Nandurbar as per the standard procedures.
Analysis and Discussion
The comprehensive analysis of water quality parameters for three different seasons i.e., summer, monsoon, and winter is been observed. The parameters include iron, nitrate, fluoride, chloride, total dissolved solids (TDS), conductivity, alkalinity, sulphates, pH, turbidity, and hardness for chemical testing, as well as E. coliform and total coliform for bacterial testing [4] .
Total Coliform MPN/100 ml 0
For the summer season, the tested values for various parameters are within permissible limits as specified by the Groundwater Survey and Development Agency (GSDA), except for nitrate and sulphate, which is very low as compared to BIS permissible limit of 45 mg/l and 400 mg/l respectively [6] .
In the monsoon season, the water quality varies, with some parameters exceeding the BIS permissible limits. For instance, the Iron level is 1.2 mg/l, which is above the permissible limit of 1 mg/l. Similarly, the turbidity in the monsoon season is 18 NTU, surpassing the permissible limit of 5 NTU. Bacterial Reports also reflects increase in the number of Coliform level which is 9.0 MPN/100 ml, exceeding the permissible limit of 0 MPN/100 ml.
In the winter season, the water quality also remains within acceptable limits based on the BIS standards for most parameters, with very low turbidity of 0.05 NTU.
Comparing the three seasons, it is evident that the water quality parameters fluctuate across the seasons. The summer season generally meets the BIS standards, while the monsoon season shows some parameters exceeding permissible limits. The winter season also meets the standards, with the turbidity levels dropping down remarkably. This comparison highlights the seasonal variability in water quality and the need for continued monitoring and management to ensure safe and clean water. The comparison of the tested values with the BIS permissible and desirable limits provides a clear benchmark for evaluation. It reveals that certain parameters may exceed the permissible or desirable limits during specific seasons, indicating potential water quality concerns. For example, the tested values for Iron and turbidity in monsoon exceeded the BIS permissible limits, suggesting a need for further attention to water quality management during that season. Additionally, the bacterial lab testing consistently indicated that the tested values for E. coliform and Total Coliform remained within the BIS permissible limits across all three seasons, except monsoon which reports increase in the number of Coliform. This suggesting a consistent level of bacterial contamination throughout the year. Overall, the data underscores the dynamic nature of water quality, influenced by seasonal variations and environmental factors. It highlights the importance of regular monitoring and assessment of water quality to ensure it meets established standards throughout the year. This information can inform strategic decision-making and interventions to maintain and improve water quality for public health and environmental sustainability [5] .
Conclusion
The data from the chemical and bacterial lab testing across the summer, monsoon, and winter seasons provides insights into the water quality variations. The tested values of parameters such as chloride, total dissolved solids (TDS), conductivity, alkalinity, sulphates, pH, turbidity, and hardness fluctuate across the seasons, indicating seasonal influences on water quality. Similarly, conductivity, alkalinity, sulphates, pH, turbidity, and hardness also exhibited varying levels across the seasons. These fluctuations suggest that the water may not consistently meet the standards for drinking purposes throughout the year.
Comparing the tested values with the BIS permissible and desirable limits, it is evident that certain parameters may exceed the permissible or desirable limits during specific seasons, indicating potential water quality concerns. For example, the tested values for Iron and turbidity in monsoon exceeded the BIS permissible limits, suggesting a need for further attention to water quality management during that season [7] . Bacterial lab testing consistently indicated that the tested values for E. coliform and Total Coliform remained within the BIS permissible limits across all three seasons, except monsoon which reports increase in the number of Coliform. This suggesting a consistent level of bacterial contamination throughout the year. Based on data, it can be concluded that the water quality fluctuates across the seasons, with certain parameters exceeding permissible limits during specific times. This indicates that the water may not be consistently suitable for drinking throughout the year. Further analysis and management of water quality are necessary to ensure its suitability for drinking purposes.
Figures and tables from the paper
| Sr. No. | Quality Parameter | Unit of Measurement | BIS Permissible Limit | BIS Desirable Limit |
|---|---|---|---|---|
| 1. | Iron | mg/l | 1 | 0.3 |
| 2. | Nitrogen | mg/l | 45 | 45 |
| 3. | Fluoride | mg/l | 1.5 | 1 |
| 4. | Chloride | mg/l | 1000 | 250 |
| 5. | Total Dissolved Solids | mg/l | 2000 | 500 |
| 6 | Conductivity | μS/cm | - | - |
| 7. | Alkalinity | mg/l | 600 | 200 |
| 8. | Sulphates | mg/l | 400 | 200 |
| 9. | pH | pH | 8.5 | 6.5 |
| 10. | Turbidity | NTU | 5 | 1 |
| 11. | Hardness | mg/l | 600 | 200 |
| Bacterial Lab Testing | ||||
| Sr. No. | Quality Parameter | Unit of Measurement | BIS Permissible Limit | BIS Desirable Limit |
| 1. | E. coliform | MPN/100 ml | 0 | 0 |
| 2. | Total Coliform | MPN/100 ml | 0 | 0 |
Table text extracted from the original PDF; superscript letters are shown inline. The original table image is below.
View original table image
| Sr. No. | Quality Parameter | Unit of Measurement | Tested Value |
|---|---|---|---|
| 1. | Iron | mg/l | 0.01 |
| 2. | Nitrogen | mg/l | 0.01 |
| 3. | Fluoride | mg/l | 0.01 |
| 4. | Chloride | mg/l | 200 |
| 5. | Total Dissolved Solids | mg/l | 276 |
| 6 | Conductivity | μS/cm | 431 |
| 7. | Alkalinity | mg/l | 150 |
| 8. | Sulphates | mg/l | 4.0 |
| 9. | pH | pH | 8.5 |
| 10. | Turbidity | NTU | 0.05 |
| 11. | Hardness | mg/l | 210 |
| Bacterial Lab Testing Nandurbar | |||
| Sr. No. | Quality Parameter | Unit of Measurement | BIS Permissible Limit |
| 1. | E. coliform | MPN/100 ml | 0 |
| 2. | Total Coliform | MPN/100 ml | 0 |
Table text extracted from the original PDF; superscript letters are shown inline. The original table image is below.
View original table image
| Sr. No. | Quality Parameter | Unit of Measurement | Tested Value |
|---|---|---|---|
| 1. | Iron | mg/l | 1.2 |
| 2. | Nitrogen | mg/l | 0.01 |
| 3. | Fluoride | mg/l | 0.01 |
| 4. | Chloride | mg/l | 40 |
| 5. | Total Dissolved Solids | mg/l | 182 |
| 6 | Conductivity | μS/cm | 285 |
| 7. | Alkalinity | mg/l | 164 |
| 8. | Sulphates | mg/l | 9.0 |
| 9. | pH | pH | 7.3 |
| 10. | Turbidity | NTU | 18.0 |
| 11. | Hardness | mg/l | 140 |
| Bacterial Lab Testing Nandurbar | |||
| Sr. No. | Quality Parameter | Unit of Measurement | BIS Permissible Limit |
| 1. | E. coliform | MPN/100 ml | 0 |
| 2. | Total Coliform | MPN/100 ml | 9.0 |
Table text extracted from the original PDF; superscript letters are shown inline. The original table image is below.
View original table image
| S. No. | Quality Parameter | Unit of Measurement | Tested Value |
|---|---|---|---|
| 1. | Iron | mg/l | 0.01 |
| 2. | Nitrogen | mg/l | 2.0 |
| 3. | Fluoride | mg/l | 0.01 |
| 4. | Chloride | mg/l | 140 |
| 5. | Total Dissolved Solids | mg/l | 317 |
| 6 | Conductivity | μS/cm | 495 |
| 7. | Alkalinity | mg/l | 240 |
| 8. | Sulphates | mg/l | 6.0 |
| 9. | pH | pH | 7.0 |
| 10. | Turbidity | NTU | 0.05 |
| 11. | Hardness | mg/l | 250 |
| Bacterial Lab Testing Nandurbar | |||
| Sr. No. | Quality Parameter | Unit of Measurement | BIS Permissible Limit |
| 1. | E. coliform | MPN/100 ml | 0 |
| 2. | Total Coliform | MPN/100 ml | 0 |
Table text extracted from the original PDF; superscript letters are shown inline. The original table image is below.
View original table image
References
6 in the original paper- Dębska K, Rutkowska B, Szulc W. The influence of a dam reservoir on water quality in a small lowland river. Environmental Monitoring and Assessment. 2021;193(3):123.
- Harikrishna AB. Study on the Quality of Water in Some Streams of Cauvery River. E-Journal of Chemistry. 2008;5(2):377-384.
- Ahipathi MV, Puttaiah ET. Ecological Characteristics of Vrishabhavathi River in Bangalore (India). Environmental Geology. 2006;49(8):1217-1222.
- Begum A, Harikrishna. Study on the quality of water in some streams of Cauvery River. Journal of Chemistry. 2008;5(2):377-384.
- Vivekanandan N. Assessment of Uncertainty of Error in Design Flood Estimates Using 2-Parameter Log Normal Distribution. I-Manager's Journal on Structural Engineering. 2023;12(3):55-63.
- Nair SM, Muhammadali SA, Koushlesh SK, Chanu TN, Das SK, Bhakta D. Probing river health status: a study based on index of biotic integrity (IBI) in Tapti River of Deccan plateau, India. Environmental Science and Pollution Research. 2023;30(29):73185-73201.