
Research article · 2024 · Full text
International Journal of Geography Geology and EnvironmentSpatio temporal analysis of changing population density in Nandurbar city
Volume 6(1) · Pages 122–126 · DOI: 10.22271/27067483.2024.v6.i1b.212 ↗
Research areasSocial and Economic Development in IndiaIncome, Poverty, and InequalityCOVID-19 epidemiological studies
Abstract
Author-writtenPopulation density is one of the important indices of the density of population. Demography is the study of population change over time and space and it studies the various determinants of population change and the impact of such changes on socio-economic development of region. The density is the ratio between land and population in a region. The geographers are generally use arithmetic density which is the total number of people divided by total area of the region. A density of population will imply greater economic activities and an obvious urge for an improved standard of living, a grater struggle for existence and continuous competition. All these are helpful for better economic life. Hence, it is necessary to the study distribution and density of population in the Nandurbar city.
Summary
Source-checkedPlain-language reading of the full paper, prepared with AI and checked against the text. Each point links to the authors' own words.
Why it matters
- Demography examines how population changes across time and space, focusing on the factors driving these changes and their effects on a region's socio-economic development. View evidence ↗
- Increasing population density is linked to several urban challenges, including housing shortages, road congestion, slum expansion, and increased pollution of land, water, and air. View evidence ↗
- Higher population density can indicate increased economic activity and a drive for better living standards, though it also leads to greater competition for resources. View evidence ↗
What they did
- The study area is Nandurbar city, which covered 32.4 sq.kms according to the 2011 census. View evidence ↗
- The researchers used secondary data obtained from the Socio-Economic review and the District census handbooks for 1991 and 2011. View evidence ↗
- The analysis focused on a 20-year period from 1991 to 2011, examining 40 wards in 1991 and 33 wards in 2011. View evidence ↗
What they found
- Population density in Nandurbar city rose from 1220 persons per sq.km. in 1951 to 2189 persons per sq.km. by 1971. View evidence ↗
- By the 2011 census, the population density reached 3536 persons per sq.km., reflecting an increase of approximately 530 persons per sq.km. between 2001 and 2011. View evidence ↗
- In 2011, Ward No. 31 exhibited the highest population density in the city, reaching 40,731 persons per sq.km. View evidence ↗
- The lowest population densities in 2011 were found in Ward No. 07 (901 persons per sq.km.), Ward No. 06 (960 persons per sq.km.), and Ward No. 02 (1248 persons per sq.km.). View evidence ↗
- The authors attribute the rapid increase in population and density to modernization, industrialization, and globalization, which led to a decline in death rates. View evidence ↗
What it means
- The authors conclude that the average population density of Nandurbar is steadily increasing due to the growth of urbanization. View evidence ↗
- The study concludes that population is heavily concentrated in the city center, while the peripheral areas remain more scattered. View evidence ↗
Visual summary
2 visualsIllustrations explain the paper; charts are replotted from the paper's own table values.
Population Distribution Pattern
AI-generated conceptual illustration (Nandurbar city urban layout). It explains the idea and does not show study data.
View source evidence ↗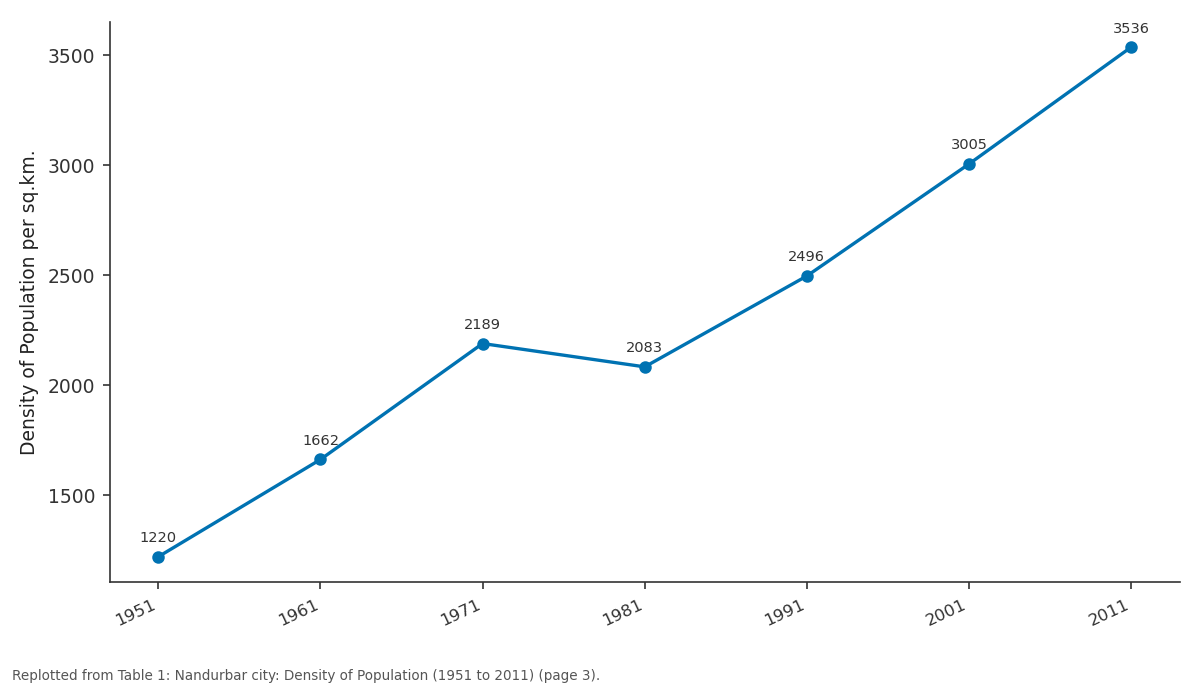
Density of Population per sq.km.: 1951 vs 1961 vs 1971 vs 1981 vs 1991
Replotted from Table 1 (page 3) of the original paper. Every bar is the paper's own table value.
View source evidence ↗Figures & tables
From the original paper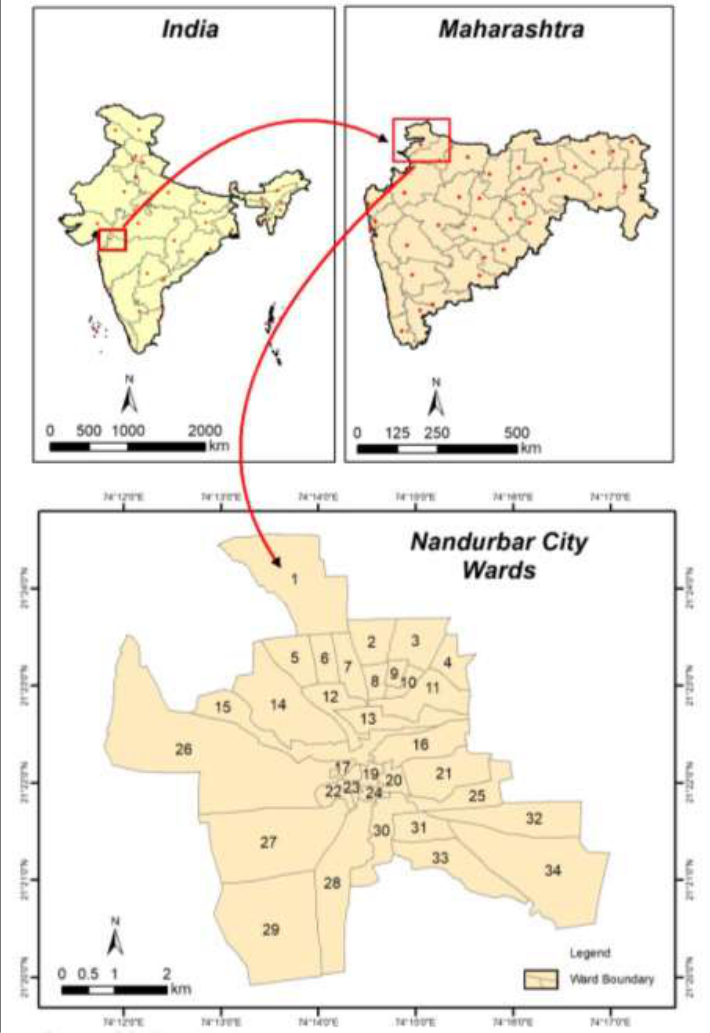 Figure 1
 Table 1
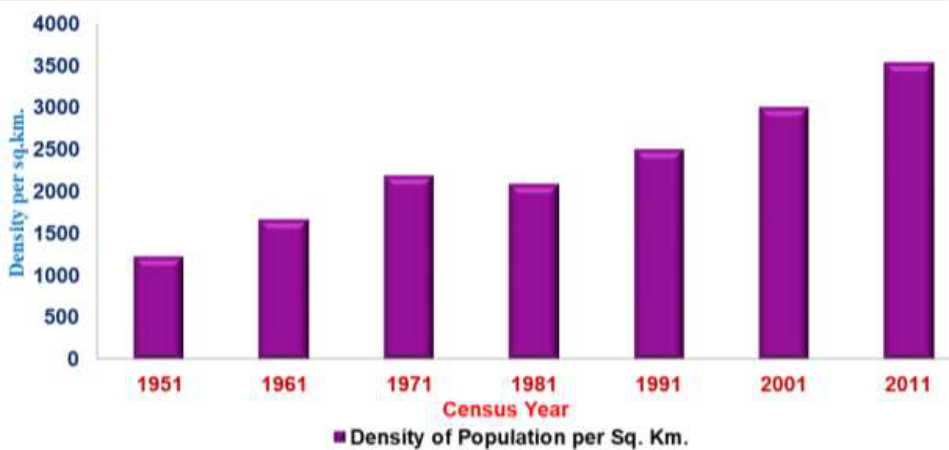 Figure 2
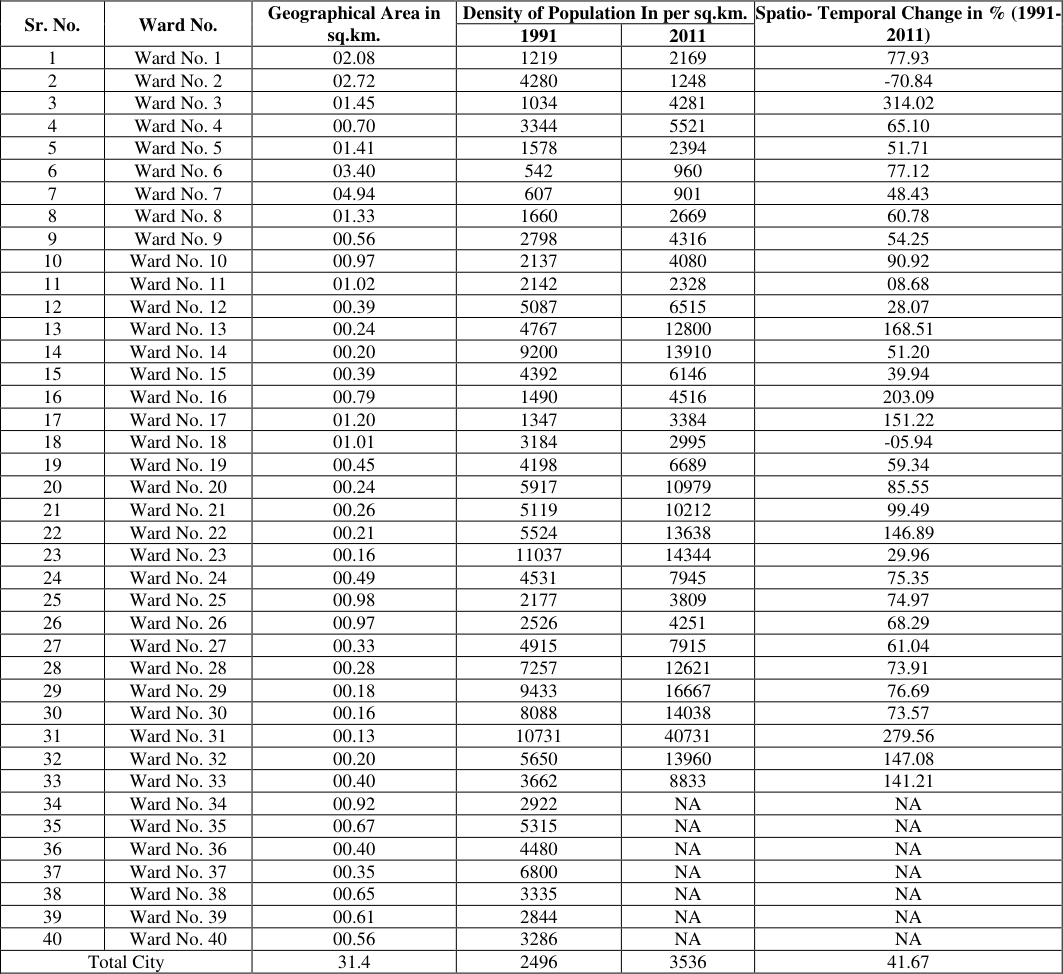 Table 2
Introduction
In the demographic studies the population cannot be clarified without distribution Density. The population density is the most important tool of measuring the distribution of population in a particular area and it gives a clear-cut picture of the distribution of particular region. Density of population in simple words refers to man-land ratio. Man and land are the ultimate elements in the life of human society, so that number of people in proportion to the area is a fundamental consideration to study population. It is therefore, becomes essential to analyses the distribution of inhabitants in terms of the total area which they occupy, and this helps in simplifying the complexities of population. Density of population helps us to understanding nature of population distribution. It indicates natural resources; it also becomes easier to know possibilities for region. While introducing new transporting network it is essential to know density of population of a region. (Sawant, Athavale 1994) [5] Population density is the most fundamental demographic process with which all other demographic attributes are directly or indirectly associated. Population growth determines density, distribution pattern and composition of population. (Ghosh 1985) [2] The composition of residential, industrial, commercial, transport and other services on the available land has been effected with the changes in population density over the period of time. The problem of housing, increasing congestion in the residential areas as well as on the public roads, expansion of slums, increasing pressure on natural resources, increasing land pollution with water and air as well as the social pollution are such problems, which are directly related with the increasing density of population in the area. Thus the impact of density can be seen not only on socio-economic environment but also on natural environment of the area. Krishnan (1971) [3] analyze that the high density is related vary intensive agriculture, in upper Bari Doab, Punjab and close near to various urban centers and large proportion of population outside the agriculture.
Objective
Objective
Study area
Nandurbar city is headquarter and administrative district of northwest corner of (Khandesh region) Maharashtra. On 1 July 1998 Dhule was bifurcated as two separate districts now known as Dhule and Nandurbar. Nandurbar district is bounded to the south and south-east by Dhule district, to the west and north is the state of Gujarat, to the north and northeast is the state of Madhya Pradesh. The northern boundary of the district is defined by the great river. The district headquarters is located at Nandurbar city. The Nandurbar city is divided into 33 wards. It has an average elevation of 210 meters above sea level. Nandurbar is located on 21 0 20' North to 21 0 24' North latitudes and 74 0 12'East to 74 0 17' East longitude. The city is spread over an area of 32. It is clearly seen that the average density of Nandurbar town has increased because of the growth of total population. This average density is not distributed uniformly. Areas the density is very high and density is below average. There is a found a high variation in spatio temporal changes in the Nandurbar city population density. The researcher observed that due to modernization, Industrialization and Globalization the death rate in wards rapidly declined. Hence population increased in tremendous proportion, as well as the density of population in urban areas as affected. Not only the population density in ward wise has changed but the region's over density has also changed.
Discussion
Discussion
2) Medium density area (
2) Medium density area (
Conclusion
The concepts of population distribution and density are so closely related to each other that it would be appropriate to discuss them together though the two concepts are different. Population distribution is based on location while density is a ratio. Population distribution denotes the spatial pattern due to dispersal of population, formation of agglomeration, linear spread etc. Even in tribal areas density of population also increased. The distribution and density of population are very high in the centre and core while the distribution and density get decreased towards the peripherals zone. In the clearly observed that because of the growth of urbanization the average density of Nandurbar is constantly increasing year after year. There uniformity regarding distribution of population throughout the city. In general population is concentrated more in central part whereas scattered population is found in the area of periphery of the city.
Figures and tables from the paper
| Census Year | Total Population | Area in sq.km. | Density of Population per sq.km. |
|---|---|---|---|
| 1951 | 30140 | 24.7 | 1220 |
| 1961 | 41055 | 24.7 | 1662 |
| 1971 | 54070 | 24.7 | 2189 |
| 1981 | 65394 | 31.4 | 2083 |
| 1991 | 78378 | 31.4 | 2496 |
| 2001 | 94368 | 31.4 | 3005 |
| 2011 | 111037 | 31.4 | 3536 |
Table text extracted from the original PDF; superscript letters are shown inline. The original table image is below.
View original table image
| Sr. No. | Ward No. | Geographical Area in sq.km. | Density of Population In per sq.km. | — | Spatio- Temporal Change in % (1991- 2011) |
|---|---|---|---|---|---|
| 1991 | 2011 | ||||
| 1 | Ward No. 1 | 02.08 | 1219 | 2169 | 77.93 |
| 2 | Ward No. 2 | 02.72 | 4280 | 1248 | -70.84 |
| 3 | Ward No. 3 | 01.45 | 1034 | 4281 | 314.02 |
| 4 | Ward No. 4 | 00.70 | 3344 | 5521 | 65.10 |
| 5 | Ward No. 5 | 01.41 | 1578 | 2394 | 51.71 |
| 6 | Ward No. 6 | 03.40 | 542 | 960 | 77.12 |
| 7 | Ward No. 7 | 04.94 | 607 | 901 | 48.43 |
| 8 | Ward No. 8 | 01.33 | 1660 | 2669 | 60.78 |
| 9 | Ward No. 9 | 00.56 | 2798 | 4316 | 54.25 |
| 10 | Ward No. 10 | 00.97 | 2137 | 4080 | 90.92 |
| 11 | Ward No. 11 | 01.02 | 2142 | 2328 | 08.68 |
| 12 | Ward No. 12 | 00.39 | 5087 | 6515 | 28.07 |
| 13 | Ward No. 13 | 00.24 | 4767 | 12800 | 168.51 |
| 14 | Ward No. 14 | 00.20 | 9200 | 13910 | 51.20 |
| 15 | Ward No. 15 | 00.39 | 4392 | 6146 | 39.94 |
| 16 | Ward No. 16 | 00.79 | 1490 | 4516 | 203.09 |
| 17 | Ward No. 17 | 01.20 | 1347 | 3384 | 151.22 |
| 18 | Ward No. 18 | 01.01 | 3184 | 2995 | -05.94 |
| 19 | Ward No. 19 | 00.45 | 4198 | 6689 | 59.34 |
| 20 | Ward No. 20 | 00.24 | 5917 | 10979 | 85.55 |
| 21 | Ward No. 21 | 00.26 | 5119 | 10212 | 99.49 |
| 22 | Ward No. 22 | 00.21 | 5524 | 13638 | 146.89 |
| 23 | Ward No. 23 | 00.16 | 11037 | 14344 | 29.96 |
| 24 | Ward No. 24 | 00.49 | 4531 | 7945 | 75.35 |
| 25 | Ward No. 25 | 00.98 | 2177 | 3809 | 74.97 |
| 26 | Ward No. 26 | 00.97 | 2526 | 4251 | 68.29 |
| 27 | Ward No. 27 | 00.33 | 4915 | 7915 | 61.04 |
| 28 | Ward No. 28 | 00.28 | 7257 | 12621 | 73.91 |
| 29 | Ward No. 29 | 00.18 | 9433 | 16667 | 76.69 |
| 30 | Ward No. 30 | 00.16 | 8088 | 14038 | 73.57 |
| 31 | Ward No. 31 | 00.13 | 10731 | 40731 | 279.56 |
| 32 | Ward No. 32 | 00.20 | 5650 | 13960 | 147.08 |
| 33 | Ward No. 33 | 00.40 | 3662 | 8833 | 141.21 |
| 34 | Ward No. 34 | 00.92 | 2922 | NA | NA |
| 35 | Ward No. 35 | 00.67 | 5315 | NA | NA |
| 36 | Ward No. 36 | 00.40 | 4480 | NA | NA |
| 37 | Ward No. 37 | 00.35 | 6800 | NA | NA |
| 38 | Ward No. 38 | 00.65 | 3335 | NA | NA |
| 39 | Ward No. 39 | 00.61 | 2844 | NA | NA |
| 40 | Ward No. 40 | 00.56 | 3286 | NA | NA |
| Total City | 31.4 | 2496 | 3536 | 41.67 |
Table text extracted from the original PDF; superscript letters are shown inline. The original table image is below.
View original table image
References
4 in the original paper- Census of India, District Census Handbook Nandurbar District; c1951 to 2011.
- Sita K. 'Spatial Pattern of Scheduled Caste Tribes in Maharashtra', the Geographer. 1986;37(1):53-59.
- Krishan G. Distribution and Density of Population in Upper Bari Doab, Punjab (India), National Geographer. 1971;6(1):31-36.
- Rai S. Pattern of Population Density in an Indian City, National Geographical Journal of India. 1996;42(3&4):237-247.