
Research article · 2024 · Full text
International Journal of Agriculture Extension and Social DevelopmentCurrent status and mapping of districts for agricultural vulnerability to climatic change in Maharashtra
Volume 7(2) · Pages 331–336 · DOI: 10.33545/26180723.2024.v7.i2e.342 ↗
Research areasClimate change impacts on agricultureAgricultural Economics and PracticesAgricultural risk and resilience
Abstract
Author-writtenVulnerability of a system is determined not only by the severity of climate change but also by the system’s own sensitivity and adaptive capacity to cope with new change in climatic condition. This study while examining the agricultural vulnerability of Maharashtra State in India to climate change, tries to improve upon the vulnerability assessment methodology. It chooses the district level data on climate and socio-economic indicators to compute potential impact and vulnerability index, conceptualized as a combination of crop production loss, sensitivity, exposure and adaptive capacity index. Kumar et al. (2016) method was adopted for estimating crop production loss. In order to determine the net effect of climate variations, both area and yield were first de-trended using a linear model. The normalized indicators are assigned weights based on inverse of variance in each district with respect to the State. The weighted component indicators are then aggregated into a single index. In addition this study also categorizes the districts beyond ranking to have a meaningful characterization of the different stages of vulnerability. The present study found 7 out of 34 districts were highly vulnerable to the changing climatic conditions with Sindhudurg, Thane and Palghar having the highest degree of vulnerability. It reveals the fact that all districts in an agro climatic zone does not fall under the same category of vulnerability which exemplifies the need for the State to prioritize research and development issues and effective decision making through “Location-Performance-Vulnerability” based adaptation strategies.
Summary
Source-checkedPlain-language reading of the full paper, prepared with AI and checked against the text. Each point links to the authors' own words.
Why it matters
- Agricultural vulnerability is not just about the severity of climate change, but also depends on a system's sensitivity and its capacity to adapt to new conditions. View evidence ↗
- In Maharashtra, climate change poses a significant threat to rural development, food security, and agriculture, which limits the ability of districts to adapt. View evidence ↗
The question
- The study aims to examine the agricultural vulnerability of Maharashtra, India, to climate change while attempting to improve the methodology used for assessment. View evidence ↗
What they did
- The researchers used district-level climate and socio-economic data to calculate a vulnerability index based on exposure, sensitivity, adaptive capacity, and crop production loss. View evidence ↗
- Daily average rainfall data for districts was collected over a 40-year period from 1980 to 2021. View evidence ↗
- The Agricultural Vulnerability Index (AVI) was calculated by summing exposure, sensitivity, and crop production loss, then subtracting the adaptive capacity. View evidence ↗
What they found
- Between 1980 and 2020, Palghar had the highest exposure score (0.5657), while Latur had the lowest (0.2936). View evidence ↗
- Thane was the most sensitive district (0.2878) due to population density and urbanization, whereas Yavatmal was the least sensitive (0.1388). View evidence ↗
- Nashik exhibited the highest adaptive capacity (0.4434) due to better infrastructure and mechanization, while Dhule had the lowest (0.1891). View evidence ↗
- Jalna experienced the highest crop production loss index (0.1051), particularly in pulses and cereals, while Palghar had the lowest (0.0025). View evidence ↗
- Sindhudurg was identified as the most vulnerable district with a score of 0.5285, while Yavatmal was the least vulnerable with a score of 0.0853. View evidence ↗
- Seven of the 34 districts were found to be highly vulnerable, with the highest degrees of vulnerability seen in Palghar, Thane, and Sindhudurg. View evidence ↗
What it means
- The authors conclude that because vulnerability varies even within the same agro-climatic zone, the state should implement adaptation strategies based on location, performance, and vulnerability. View evidence ↗
- The authors recommend mitigating climate impacts by expanding irrigation on dry-land farms, increasing mechanization, adopting new technologies, and educating farmers. View evidence ↗
Visual summary
3 visualsIllustrations explain the paper; charts are replotted from the paper's own table values.
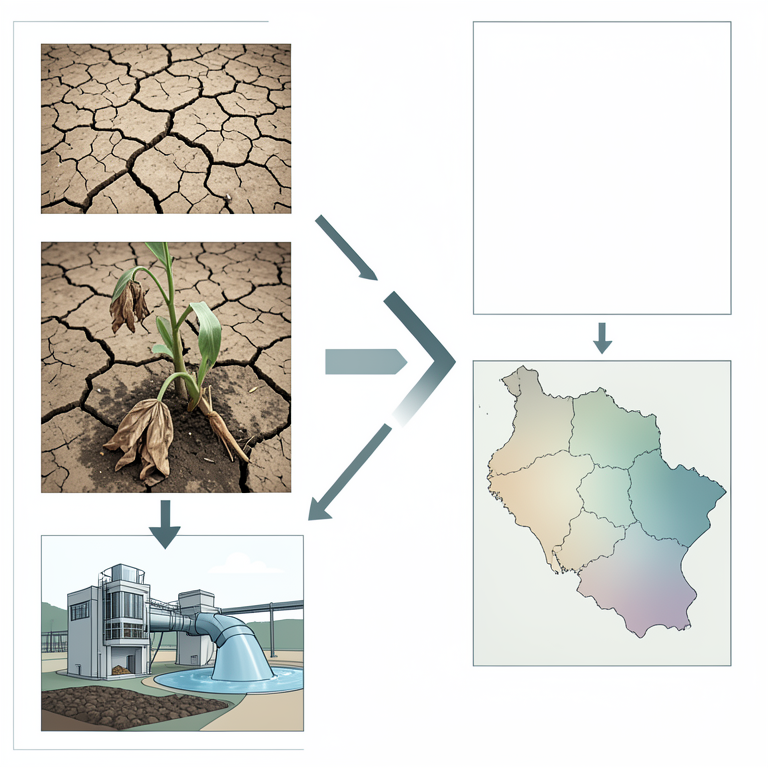
Vulnerability Index Components
AI-generated conceptual illustration (Agricultural landscapes of Maharashtra, India). It explains the idea and does not show study data.
View source evidence ↗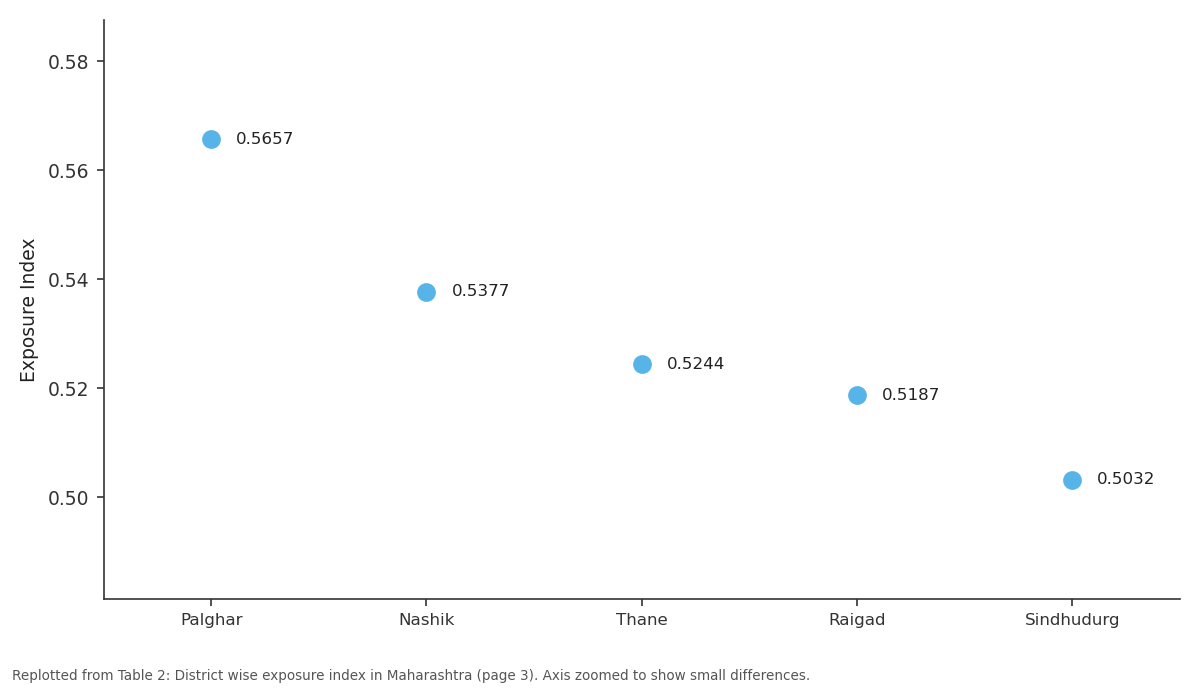
Exposure Index: Palghar vs Nashik vs Thane vs Raigad vs Sindhudurg
Replotted from Table 2 (page 3) of the original paper. Every bar is the paper's own table value.
View source evidence ↗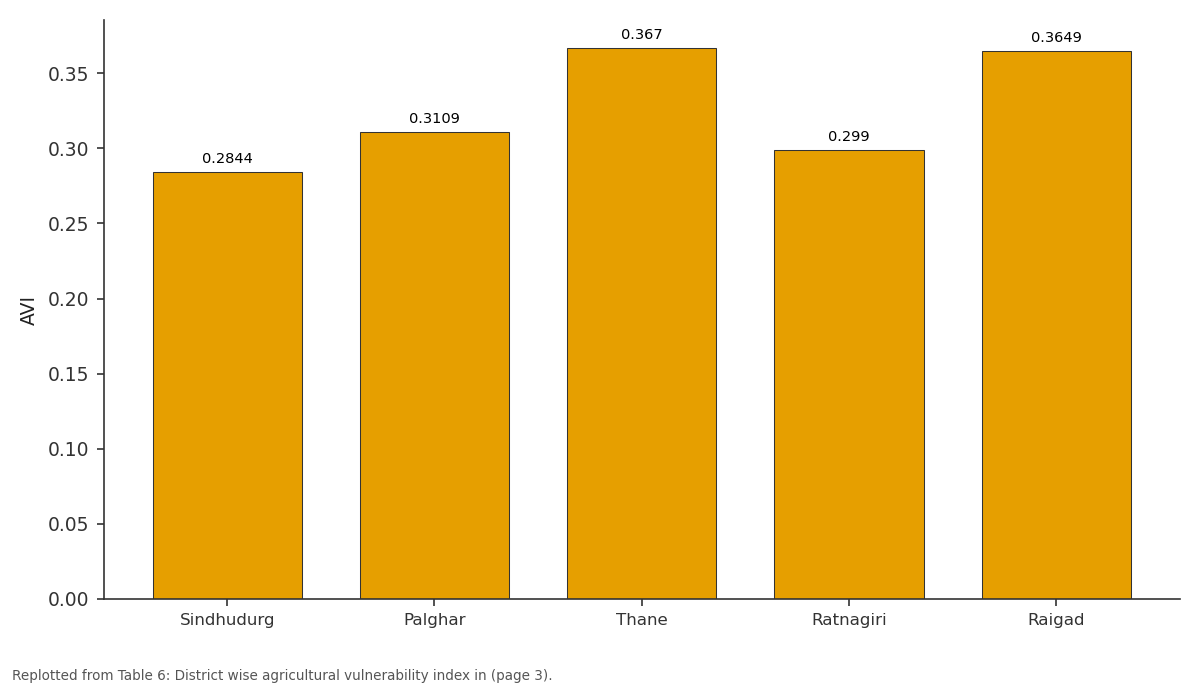
ACI: Sindhudurg vs Palghar vs Thane vs Ratnagiri vs Raigad
Replotted from Table 6 (page 3) of the original paper. Every bar is the paper's own table value.
View source evidence ↗Figures & tables
From the original paper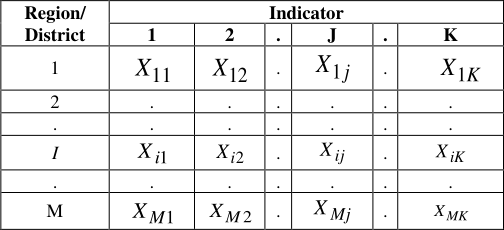 Table 1
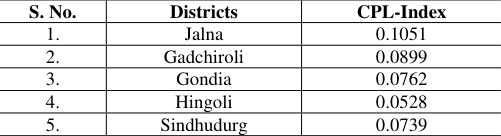 Table 4
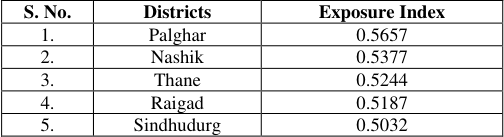 Table 2
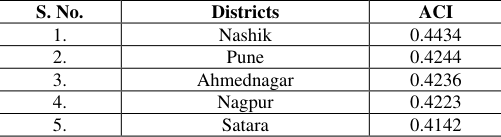 Table 5
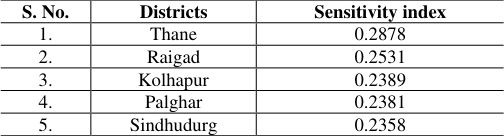 Table 3
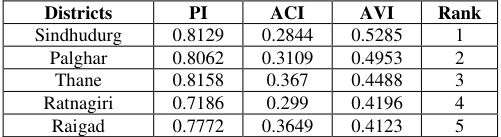 Table 6
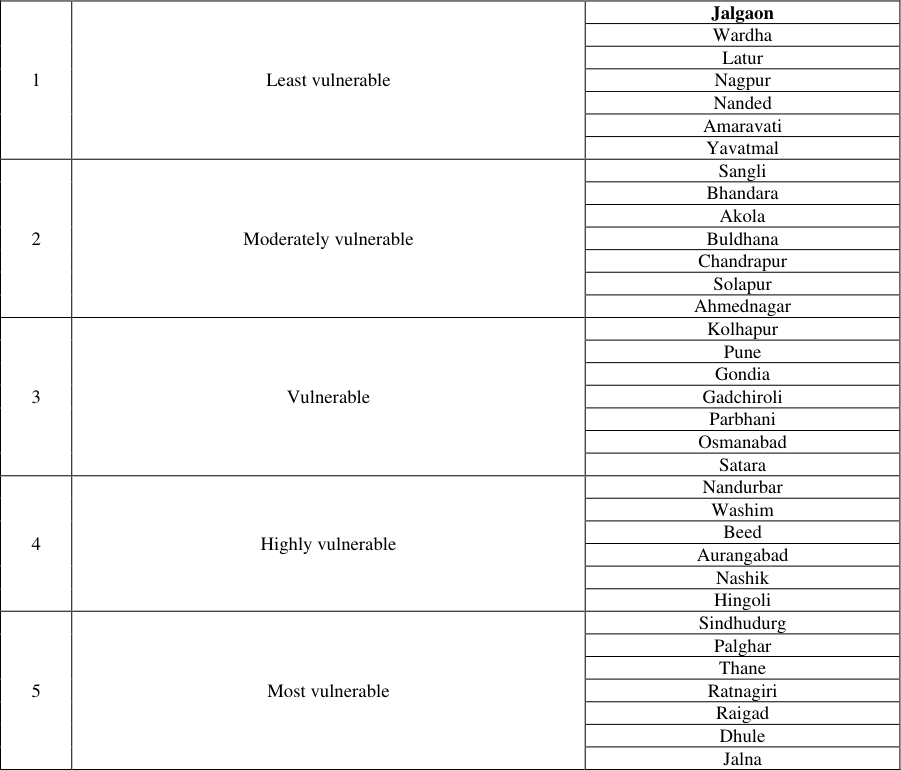 Table 7
Introduction
Numerous studies on socioeconomic vulnerability to climate change employ diverse methodologies and indicators. Regional assessments often follow the IPCC approach, with modifications for local contexts. Brenkert and Malone (2005) [2] used the Vulnerability-Resilience Indicator Prototype, adapted for Indian dietary customs and freshwater data, finding nine states somewhat resilient. Das (2013) [4] examined regional vulnerability in Indian agriculture, producing a Socio-Economic Vulnerability Index based on indicators like irrigation strength and poverty. Focused on city-level vulnerability, categorizing indicators into infrastructure, technology, finance, social, and space. Studied Mumbai's fishing communities, revealing vulnerability due to resource limitations. Ayanlade et al. (2018) explored rainfall variability in African agro-climatic zones, while assessed agrarian vulnerability in Maharashtra. Developed a socio-economic vulnerability index, and found drought impacting household nutrition. Studied farmers' perceptions in Bundelkhand. mapped drought-related climate change in Tamil Nadu, revealing varying vulnerability across districts.
Materials and Methods
Materials and Methods
The choice of vulnerability indicators Exposure indicators
Trends in kharif, rabi and zaid rainfall Trends in kharif, rabi and zaid relative humidity Trends in kharif, rabi and zaid maximum temperature. Trends in kharif, rabi and zaid minimum temperature.
Sensitivity indicators
Average size of operational holdings for marginal farmers (%) Average size of operational holdings for small farmers (%) Density of population (Number) Percent of gross irrigated area to gross cropped area Net Sown Area (ha) Urbanization (%) Average size of holding (ha) Percentage of main workers to the total population (%) Total bovine population (Per ha.) Cropping intensity (%) www.extensionjournal.com
Percent of small and marginal farmers
Percent of small and marginal farmers
Crop Production Loss
Total cereal production loss Total pulses production loss Total oilseeds production loss Total cash crops production Total fruits and vegetables production loss.
Adaptive capacity indicators and their relationships
Forest area to the geographical area FERT/"00" ha GCA Number of tractors No. of markets/ "00" GCA Road density Electric pump Rural electrification Literacy (%)
Arrangement of data
Data for sector-wise and composite vulnerability, with M districts and K indicators, are organized in a rectangular matrix. Each row represents a region, and each column represents an indicator, denoted as Xij for the value of indicator j in region i.
Normalisation of indicators / variables
The methodology developed by Anand and Sen (1994) for calculation of Human Development Index and used by UNDPs for preparation of Human Development Index report (HDI) for the year 2006 was used to normalise the indicators. The normalised indicators were laid in between 0 to 1. Formulae to normalise the variable having positive and negative functional relationship with vulnerability are as follows:
For positive functional relation
For negative functional relation
The value 1 corresponds to that region with maximum vulnerability and 0 correspond to the region with minimum vulnerability.
Construction of Vulnerability Index (Unequal Weight)
After normalising the indicators, the weights are assumed to vary inversely as the variance over the regions/districts in the respective indicators of vulnerability. That is, the weight j w is determined by
. The vulnerability index so computed was laid between 0 and 1. A value of one indicated maximum vulnerability and zero indicated no vulnerability at all.
Aggregation of component indices
Potential Impact (PIi) -Exposure i+ Sensitivity i + Crop production loss i AVIi = (Exposure + Sensitivity + (1 -Adaptive capacity)
Ranking of districts
The calculated vulnerability indices were used to rank the different districts in terms of vulnerability. A district with highest index is said to be most vulnerable and it was given the rank 1, the district with next highest index was assigned rank 2 and so on.
Classification of districts
For classificatory purpose, a simple ranking of the districts based on their respective index would be enough. However for a meaningful characterization of different stages of vulnerability, suitable fractile classification from an assumed distribution is needed (Palanisami et al. 2010) [13] . Beta distribution, a continuous probability distribution is suitable for this purpose. It is generally skewed and takes values in the interval (0, 1), parameterized by two shape parameters, denoted by α and β (Iyengar and Sudarshan 1982) [9] .
Mapping of Districts
With the help of Q-GIS, spatial data for each of the variables was processed to create a set of single-factor maps. Based on the map, The vulnerability of each area will be assessed and locate several high risk areas to low risk areas (1 to 0). Identifying the risks in each case and associating them with a specific region will be useful for decision makers. www.extensionjournal.com
Results and Discussion
District wise exposure index in Maharashtra Exposure scores calculated from 1980 to 2020 indicate Palghar with the highest (0.5657) and Latur with the lowest (0.2936) exposure in Maharashtra. Thane, Raigad, Sindhudurg, and Nashik are most vulnerable due to increased kharif rainfall, relative humidity, and temperatures, mainly in the coastal region. Conversely, districts like Amaravati, Gadchiroli, Yavatmal, and others in central Maharashtra and Vidarbha exhibit lower exposure due to consistent climatic conditions.
District wise crop production loss index in Maharashtra
Jalna tops district-level crop production loss (0.1051), with significant losses in cereals and pulses. Palghar ranks lowest (0.0025). Godia and Gadchiroli are highly susceptible, facing substantial losses in various crops. Sindhudurg is at risk due to notable losses in pulses and oilseeds. Hingoli is vulnerable with significant output losses in cash crops, fruits, and vegetables. Yavatmal, Sangli, Kolhapur, Wardha, Raigad, Nagpur, Thane, Washim, and Palghar are least vulnerable with comparatively lower crop production losses.
Agricultural Vulnerability Index (AVI) of a district
Sindhudurg is the most vulnerable district (VI score 0.5285) due to low adaptive capacity (28th rank) and high exposure, sensitivity, and crop production loss index (CPLI) scores. Yavatmal is the least vulnerable (VI score 0.0853). Palghar, Thane, Ratnagiri, Raigad, Dhule, and Jalna fall under the 'extreme degree' of vulnerability. Palghar, Thane, Ratnagiri, and Raigad are highly exposed and sensitive, while Dhule and Jalna have low adaptive capacity. Yavatmal, Amaravati, Nanded, Nagpur, Latur, Wardha, and Jalgaon exhibit low vulnerability due to low exposure and high adaptive capacity. AVIi = (Exposure i + Sensitivity i + Crop production loss i) -Adaptive capacity i
Figures and tables from the paper
| S. No. | Districts | CPL-Index |
|---|---|---|
| 1. | Jalna | 0.1051 |
| 2. | Gadchiroli | 0.0899 |
| 3. | Gondia | 0.0762 |
| 4. | Hingoli | 0.0528 |
| 5. | Sindhudurg | 0.0739 |
Table text extracted from the original PDF; superscript letters are shown inline. The original table image is below.
View original table image
| S. No. | Districts | Exposure Index |
|---|---|---|
| 1. | Palghar | 0.5657 |
| 2. | Nashik | 0.5377 |
| 3. | Thane | 0.5244 |
| 4. | Raigad | 0.5187 |
| 5. | Sindhudurg | 0.5032 |
Table text extracted from the original PDF; superscript letters are shown inline. The original table image is below.
View original table image
| S. No. | Districts | ACI |
|---|---|---|
| 1. | Nashik | 0.4434 |
| 2. | Pune | 0.4244 |
| 3. | Ahmednagar | 0.4236 |
| 4. | Nagpur | 0.4223 |
| 5. | Satara | 0.4142 |
Table text extracted from the original PDF; superscript letters are shown inline. The original table image is below.
View original table image
| S. No. | Districts | Sensitivity index |
|---|---|---|
| 1. | Thane | 0.2878 |
| 2. | Raigad | 0.2531 |
| 3. | Kolhapur | 0.2389 |
| 4. | Palghar | 0.2381 |
| 5. | Sindhudurg | 0.2358 |
Table text extracted from the original PDF; superscript letters are shown inline. The original table image is below.
View original table image
| Districts | PI | ACI | AVI | Rank |
|---|---|---|---|---|
| Sindhudurg | 0.8129 | 0.2844 | 0.5285 | 1 |
| Palghar | 0.8062 | 0.3109 | 0.4953 | 2 |
| Thane | 0.8158 | 0.367 | 0.4488 | 3 |
| Ratnagiri | 0.7186 | 0.299 | 0.4196 | 4 |
| Raigad | 0.7772 | 0.3649 | 0.4123 | 5 |
Table text extracted from the original PDF; superscript letters are shown inline. The original table image is below.
View original table image
| 1 | Least vulnerable | Jalgaon |
|---|---|---|
| Wardha | ||
| Latur | ||
| Nagpur | ||
| Nanded | ||
| Amaravati | ||
| Yavatmal | ||
| 2 | Moderately vulnerable | Sangli |
| Bhandara | ||
| Akola | ||
| Buldhana | ||
| Chandrapur | ||
| Solapur | ||
| Ahmednagar | ||
| 3 | Vulnerable | Kolhapur |
| Pune | ||
| Gondia | ||
| Gadchiroli | ||
| Parbhani | ||
| Osmanabad | ||
| Satara | ||
| 4 | Highly vulnerable | Nandurbar |
| Washim | ||
| Beed | ||
| Aurangabad | ||
| Nashik | ||
| Hingoli | ||
| 5 | Most vulnerable | Sindhudurg |
| Palghar | ||
| Thane | ||
| Ratnagiri | ||
| Raigad | ||
| Dhule | ||
| Jalna |
Table text extracted from the original PDF; superscript letters are shown inline. The original table image is below.
View original table image
References
11 in the original paper- Balasubramanian TN, Arivudai Nambi A, Diya Paul. A suggested index assessment of vulnerability of a location to climate change. Journal of Agrometeorology. 2009;9(2):129-137.
- Brenkert AL, Malone EL. Modelling vulnerability and resilience to climate change a case study of India and Indian states. Climate Change. 2005;72:57-102.
- Cuddy JDA, Della Valle PA. Measuring the instability of time series data. Oxford Journal of Economics and Statistics. 1982;40(1):79-85.
- Das A. Mapping the regional variation in potential vulnerability in Indian agriculture to climate change - An exercise through constructing vulnerability index. African Journal of Environmental Science and Technology. 2013;7(4):112-121.
- Fusel HM. Vulnerability: A generally applicable conceptual framework for climate change research. Global Environmental Change. 2007;17:155-167.
- IPCC (Intergovernmental panel on Climate Change). Climate Change 2013: The Physical science basis. Contribution of working group I to the fifth assessment report of the Intergovernmental Panel on Climate Change. Cambridge University Press, Cambridge, United Kingdom and New York, NY, USA; c2013.
- Iyengar NS, Sudarshan P. A method of classifying regions from multivariate data. Economic and Political Weekly. 1982;Special Article:2048-52.
- O'Brien KL, Leichenko RM, Kelkar U, Venema HM, Aandahl G, Tompkins H, et al. Mapping vulnerability to multiple stressors: Climate change and globalization in India. Glob Environ Change. 2004;14:303-313.
- Swami D, Parthasarathy D. Dynamics of exposure, sensitivity, adaptive capacity and agricultural vulnerability at district scale for Maharashtra, India. Ecological Indicators; c2020. p. 121. DOI: 10.1016/j.ecolind.2020.107206.
- Tesso G, Emana B, Katema M. Analysis of vulnerability and resilience to climate change induced shocks in north Shewa, Ethiopia. Agricultural Sciences. www.extensionjournal.com 2012;3(6):871-888.
- Varadan JR, Kumar P. Mapping agricultural vulnerability of Tamil Nadu, India to climate change: A dynamic approach to take forward the vulnerability assessment methodology. Climatic Change. 2015;129(1-2):159-181.