
Research article · 2024 · Full text
International Journal of Agriculture Extension and Social DevelopmentInfluence of digital media on child behaviour of higher primary school children
Volume 7(2) · Pages 253–259 · DOI: 10.33545/26180723.2024.v7.i2d.351 ↗
Research areasChild Development and Digital Technology
Abstract
Author-writtenThe study conducted in Dharwad, Karnataka, aimed to evaluate the influence of digital media usage on child behaviour of higher primary school children. The research involved 240 students (120 urban and 120 rural) in 5th, 6th, and 7th grades from both private and government schools. Various tools, including a self-structured questionnaire for digital media usage, Child behavior checklist (CBCL) by Achenbach and Rescorla (2001), and the Socio-economic Status Scale, were employed. The findings indicated that 56.7% of children exhibited moderate digital media usage, 32.9% had high usage, and 10.4% had low usage. Smart TVs were the preferred device for the majority (37.9%), followed by smartphones (27.1%), tablets (19.2%), and computers (15.8%). The most-watched digital content included National Geographic Kids (22.1%), Disney Junior (21.7%), game apps (20.8%), social media (17.9%), and Nick Jr (17.5%). In terms of purpose, the majority used digital media for homework and school-related activities (25.0%), followed by entertainment and media consumption (22.1%). Gaming was the purpose for 16.3%, while only 10% used digital media for communication. Regarding time spent, the majority spent 1 to 2 hours (42.10%), followed by 3 to 4 hours (26.70%), with fewer spending less than 1 hour (19.60%), and a minority exceeding 4 hours (11.70%) on digital media activities. Children shows that 58.80 percent of children have borderline child behaviour, while 41.30 percent of children exhibit normal behaviour. Three-fourths (72.50%) of children exhibit borderline externalizing behaviour, while 27.50 percent of children display normal externalizing behaviour and none of fall in clinical externalizing behaviour The study identified a significant association and difference between digital media usage, time spent on digital media, child internalizing and externalizing behaviour among higher primary school children.
Summary
Source-checkedPlain-language reading of the full paper, prepared with AI and checked against the text. Each point links to the authors' own words.
Why it matters
- Global trends show high levels of daily connectivity, with some populations spending over 9 hours per day on connected devices. View evidence ↗
- Digital media can be a beneficial educational tool for children, helping them learn new skills and concepts. View evidence ↗
- Excessive digital media use may lead to sedentary lifestyles, obesity, and a reduction in critical face-to-face social interactions. View evidence ↗
The question
- The study aimed to evaluate how digital media usage influences the behavior of higher primary school children in Dharwad, Karnataka. View evidence ↗
What they did
- The study sampled 240 students (120 urban, 120 rural) from 8 private and government schools in grades 5 through 7. View evidence ↗
- Researchers used a self-structured questionnaire for media usage, a child behavior checklist, and a socio-economic status scale to collect data. View evidence ↗
What they found
- Most children (56.7%) showed moderate digital media usage, while 32.9% had high usage and 10.4% had low usage. View evidence ↗
- Smart TVs were the most preferred digital device (37.9%), followed by smartphones (27.1%), tablets (19.2%), and computers (15.8%). View evidence ↗
- The most common duration of digital media use was 1 to 2 hours (42.10%), with only 11.70% of children spending more than 4 hours. View evidence ↗
- Regarding internalizing behavior, 58.80% of children were categorized as borderline, while 41.30% were normal. View evidence ↗
- For externalizing behavior, 72.50% of children exhibited borderline behavior, and 27.50% displayed normal behavior. View evidence ↗
- A significant association and difference were found between the time spent on digital media and child internalizing behavior. View evidence ↗
- A significant association and difference were also observed between the time spent on digital media and child externalizing behavior. View evidence ↗
What it means
- The authors conclude that increased digital media usage is linked to negative behavioral changes, including aggression, depression, loneliness, and poor social interaction. View evidence ↗
- The authors recommend that schools conduct workshops to teach children how to critically evaluate online content and understand its impact on their behavior. View evidence ↗
Visual summary
1 visualsIllustrations explain the paper; charts are replotted from the paper's own table values.
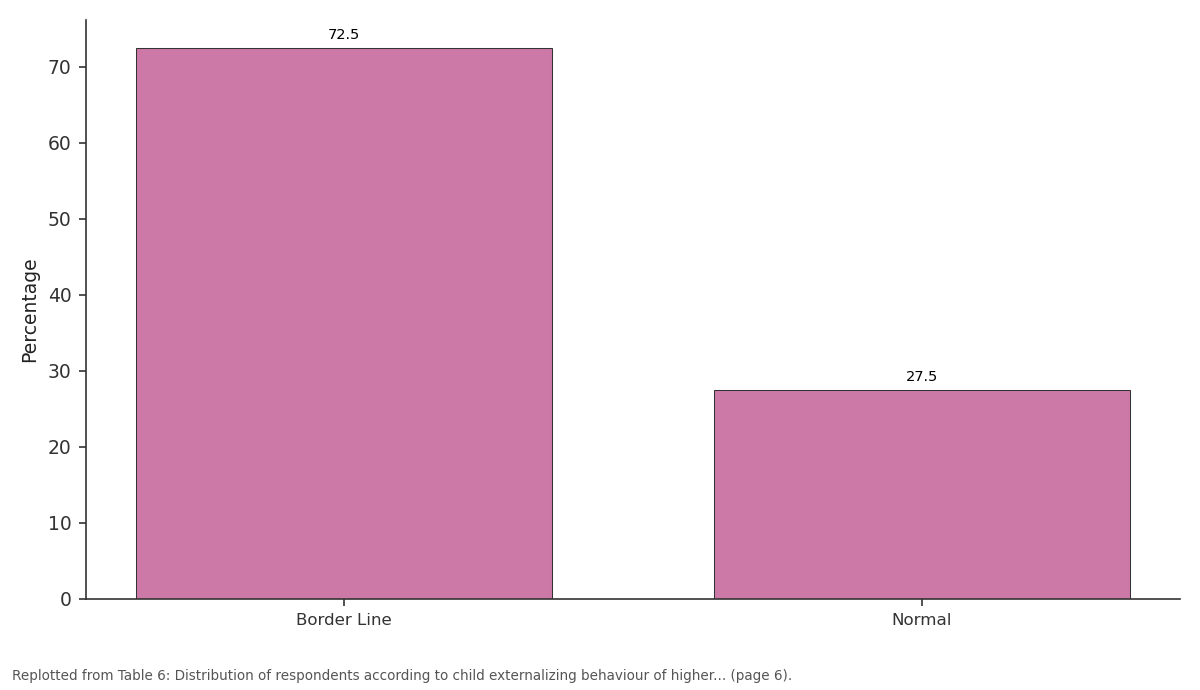
Percentage / -: Border Line vs Normal
Replotted from Table 6 (page 6) of the original paper. Every bar is the paper's own table value.
View source evidence ↗Figures & tables
From the original paper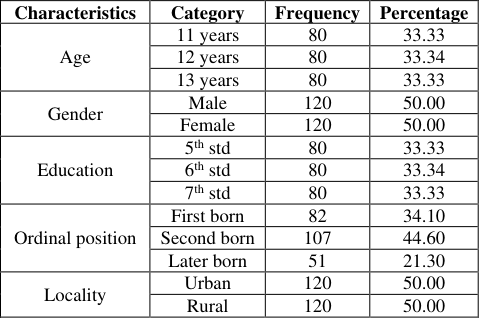 Table 1
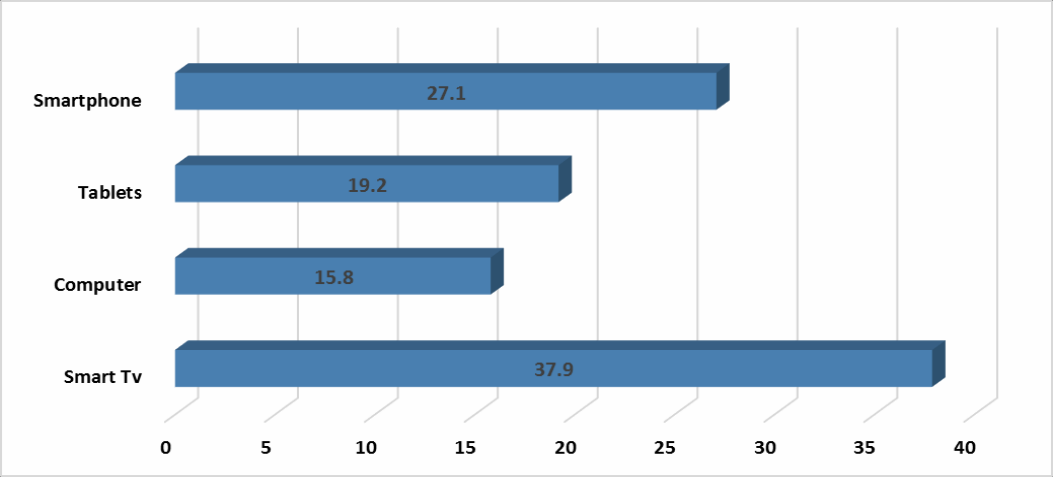 Figure 1
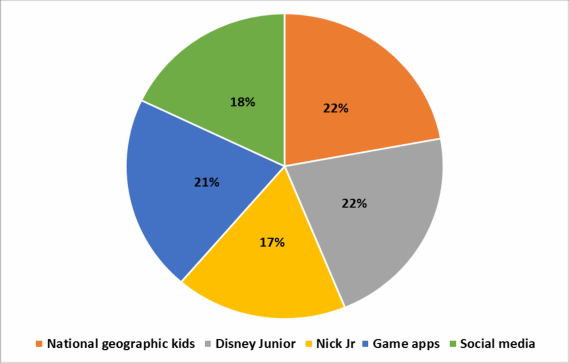 Figure 2
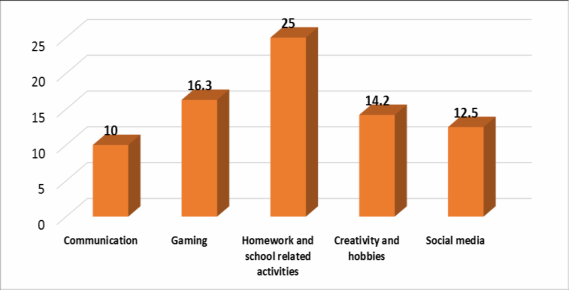 Figure 3
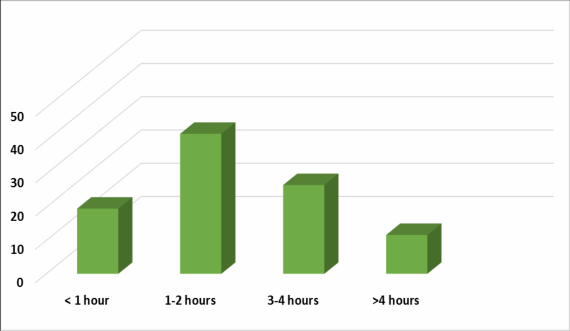 Figure 4
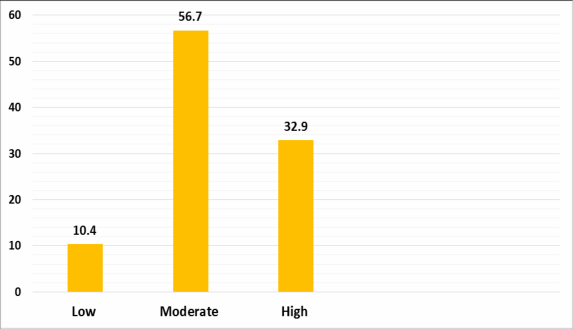 Figure 5
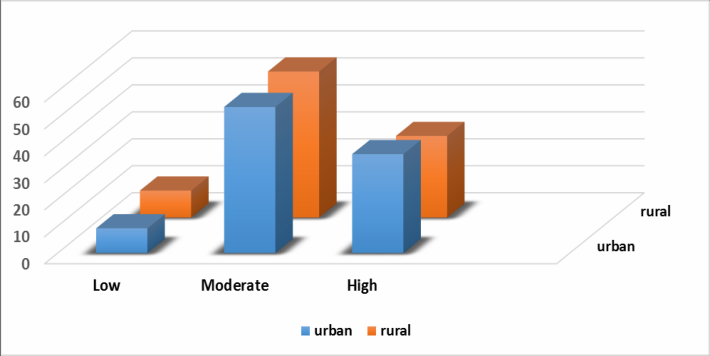 Figure 6
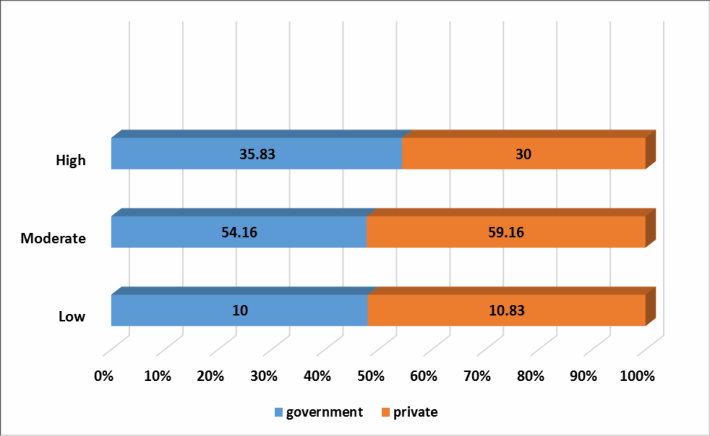 Figure 7
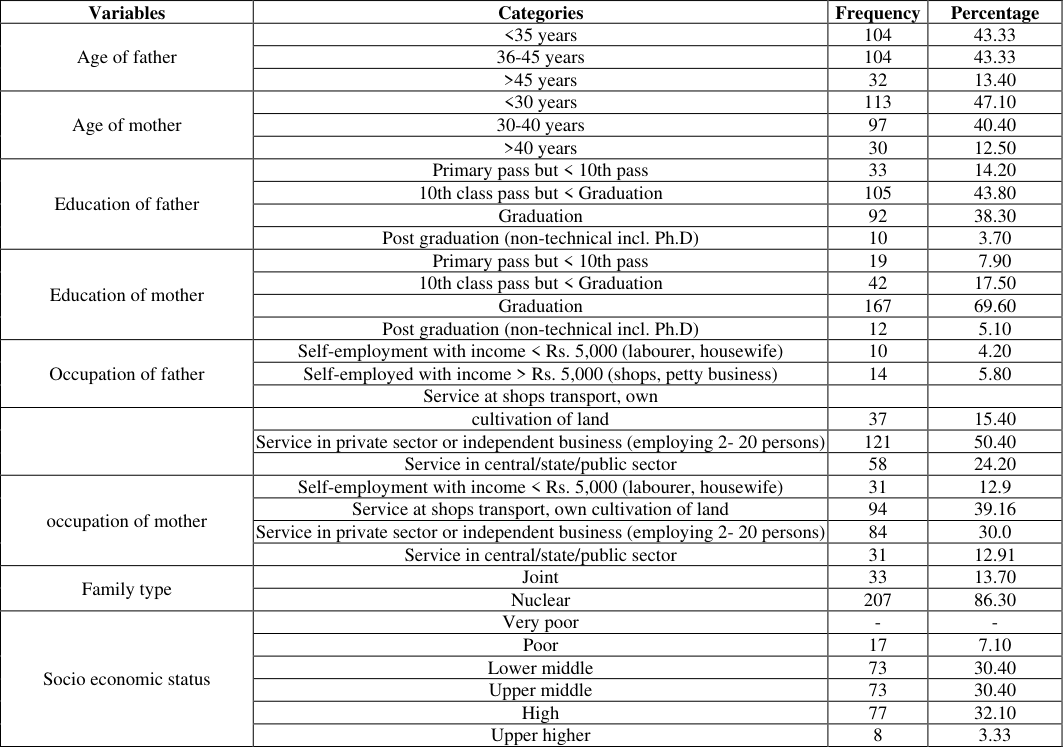 Table 2
 Table 3
 Table 4
 Table 5
 Table 6
 Table 7
 Table 8
Introduction
According to digital world 2023 recent research, South Africans are the most active online users, dedicating a significant 9 hours 30 minutes per day to connected devices and services. Brazil closely follows, with its internet users spending an average of 9 hours and 25 minutes per day, and the Philippines ranks third at 9 hours and 7 minutes daily. In contrast, Japan stands on the opposite end of the spectrum, where the average time spent online is just under 4 hours per day. Interestingly, TV consumption has seen a notable decline in recent months, with GWI's latest survey data indicating that internet users have reduced their TV viewing time by 13 minutes over the past year, resulting in a relative 6.1 percent drop-in time spent on both streaming and broadcast TV content. The use of digital media in children's lives offers a range of both advantages and potential drawbacks. When employed appropriately, digital media serves as a valuable educational tool, offering content that aids children in acquiring new skills, understanding concepts, and learning facts. Certain digital games and activities are designed to enhance problem-solving abilities, critical thinking, and spatial awareness, promoting cognitive development. Furthermore, digital platforms provide children with creative outlets through tools such as drawing programs and digital music creation, fostering self-expression and artistic exploration. However, it's important to recognize the potential negative consequences as well. Excessive screen time can lead to sedentary lifestyles, which, in turn, may contribute to health problems like obesity. Overindulgence in digital media can also reduce face-to-face social interactions, a critical component for children to develop essential social skills. Additionally, there's the risk of exposure to violent, explicit, or age-inappropriate content, which can have adverse effects on a child's emotional and psychological development. Furthermore, online spaces can sometimes become breeding www.extensionjournal.com grounds for cyberbullying, posing threats to a child's mental and emotional well-being.
Materials and Methodology
The population for the study comprised in higher primary school children in the age group of 11 -13 years studying in 5th -7th standard from schools of Dharwad taluk, Karnataka state.
The sample for the present study consisted of 240 students from 8 higher primary schools of Dharwad taluk, including private and government schools. Among them 120 students were four urban schools and 120 students from four rural schools studying in 5-7th standard of Dharwad taluk, Karnataka.
Data were collected through self-structured questionnaire used to assess digital media usage, child behaviour checklist and socio-economic status scale by Aggarwal et al. (2005)
Results
Table 1 presents the demographic characteristics of higher primary school, focusing on age. A uniform distribution of 33.33 percent was observed among the 11, 12, and 13 years age groups. The gender distribution was equally split, with males and females each constituting 50 percent of the participants. In terms of academic standard, 80.00 percent of the students hailed from 5th, 6th, and 7th grades in both government and private schools. As for ordinal position, 34.10 percent were first-born, 44.60 percent were secondborn, and 21.30 percent were born later. In relation to locality, an even split of 50.00 percent was observed between participants from rural and urban areas. Figure 1 shows children's preferred digital devices, with Smart TVs (37.9%) leading, followed by smartphones (27.1%), tablets (19.2%), and computers (15.8%). In Figure 2, the majority engage with National Geographic Kids (22.1%), Disney Junior (21.7%), game apps (20.8%), social media (17.9%), and Nick Jr (17.5%). Figure 3 reveals that many children use digital media for homework (25.0%), followed by entertainment (22.1%) and gaming (16.3%). Only 10% use digital media for communication. Figure 4 indicates that most children spend 1 to 2 hours (42.10%) on digital media, followed by 3 to 4 hours (26.70%), less than 1 hour (19.60%), with a small percentage (11.70%) dedicating more than 4 hours. Figure 5: Majority of respondents showed moderate digital media usage (56.7%), followed by high usage (32.9%), and a smaller proportion with low usage (10.4%). Figure 6 depicts urban children displayed predominantly moderate digital media usage (54.16%), followed by high usage (36.60%), and a minor percentage with low usage (9.16%). Similarly, rural children engaged in moderate usage (54.16%), high usage (30.25%), with a small percentage having low usage (10.0%). In Figure 7 government institutions, over half of the children had moderate digital media use (54.16%), followed by high usage (35.83%), and a minority with low usage (10.0%). Conversely, in private institutions, the majority had moderate usage (59.16%), high usage (30.00%), with a small percentage having low usage (10.83%). Regarding education, 14.20% of fathers had primary to < 10th pass education, 43.80% had 10th to < Graduation, 38.30% had Graduation, and 3.80% had post-graduation.
| Characteristics | Category | Frequency | Percentage |
|---|---|---|---|
| Age | 11 years | 80 | 33.33 |
| 12 years | 80 | 33.34 | |
| 13 years | 80 | 33.33 | |
| Gender | Male | 120 | 50.00 |
| Female | 120 | 50.00 | |
| Education | 5th std | 80 | 33.33 |
| 6th std | 80 | 33.34 | |
| 7th std | 80 | 33.33 | |
| Ordinal position | First born | 82 | 34.10 |
| Second born | 107 | 44.60 | |
| Later born | 51 | 21.30 | |
| Locality | Urban | 120 | 50.00 |
| Rural | 120 | 50.00 |
Table text extracted from the original PDF; superscript letters are shown inline. The original table image is below.
View original table image
For mothers, 7.90% had primary to < 10th pass education, 17.50% had 10th to < Graduation, 69.60% had Graduation, and 5.00% had post-graduation. Concerning occupation, 50.40% of fathers worked in the private sector, 24.20% in the central/state/public sector, 15.40% in services, transport, or cultivation, 5.80% were self-employed (> Rs. 5,000), and 4.20% were self-employed (< Rs. 5,000). For mothers, 39.16% were in services, transport, or cultivation, 30.0% were in the private sector or independent business, 12.91% in the central/state/public sector, and 12.91% were selfemployed (< Rs. 5,000). In terms of family type, 86.3% belonged to nuclear families, and 13.8% belonged to joint families. Regarding socio-economic status, 32.10% were upper middle class, 30.4% were lower middle class, 27.08% were high income class, 7.1% were in the poor category, and 3.33% were in the upper higher class. Table 5 presents association and comparison of time spent on digital media based on child internalizing behaviour of higher primary school children. In the less than 1hour digital media usage, 68.10 percent of respondents exhibited borderline internalizing behaviour, while 31.90 percent displayed normal internalizing behaviour. Further 1 -2 hours digital media usage category 45.50 percent of respondents had borderline internalizing behaviour, and 54.50 percent had normal internalizing behaviour. Among those using 3 -4 hours digital media category, 57.80 percent had borderline internalizing behaviour, and 42.20 percent exhibited normal internalizing behaviour. Further more than 4hours digital media usage category 92.90 percent of respondents had borderline internalizing behaviour, and 7.10 percent had normal internalizing behaviour. There was significant association (² -22.42**) at 1 percent level, and difference (F-5.170**) at 1 percent level, was observed between child internalizing behaviour and time spent on digital media among higher primary school children. Table 6 reveals the distribution of respondents according to the child's externalizing behaviour among higher primary school children. It shows that three-fourths (72.50%) of children exhibit borderline child behaviour, while 27.50 percent of children display normal behaviour and none of fall in clinical externalizing behaviour. Table 7 reveals association and comparison of digital device used based on child externalizing behaviour of higher primary school children. With respect to smart Tv usage, 73.60 percent of respondents exhibited externalizing borderline behaviour, while 26.40 percent displayed normal externalizing behaviour. Further Computer usage category 89.50 percent of respondents had externalizing borderline behaviour, and 10.50 percent had normal externalizing behaviour. Among those using Tablets category, 56.50 percent had borderline externalizing behaviour, and 43.50 percent exhibited normal externalizing behaviour. Further smartphone usage category 72.30 percent of respondents had borderline externalizing behaviour, and 27.70 percent had normal externalizing behaviour. There was significant association (² -11.441*) at 5 percent level, but there is no significant difference (F-2.170NS) was observed between child externalizing behaviour and type of digital devise among higher primary school children. Table 8 revels association and comparison of time spent in digital media activities based on child externalizing behaviour of higher primary school children With respect to less than 1hour digital media usage, 97.90 percent of respondents exhibited borderline externalizing behaviour, while 2.10 percent displayed normal externalizing behaviour. Further 1 -2 hours digital media usage category 70.30 percent of respondents had borderline externalizing behaviour, and 29.70 percent had normal externalizing behaviour. Among those using 3 -4 hours digital media category, 57.80 percent had borderline externalizing behaviour, and 42.20 percent exhibited normal externalizing behaviour. Further more than 4hours digital media usage category 71.40 percent of respondents had borderline externalizing behaviour, and 28.60 percent had normal externalizing behaviour. There was significant association (² -22.362) at 1 percent level, and difference (F-6.053**) at 1 percent level, was observed between child externalizing behaviour and time spent on digital media among higher primary school children.
| Time spent on digital media | Child externalizing behaviour | — | — | Modified ² | Mean ± SD | F-value |
|---|---|---|---|---|---|---|
| Borderline | Normal | Total | ||||
| < 1 hour | 46 | 1 | 47 | 22.362** | 66.72 ±1.87 | 6.053** |
| (97.90) | (2.10) | (100) | ||||
| 1 -2 hours | 71 | 30 | 101 | 63.92 ±5.42 | ||
| (70.30) | (29.70) | (100) |
Table text extracted from the original PDF; superscript letters are shown inline. The original table image is below.
View original table image
| Type of digital device use | Child externalizing behaviour | — | — | Modified ² | Mean ± SD | F-value |
|---|---|---|---|---|---|---|
| Borderline | Normal | Total | ||||
| Smart Tv | 67 | 24 | 91 | 11.441* | 64.24±5.58 | 2.170NS |
| (73.60) | (26.40) | (100) | ||||
| Computer | 34 | 4 | 38 | 66.05 ±2.91 | ||
| (89.50) | (10.50) | (100) | ||||
| Tablets | 26 | 20 | 46 | 63.63 ±4.94 | ||
| (56.50) | (43.50) | (100) | ||||
| Smartphone | 47 (72.30) | 18 (27.70) | 65 (100) | 65.00 ±4.94 |
Table text extracted from the original PDF; superscript letters are shown inline. The original table image is below.
View original table image
| Child externalizing behaviour | Frequency | Percentage |
|---|---|---|
| Clinical Range | - | - |
| Border Line | 174 | 72.50 |
| Normal | 66 | 27.50 |
| Total | 240 | 100.0 |
Table text extracted from the original PDF; superscript letters are shown inline. The original table image is below.
View original table image
| Time spent on digital media | Child internalizing behaviour | — | — | Modified ² | Mean ± SD | F-value |
|---|---|---|---|---|---|---|
| Borderline | Normal | Total | ||||
| < 1 hour | 32 (68.10) | 15 (3.19) | 47 (100) | 24.42** | 64.81 ±3.36 62.17 ±5.96 63.28 ±5.47 65.79 ±2.84 | 5.17** |
| 1 -2 hours | 46 (45.50) | 55 (54.50) | 101 (100) | |||
| 3-4 hours | 37 (57.80) | 27 (42.20) | 64 (100) | |||
| >4 hours | 26 (92.60) | 2 (7.10) | 28 (100) |
Table text extracted from the original PDF; superscript letters are shown inline. The original table image is below.
View original table image
Discussion
There was significant association but no significant difference observed between child internalizing behaviour and type of digital device used by higher primary school children (Table 4). The reason might be exposure to violent, frightening, or distressing content in video games, movies, or on social media can lead to increased anxiety and fear among children. Children often compare themselves with others on the type of digital devices used. Unfavorable comparisons can lead to feelings of inadequacy, inferiority and low self-esteem. Marshall et al. (2004) [2] reported relationships between sedentary behaviour and watching TV, video/computer games. Paik et al. (2016) [4] also found positive correlation between exposure to television violence and manifestation of aggressive behaviour. Furthermore, the study also indicated influence of television violence on the antisocial behaviour. Mathers et al. (2010) [3] also found association between the duration of specific media exposures and internalizing behaviour. High video game use was linked to poorer health status and increased levels of depression and anxiety. There was significant association and difference observed between child internalizing behaviour and time spent on digital media among higher primary school children (Table 5). The reason might be prolonged screen time leading to sedentary lifestyle, which is associated with various health issues, including internalizing behaviours like anxiety and depression. The more time spent on digital media, the greater the potential impact on mental health. Excessive use of digital media can lead to social isolation as children spend more time online and less time engaging with peers in person. Twenge et al. (2020) [6] reported that the amount of time spent on social media and internet use was more strongly correlated with self-harm behaviours, depressive symptoms, low life satisfaction, and low self-esteem compared to hours spent on electronic gaming and TV watching. These results emphasize the differential impact of various screen time activities on mental health. Svensson et al. (2022) [5] reported that among the social media activities studied, only chatting and self-presentation involving posting information about themselves was positively linked to internalizing symptoms. The present study found a significant association between externalizing behaviour and the type of digital device used (Table 6), as well as a significant association and difference between child externalizing behaviour and the amount of time spent in digital media (Table 7). Different digital devices, such as smartphones, Tablets, computers, and gaming consoles, offer various forms of engagement and content. Some devices might be more conducive to activities that could potentially lead to externalizing behaviour, such as aggressive video games or social media platforms with negative interactions. Prolonged screen time may lead to a lack of physical activity and outdoor play, contributing to externalizing issues. The result of the study is supported by the research carried out by (Fors et al. 2019) [7] too found a stronger correlation between duration of electronic media use and depression as well as anxiety. Also, various categories of duration of electronic media exhibited differing associations with anxiety and depression; specifically, video gaming and video chatting demonstrated links with anxiety, whereas video watching displayed an association with depression.
| Type of digital device use | Child internalizing behaviour | — | — | Modified ² | Mean ± SD | F-value |
|---|---|---|---|---|---|---|
| Borderline | Normal | Total | ||||
| Smart Tv | 46 (50.50) | 45 (49.50) | 91 (100) | 16.528** | 62.91±5.43 | 2.130NS |
| Computer | 28 (73.70) | 10 (26.30) | 38 (100) | 64.82 ±4.73 | ||
| Tablets | 36 (78.30) | 10 (21.70) | 46 (100) | 64.30 ±5.69 | ||
| Smartphone | 31 (47.70) | 34 (52.30) | 65 (100) | 62.63 ±4.80 |
Table text extracted from the original PDF; superscript letters are shown inline. The original table image is below.
View original table image
Conclusion
Increased digital media usage was found to bring about negative changes in child behavior such as aggression, depression, loneliness and poor social interaction. Schools should conduct workshops and teach children to critically evaluate the content they encounter online. They should be made aware of the potential impact of media on their behavior. Parents should seek professional guidance if they observe signs of anxiety or behavioral changes in their children.
Figures and tables from the paper
| Variables | Categories | Frequency | Percentage |
|---|---|---|---|
| Age of father | <35 years | 104 | 43.33 |
| 36-45 years | 104 | 43.33 | |
| >45 years | 32 | 13.40 | |
| Age of mother | <30 years | 113 | 47.10 |
| 30-40 years | 97 | 40.40 | |
| >40 years | 30 | 12.50 | |
| Education of father | Primary pass but < 10th pass | 33 | 14.20 |
| 10th class pass but < Graduation | 105 | 43.80 | |
| Graduation | 92 | 38.30 | |
| Post graduation (non-technical incl. Ph.D) | 10 | 3.70 | |
| Education of mother | Primary pass but < 10th pass | 19 | 7.90 |
| 10th class pass but < Graduation | 42 | 17.50 | |
| Graduation | 167 | 69.60 | |
| Post graduation (non-technical incl. Ph.D) | 12 | 5.10 | |
| Occupation of father | Self-employment with income < Rs. 5,000 (labourer, housewife) | 10 | 4.20 |
| Self-employed with income > Rs. 5,000 (shops, petty business) | 14 | 5.80 | |
| Service at shops transport, own | |||
| cultivation of land | 37 | 15.40 | |
| Service in private sector or independent business (employing 2- 20 persons) | 121 | 50.40 | |
| Service in central/state/public sector | 58 | 24.20 | |
| occupation of mother | Self-employment with income < Rs. 5,000 (labourer, housewife) | 31 | 12.9 |
| Service at shops transport, own cultivation of land | 94 | 39.16 | |
| Service in private sector or independent business (employing 2- 20 persons) | 84 | 30.0 | |
| Service in central/state/public sector | 31 | 12.91 | |
| Family type | Joint | 33 | 13.70 |
| Nuclear | 207 | 86.30 | |
| Socio economic status | Very poor | - | - |
| Poor | 17 | 7.10 | |
| Lower middle | 73 | 30.40 | |
| Upper middle | 73 | 30.40 | |
| High | 77 | 32.10 | |
| Upper higher | 8 | 3.33 |
Table text extracted from the original PDF; superscript letters are shown inline. The original table image is below.
View original table image
| Child internalizing behaviour | Frequency | Percentage |
|---|---|---|
| Clinical Range | - | - |
| Border Line | 141 | 58.8 |
| Normal | 99 | 41.3 |
| Total | 240 | 100.0 |
Table text extracted from the original PDF; superscript letters are shown inline. The original table image is below.
View original table image
References
6 in the original paper- Marshall SJ, Biddle SJ, Gorely T, Cameron N, Murdey I. Relationships between media use, body fatness and physical activity in children and youth: a meta-analysis. International Journal of Obesity. 2004;28(10):12381246.
- Mathers M, Canterford L, Olds T, Hesketh K, Ridley K, Wake M, et al. Electronic media use and adolescent health and well-being: cross-sectional community study. Academic Pediatrics. 2010;9(5):307-314.
- Marshall SJ, Biddle SJ, Gorely T, Cameron N, Murdey I. Relationships between media use, body fatness and physical activity in children and youth: a meta-analysis. International Journal of Obesity. 2014;28(10):12381246
- Svensson R, Johnson B, Olsson A. Does gender matter? The association between different digital media activities and adolescent well-being. BMC Public Health. 2022;22(1):273.
- Twenge JM, Martin GN. Gender differences in associations between digital media use and psychological well-being: Evidence from three large datasets. Journal of Adolescence. 2020;79:91-102.
- Fors PQ, Barch DM. Differential relationships of child anxiety and depression to child report and parent report of electronic media use. Child Psychiatry & Human Development. 2019;50:907-917.