
Research article · 2024 · Full text
International Journal of Research in AgronomySynthesis a mechanical harvester to increase performance efficiency and reduce losses
Volume 7(2) · Pages 309–312 · DOI: 10.33545/2618060x.2024.v7.i2e.320 ↗
Research areasIndustrial Automation and Control SystemsKnowledge Societies in the 21st CenturyElectric and Hybrid Vehicle Technologies
Abstract
Author-writtenUse of modern technologies in agricultural operations, especially in harvesting equipment for grain crops, has created a huge scientific breakthrough in reducing crop loss and increasing some properties. Experiment was conducted in one of the fields of Al-Shtrah 2022. This research studied Performance efficiency, total losses, loss threshing unit, and the amount of stalks scattered behind the harvester. The best Indicator involved three levels of harvester speeds (2.50, 3.50, 4.50 km. h-1), and levels of clearance between cylinder and concave (12, 15, 20) mm. Factorial Experiments under (RCPD) with three replications was used in the study. It was verified the superiority harvester speed 4.50 km.h-1 gets the highest performance efficiency 95% and less loss threshing unit 79%, while the speed 2.50 km.hr-1 gets less total losses 1.83% and loss threshing unit 1.24 kg.dunam-1, clearance cylinder and concave 12 mm gets the lowest percentage of total losses 2.41%, losses threshing unit 79%.
Summary
Source-checkedPlain-language reading of the full paper, prepared with AI and checked against the text. Each point links to the authors' own words.
Why it matters
- Mechanical harvesting is considered the best way for farmers to handle the challenges of harvesting grain crops. View evidence ↗
- Manual harvesting is often criticized by farmers for being labor-intensive and slow, which increases costs and reduces profits due to marketing delays. View evidence ↗
- While ideal total loss rates for wheat and barley are under 5%, losses in Iraq can be significantly higher, reaching up to 15%. View evidence ↗
The question
- The study aimed to evaluate performance efficiency, total losses, threshing unit losses, and the amount of stalks left behind the harvester. View evidence ↗
What they did
- The experiment was carried out in the Shatrah area of Iraq during the 2022 season. View evidence ↗
- A New Holland harvester was used, featuring a 4.0 m working width, a 0.56 m cylinder diameter, and a 1.3 m threshing cylinder width. View evidence ↗
What they found
- Increasing the harvester speed from 2.54 to 4.50 km/h improved performance efficiency from 91% to 95%. View evidence ↗
- The highest performance efficiency of 97% was achieved with a harvester speed of 4.5 km/h and a cylinder-concave clearance of 12 mm. View evidence ↗
- Higher harvester speeds led to increased total losses, rising from 1.83% at 2.54 km/h to 4.23% at 4.50 km/h. View evidence ↗
- Increasing the cylinder-concave clearance from 12 mm to 20 mm increased total losses from 2.41% to 3.25%. View evidence ↗
- The harvester speed of 4.50 km/h resulted in the lowest threshing unit losses (0.79%), compared to the highest losses of 1.48% at 2.5 km/h. View evidence ↗
- The lowest amount of stalks scattered behind the harvester was observed at a speed of 4.50 km/h (1.76 kg/dunam) and a clearance of 12 mm (1.20 kg/dunam). View evidence ↗
- The minimum amount of scattered stalks (1.08 kg/dunam) occurred with a speed of 2.5 km/h and a clearance of 12 mm. View evidence ↗
What it means
- The authors recommend using a harvester speed of 2.54 km/h and a cylinder-concave clearance of 12 mm. View evidence ↗
Visual summary
2 visualsIllustrations explain the paper; charts are replotted from the paper's own table values.
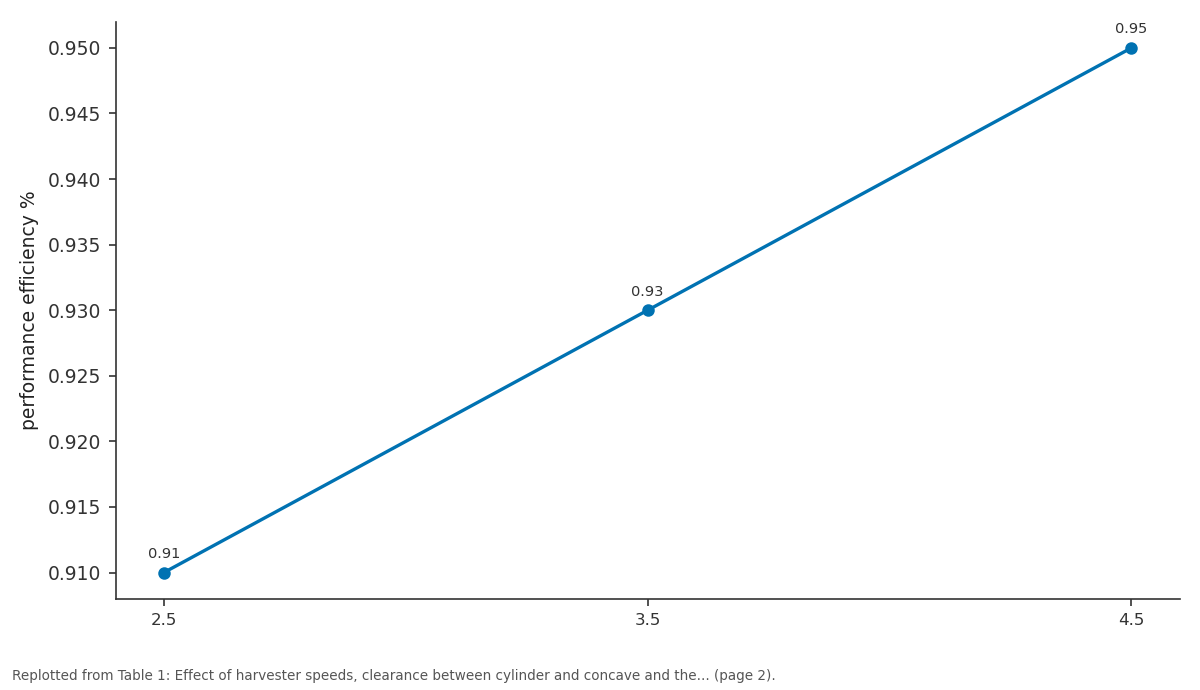
Average speeds: 2.5 vs 3.5 vs 4.5
Replotted from Table 1 (page 2) of the original paper. Every bar is the paper's own table value.
View source evidence ↗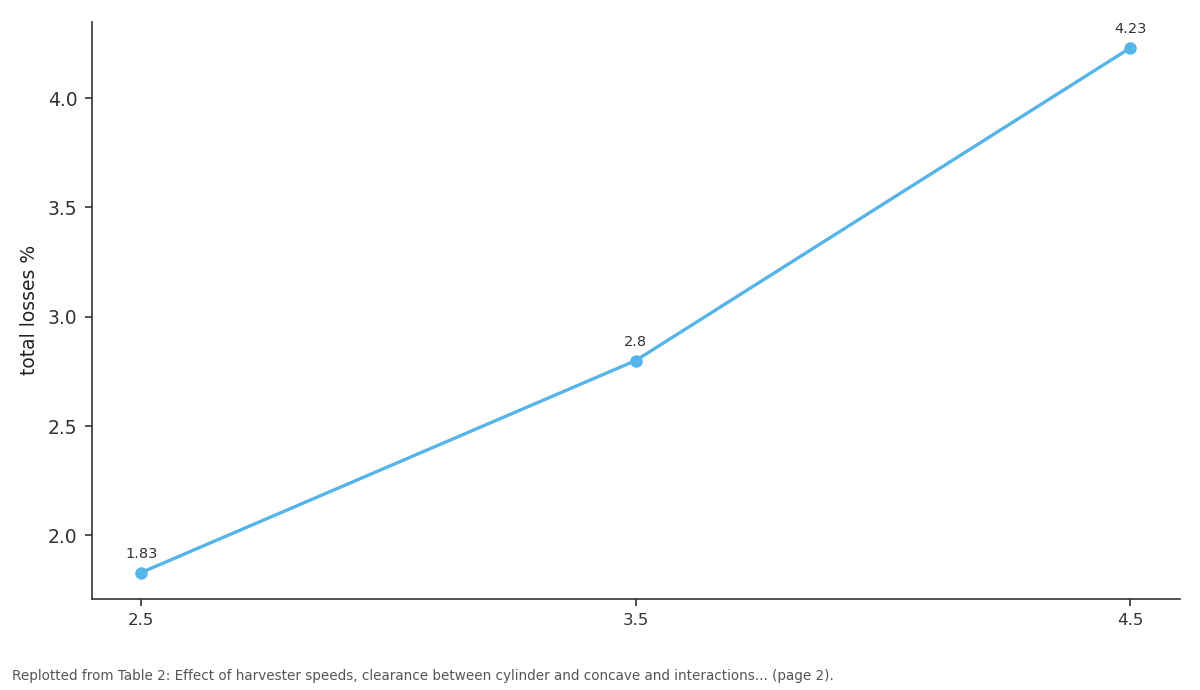
Average speeds: 2.5 vs 3.5 vs 4.5
Replotted from Table 2 (page 2) of the original paper. Every bar is the paper's own table value.
View source evidence ↗Figures & tables
From the original paper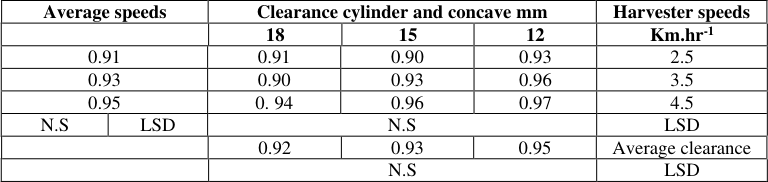 Table 1
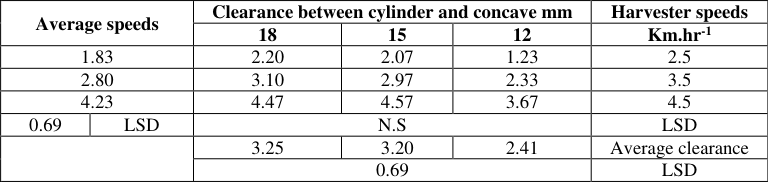 Table 2
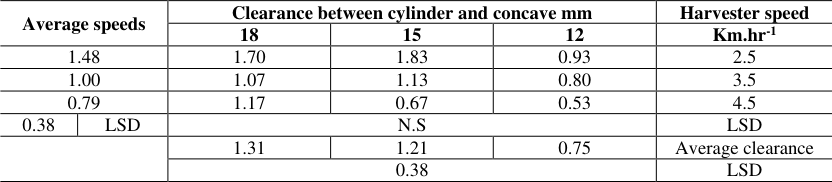 Table 3
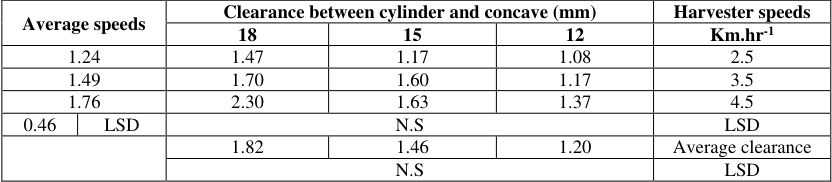 Table 4
Introduction
Mechanical harvesting is the ideal solution for farmers to overcome problems while harvesting various types of crops, especially grain crops. Some may be forced to harvest crops at the beginning of the season and before they mature in order to market them at high prices, especially with crops that are available in the markets on a seasonal basis (Petere 2016) [1] . Recently, there have been many complaints from farmers as a result of the effort expended in harvesting operations and the long period to complete the manual harvesting work (Sheikh &Houshyar 2010) [10] , which causes high costs and delays in marketing the crop, which reduces profits. (Benaseer et al., 2018) [11] The use of modern mechanization in all agricultural operations, including mechanical harvesting, has greatly helped in controlling the harvesting process, which reduced harvest time, which led to better exploitation of the land by the farmer in terms of planting and harvesting at the appropriate time (Albann 1998) [4] . Harvesting machines are considered among the most important mechanical field machines in terms of use, work average, and productivity, and they differ from one crop to another (Hamazah et al., 2020) [12] . The causes of crop loss are due to a number of cases, including mismanagement of the harvesting machine, failure to use the appropriate speed for work, the condition of the crop (Kumar et al., 2018) [14] , or lack of maintenance and organization of the harvester units. In good harvest operations, especially with regard to wheat and barley, the total losses rates are less than 5%, but in Iraq the percentage is greater and may reach 15% (Bin Abdullah 2019) [6] . One of the most important factors that affect increasing the efficiency of the harvester, especially when harvesting a wheat crop, is the moisture percentage of the plant (Albann, 1998) [4] . When it increases, there is a lack of good separation of the grains from the stalks, and a large portion of them remains with the remains of the stalks behind the harvester. However, if the moisture percentage is low or the grains are dry, in this case it will occur. Grain scatters in front of the harvester as a result of collision with the harvester's cutting unit. The moisture percentage of the wheat crop is 14-16% (Singh et al., 2001) [7] . The use of control systems with the harvester ensures high-quality performance of various technological operations, including the direction of the harvester through machine vision and external signal sensors for process residues during harvesting, which will lead to an increase in the harvester's productivity by 2-3 times (Mohammed & Jassim, 2021) [8] . The use of modern technologies gives a clear picture of field maps and the traffic of harvesters and other agricultural machines for their various uses in the field through the use of a monitoring system for the harvester and dividing the field in order to determine the areas of loss and the factors affecting the amount of crop losses (Alsammaraie and Saba, 2021) [2] . According to (Al-Jubouri et al. 2012) [2] , the speed of the harvester has a significant impact on the percentage of crop and grain loss, and its effect is on the cutting unit that is in direct contact with the crop through rotating or reciprocating moving parts. It was also indicated that the total loss from the threshing unit may reach 11% of Total gross product. losses in threshing unit increases due to the incorrect calibration for the clearance between cylinder and concave, as the lack of clearance with increasing speed of the cylinder leads to the broken of the grains and an increase in straw with the grains (Albann, 1997) [3] . Performance efficiency is defined as the ratio of separated grains (weight in grain tank) to the total amount of grains (total weight). It is expressed as a percentage and may reach 85% or more. It increases by increasing the speed of combine harvester and reducing clearance between cylinder and concave (Isaac et al., 2006) [12] .
Materials and Methods
Research was conducted on area of Shatrah, Iraq in season in 2022. Results were statistically analyzed and significant differences were tested using the least significant difference (LSD) method at the probability level (0.05) Factorial Experiments under complete randomized block design. With three replication in this experiment. distributed first factor harvesting speed at three levels 2.50, 3.50 and 4.50 km.hr -1 on the secondary plot, second factor clearance between cylinder and concave, at three levels (12, 15, and 20 mm) on main plot. The research included 3*3**3= 27 experimental units. The moisture content at harvest was 16%, harvesting was using a New Holland has a working width of 4.0 m, a diameter cylinder 0.56 m, a width threshing cylinder 1.3 m, an opening upper sieve 12 mm and a hole lower 4 mm. diameter air fan is 0.60 m and its speed is 500 rpm. Reel index 1.25. Studied attributes: Performance Efficiency = (total grain in tank/Gross yield) *100. (Patel et al., 2013) [5] .
Total losses = losses cutting unit + loss in threshing unit +losses in cleaning unit
Results
Performance efficiency % Table 1. Shows effected the harvester speeds, and clearance between cylinder and concave, and interactions between them in performance efficiency Increasing harvester speeds from 2.54 to 3.50 and then to 4.50 km.hr -1 caused an increase in performance efficiency from 91% to 93% and then to 95%. Because increasing speeds harvesting will lead to harvesting crop in less time and increasing the amount of grains resulting from harvest in relation to time and speed of separating grains from stalks. This is consistent with the results reached (Al-Rajaboo, 2012) [2] . Impact clearance between cylinder and concave in performance efficiency, as it is noted that clearance between cylinder and concave 12 gets highest 95% (Table 1) while clearance 18 mm gets lowest value was 92%. Interaction between harvester speed 4.5 km.hr -1 and clearance cylinder and concave 12 mm gets highest value which amounted 97%.
| Average speeds | — | Clearance cylinder and concave mm | — | — | Harvester speeds |
|---|---|---|---|---|---|
| 18 | 15 | 12 | Km.hr-1 | ||
| 0.91 | 0.91 | 0.90 | 0.93 | 2.5 | |
| 0.93 | 0.90 | 0.93 | 0.96 | 3.5 | |
| 0.95 | 0. 94 | 0.96 | 0.97 | 4.5 | |
| N.S | LSD | N.S | LSD | ||
| 0.92 | 0.93 | 0.95 | Average clearance | ||
| N.S | LSD |
Table text extracted from the original PDF; superscript letters are shown inline. The original table image is below.
View original table image
Total losses %
Indicates to effected harvester speeds, and clearance between cylinder and concave, and the interactions between them in total losses. Increasing harvester speeds from 2.54 to 3.50 and 4.50 km.hr -1 caused an increase in total losses from 1.83 to 2.80 and 4.23 (Table 2). Because increasing speeds will lead to flow crop to cutting unit and threshing unit lead to losses stalks without separation grain This is consistent with the results reached (Galib, 2024) [15] . According Table (2) impact clearance between cylinder and concave in total losses, as it is noted that increasing clearance from 12 to 15 and then to 20 mm lead to increase total losses from 2.41% to 3.20% and 3.25%. Interaction between harvester speed 4.5 km.hr -1 and clearance cylinder and concave 18 mm gets heights total losses which amounted 4.47%. This is consistent with the results reached. Losses threshing unit % It was verified the superiority speed harvester 4.50 km.hr-gets less losses threshing unit which amounted 0.79%. while the highest losses 1.48% in first speed 2.5 km.hr -1 (Table 3) Because increasing speeds harvesting will lead to harvesting crop in less time and increasing the amount of grains resulting from harvest in relation to time and speed of separating grains from stalks. This is consistent with the results reached (Sheikhand & Houshyar, 2010) [10] . Impact clearance between cylinder and concave in losses threshing unit (Table 3), as it is noted that the using clearance from 12 mm lead to gets decrease losses from 0.75%. The interaction between harvester speed 4.5 km.hr -1 and clearance cylinder and concave 12 mm gets less losses which amounted 0.53%. [5] . Interaction between harvester speed 2.5 km.hr -1 and clearance cylinder and concave 12 mm gets lowest value which amounted 1.08 kg. Dunam -1 (Table 4) while interaction between harvesters speed 4.5 km.hr -1 and clearance 18 mm gets heights value which amounted 2.30 kg. Dunam -1
| Average speeds | — | Clearance between cylinder and concave (mm) | — | — | Harvester speeds |
|---|---|---|---|---|---|
| 18 | 15 | 12 | Km.hr-1 | ||
| 1.24 | 1.47 | 1.17 | 1.08 | 2.5 | |
| 1.49 | 1.70 | 1.60 | 1.17 | 3.5 | |
| 1.76 | 2.30 | 1.63 | 1.37 | 4.5 | |
| 0.46 | LSD | N.S | LSD | ||
| 1.82 | 1.46 | 1.20 | Average clearance | ||
| N.S | LSD |
Table text extracted from the original PDF; superscript letters are shown inline. The original table image is below.
View original table image
| Average speeds | — | Clearance between cylinder and concave mm | — | — | Harvester speed |
|---|---|---|---|---|---|
| 18 | 15 | 12 | Km.hr-1 | ||
| 1.48 | 1.70 | 1.83 | 0.93 | 2.5 | |
| 1.00 | 1.07 | 1.13 | 0.80 | 3.5 | |
| 0.79 | 1.17 | 0.67 | 0.53 | 4.5 | |
| 0.38 | LSD | N.S | LSD | ||
| 1.31 | 1.21 | 0.75 | Average clearance | ||
| 0.38 | LSD |
Table text extracted from the original PDF; superscript letters are shown inline. The original table image is below.
View original table image
| Average speeds | — | Clearance between cylinder and concave mm | — | — | Harvester speeds |
|---|---|---|---|---|---|
| 18 | 15 | 12 | Km.hr-1 | ||
| 1.83 | 2.20 | 2.07 | 1.23 | 2.5 | |
| 2.80 | 3.10 | 2.97 | 2.33 | 3.5 | |
| 4.23 | 4.47 | 4.57 | 3.67 | 4.5 | |
| 0.69 | LSD | N.S | LSD | ||
| 3.25 | 3.20 | 2.41 | Average clearance | ||
| 0.69 | LSD |
Table text extracted from the original PDF; superscript letters are shown inline. The original table image is below.
View original table image
Conclusions
From the above results, speeds harvester 2.5, 4.5 km.hr -1 gets highest performance efficiency, less total losses, lowest loss threshing unit and stalks scattered behind harvester. While the clearance between cylinder and concave 12 mm superior in all studied properties, monitoring system gets the power in management harvesting by monitoring the operation of all harvester units and directly repairing faults that occur during work. Therefore, we recommend using a with harvester speed 2.54 km.hr -1 and clearance 12 mm
References
12 in the original paper- Saad A, Al-Rajaboo. A study of combine harvester performance on two types of wheat on the losses quantity percentage. Alrafidain Journal Agricultural, 2012, 40(4).
- Aziz R, Al-Banna. Grain loss under harvest conditions in the Al-Damiyah region in Iraq. Iraqi Agriculture Journal. 1997;2(2):10-13.
- Patel SK, Kumar S, Yaduvanshi BK, Singh PK, Chinchorkar SS, Sayed FG, et al. Effect of Wheat Crop Varieties on Plot Combine Harvester. Discovery Agriculture, 2013, 1(2).
- Singh V, Yang P, Moreeau RA, Hicks KB, Eckhoff SR. Effect of harvest moisture content and ambient air drying on maize fiber oil yield and its phytosterol composition. 2001;53(12):635-638.
- Muhammad II, Jassim AAL. The use of an agricultural robot in agriculture, fertilization, and first irrigation in some performance characteristics. Iraq Journal of Soil Science. 2021;21(1):126-135.
- Al-Sammarraie MAJ, Saba AA. Determination of grain losses on combine harvester. Journal of Scientific and Engineering Research. 2021;8(1):196-202.
- Sheikh Davoodi MJ, Houshyar E. Evaluation of wheat losses using New Holland combine harvester in Iran. American, Eurasian Journal of Agricultural & Environmental Science. 2010;8(1):104-108.
- Benaseer S, Masilamani P, Albert VA, Govindaraj M, Selvaraju P, Bhaskaran M. Impact of harvesting and threshing methods on seed quality -review. Agricultural Reviews. 2018;39(3):183-192.
- Bulgarian Journal of Agricultural Science. 2020;26(4):013918.
- Isaac NE, Quick GR, Birrel SJ, Edwards WM, Coers BA. Combine harvester econometric model with forward speed optimization. Applied Engineering in Agricultural. 2006;22(1):25-31.
- Kumar A, Kumar A, Khan K, Kumar D. Performance evaluation of harvesting and threshing methods for wheat crop. International Journal of Pure and Applied Bioscience. 2017;5(2):604-611.
- Galib AA Alkaabi, Al-Sheikh WAH. The cylinder speeds and clearance sieves on evaluating the performance of the New Holland combine harvester. South Asian Journal of Agricultural Sciences. 2024;4(1):01-03.
Cited by 1
From OpenAlex, OpenCitations and reference lists read by Scinovex
- Advancing Intercropping of Drought-Resistant Oilseed Crops: Mechanized Harvesting ↗
Luca Cozzolino, Simone Bergonzoli, Gian Maria Baldi, Michele Falce, Luigi Pari · AgriEngineering · 2025
Adverse climatic dynamics in recent years have intensified the need for resilient and multifunctional agricultural systems that integrate productivity, ecological sustainability, and socio-economic viability. This study evaluates the harvesting performance of three cropping systems: intercropping of cardoon and safflower (IT) and monocultures of cardoon (DC) and safflower (DS). Field trials were conducted during three following growing seasons to assess key…
❝ 1PDF