
Research article · 2024 · Full text
International Journal of Advanced Biochemistry ResearchEvaluation of taro (Colocasia esculenta L.) genotypes for quantitative traits under Marathwada conditions
Volume 8(2) · Pages 386–389 · DOI: 10.33545/26174693.2024.v8.i2e.572 ↗
Research areasPacific and Southeast Asian StudiesLivestock and Poultry Management
Abstract
Author-writtenThe present investigation was carried out during the year 2022-2023 with twenty one genotypes replicated thrice. Among different genotypes, maximum plant height (123.46 cm), number of leaves plant-1 (5.93), petiole length (119.09 cm), leaf area (1111.89 cm2), corm diameter (6.35 cm) and herbage yield per hectare (37.35 q ha-1) was noted in the genotype (G16) PBNT-1. While maximum number of suckers plant-1 (8.64) was observed in (G14) DPLT-14. The maximum number of corms plant-1 (2.27) and maximum weight of corms plant-1 (276.02 g) was observed in (G3) DPLT-3. The maximum total corm and cormel yield (256.82 q ha-1) was recorded in (G4) DPLT-4. The genotype (G12) DPLT-12 had maximum corm length (10.48 cm). Whereas, genotype (G5) DPLT- 5 recorded lowest values for above mentioned traits among other genotypes studied under Marathwada conditions.
Summary
Source-checkedPlain-language reading of the full paper, prepared with AI and checked against the text. Each point links to the authors' own words.
Why it matters
- Taro corms are highly digestible due to their small starch granules and possess medicinal properties that can help regulate heart conditions, asthma, and blood sugar. View evidence ↗
- Although taro is consumed in the Marathwada region of Maharashtra, there are currently no recommended high-yielding varieties for commercial farming there. View evidence ↗
The question
- The study aimed to evaluate various taro genotypes to identify those most suitable for cultivation in the Marathwada region. View evidence ↗
What they did
- The research was conducted at the College of Horticulture in Parbhani, Maharashtra, during 2022-2023. View evidence ↗
- Uniform, disease-free cormels were planted using a spacing of 60 x 45 cm. View evidence ↗
- Quantitative traits were recorded periodically and analyzed using statistical methods established by Panse and Sukhatme. View evidence ↗
What they found
- At 120 days after planting, genotype PBNT-1 (G16) had the maximum plant height of 123.46 cm, while DPLT-5 (G5) had the minimum height of 30.24 cm. View evidence ↗
- Genotype DPLT-14 (G14) produced the most suckers per plant (8.64), whereas DPLT-5 (G5) produced the fewest (2.29). View evidence ↗
- PBNT-1 (G16) had the highest number of leaves per plant (5.93), and DPLT-2 (G2) had the lowest (3.77). View evidence ↗
- The longest petiole length was found in PBNT-1 (G16) at 119.19 cm, while the shortest was in DPLT-5 (G5) at 25.99 cm. View evidence ↗
- At 120 days after planting, PBNT-1 (G16) showed the maximum leaf area (1111.89 cm²), compared to the minimum in DPLT-5 (G5) (94.38 cm²). View evidence ↗
- DPLT-3 (G3) had the highest number of corms per plant (2.27), while DPLT-5 (G5) had the lowest (1.02). View evidence ↗
- The maximum corm length was 10.48 cm in DPLT-12 (G12), and the minimum was 4.77 cm in DPLT-5 (G5). View evidence ↗
- The highest corm weight per plant was 276.02 g in DPLT-3 (G3), while the lowest was 114.25 g in DPLT-5 (G5). View evidence ↗
What it means
- The authors conclude that PBNT-1 (G16) is the superior genotype for most quantitative traits, including plant height and herbage yield, followed by PBNT-4 (G19). View evidence ↗
- The authors identified DPLT-5 (G5) as the poorest performing genotype across the studied quantitative traits in the Marathwada region. View evidence ↗
Visual summary
3 visualsIllustrations explain the paper; charts are replotted from the paper's own table values.
Genotype Performance Comparison
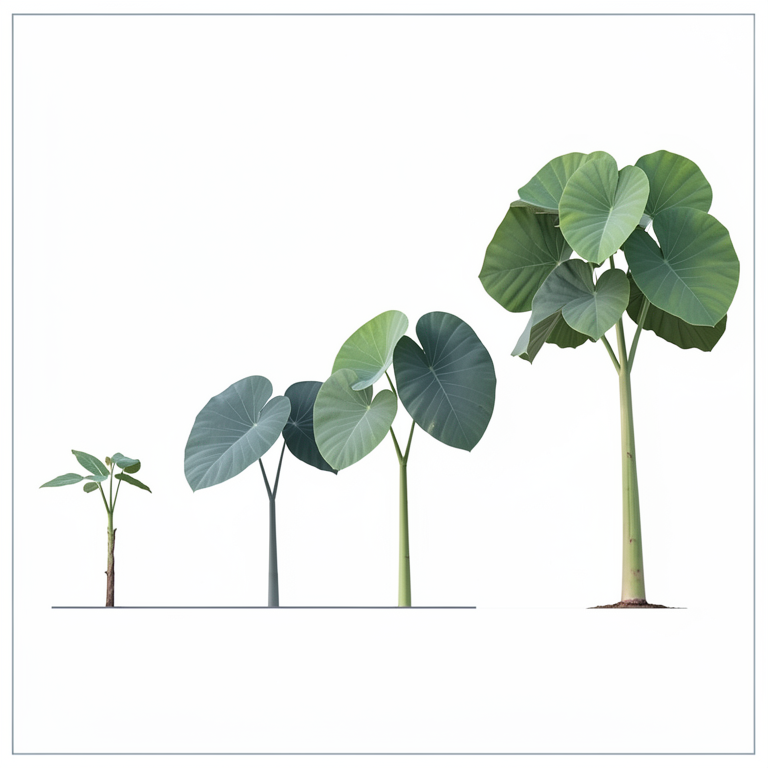
AI-generated conceptual illustration (taro plants (Colocasia esculenta)). It explains the idea and does not show study data.
View source evidence ↗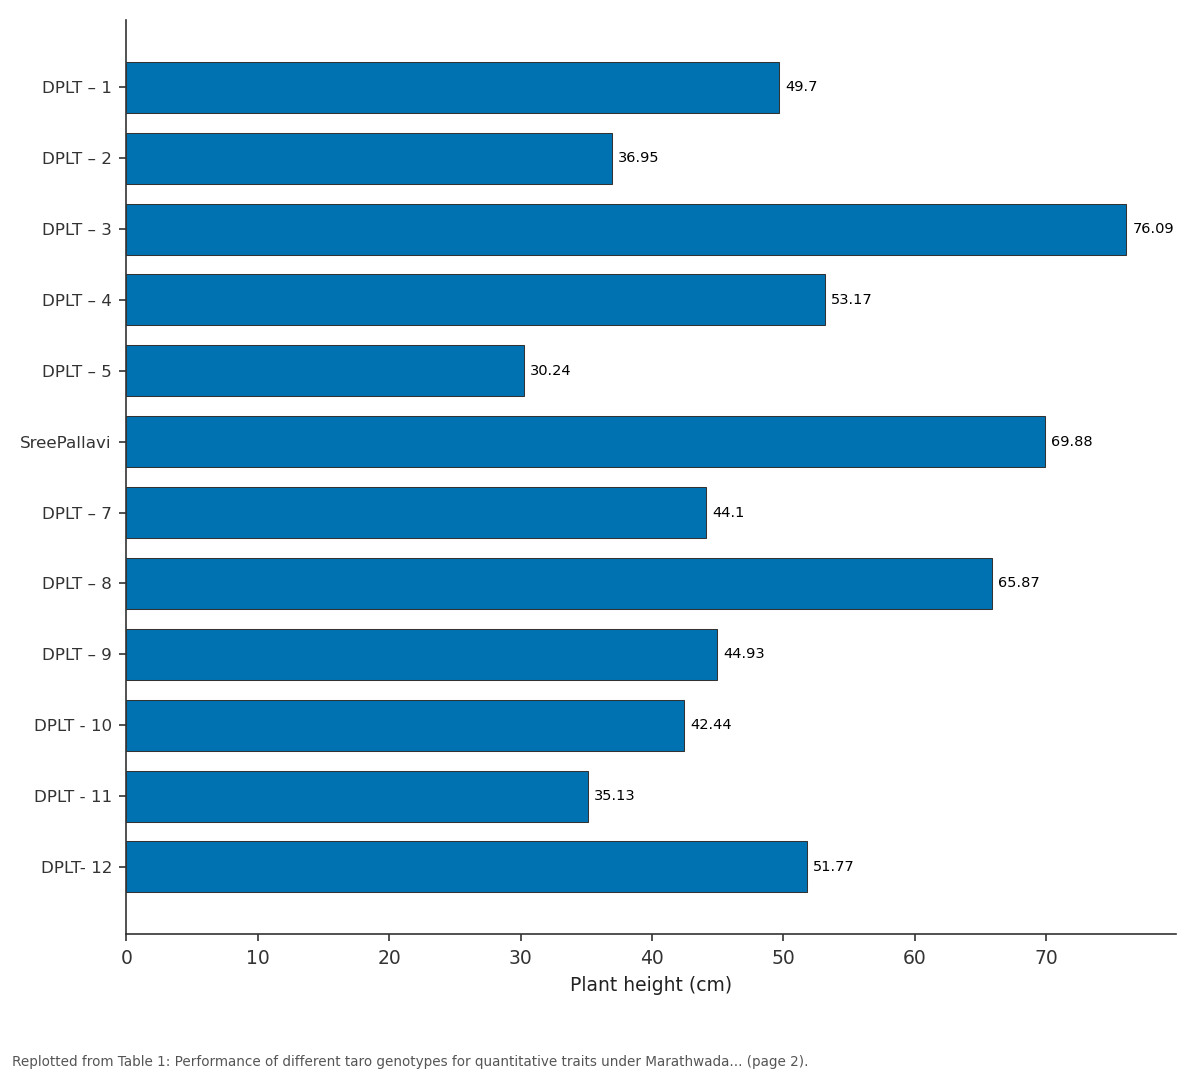
Plant height (cm): DPLT – 1 vs DPLT – 2 vs DPLT – 3 vs DPLT – 4 vs DPLT – 5
Replotted from Table 1 (page 2) of the original paper. Every bar is the paper's own table value.
View source evidence ↗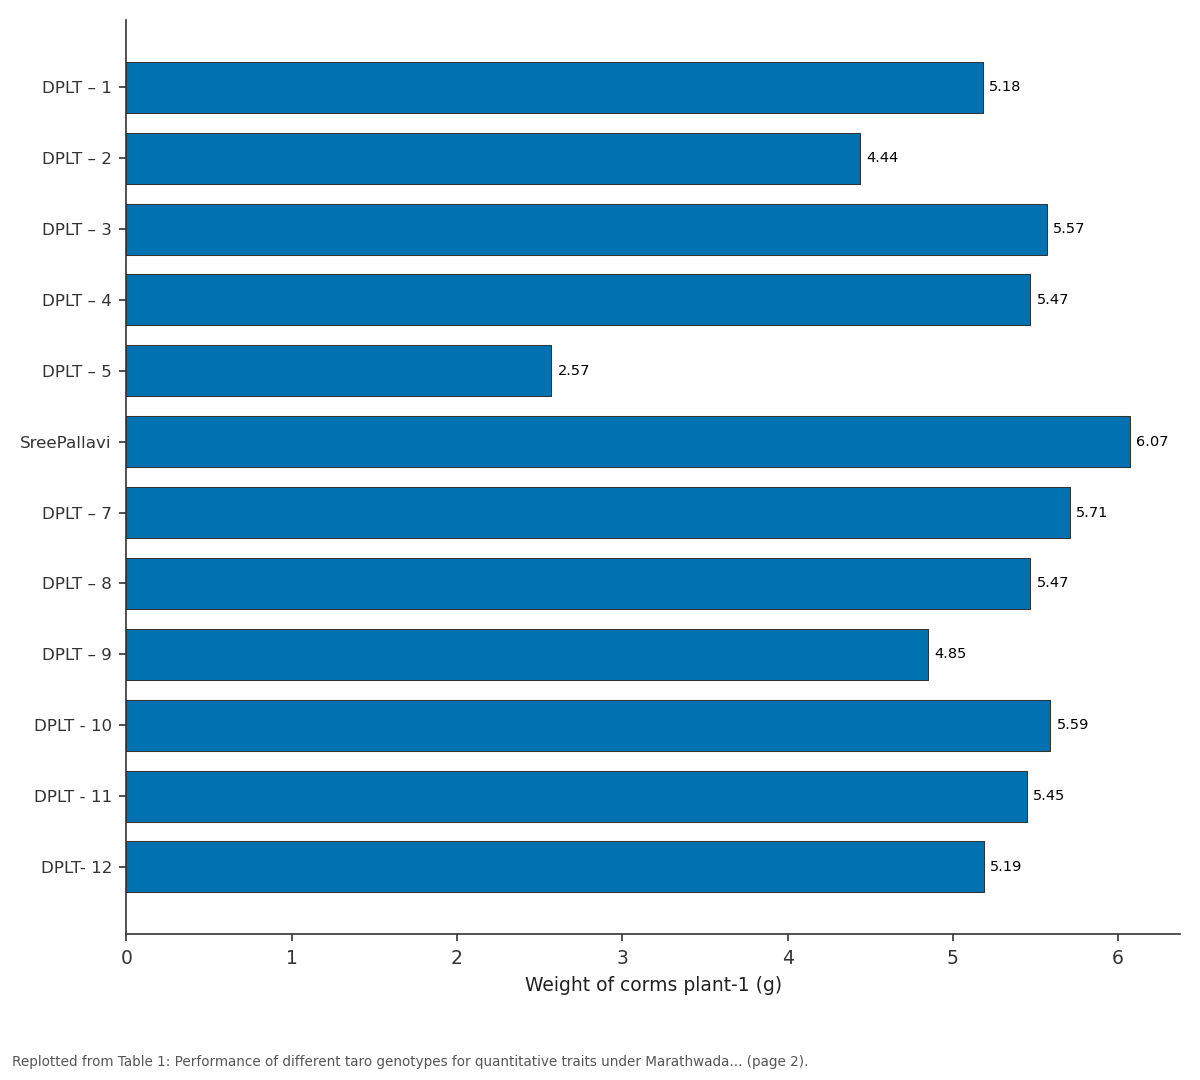
Corm diameter (cm): DPLT – 1 vs DPLT – 2 vs DPLT – 3 vs DPLT – 4 vs DPLT – 5
Replotted from Table 1 (page 2) of the original paper. Every bar is the paper's own table value.
View source evidence ↗Figures & tables
From the original paper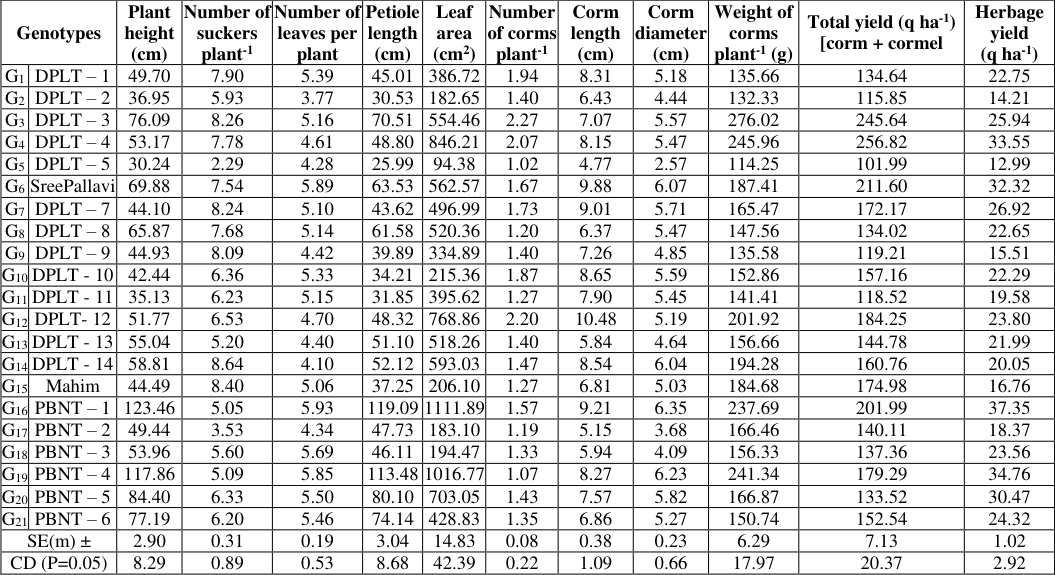 Table 1
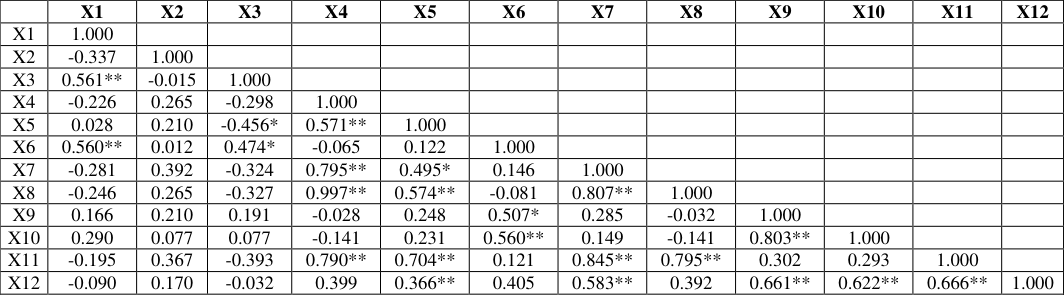 Table 2
Introduction
Taro (Colocasia esculenta L.), a tropical tuber crop commonly known as "Arvi" is a member of the "Araceae" family with around 110 genera and more than 2000 species, it is the oldest group of cultivated plants. It is said to have originated in South Central Asia, perhaps in Malaysia or Eastern India (Sastri, 1950) [9] . Taro is grown on around 1.9 million hectare of land worldwide and an annual production of 12.39 MT (FAOSTAT, 2023) [4] . Asia (18.60%) and Oceania (3.40%) are next in terms of taro production after Africa (77.30%). Nigeria is the world's largest producer of taro (FAOSTAT, 2023) [4] . The corms' excellent digestibility and simultaneous effective release of nutrients during digestion and absorption are due to the tiny size of the starch granules that make up each corm. Besides it has medicinal properties since it regulates blood sugar, asthma, and heart conditions. Leaves and corms are also used medicinally to treat fungal infections, lung congestion, ulcers and tuberculosis. Although taro is a significant tuber crop, not much research has been done on its evaluation. It is also a largely underutilized crop in our country, being grown only in a few areas. Inspite of its leaves and corms are widely consumed in the Marathwada region of Maharashtra, but there is no suitable variety suggested for commercial cultivation in this region and not much work has been done so far towards development of the high yielding varieties in taro. In view of this the present work was carried out to evaluate suitable taro genotypes for this region.
Methodology
The present investigation was conducted at College of Horticulture, Vasantrao Naik Marathwada Krishi Vidyapeeth, Parbhani (Maharashtra), during the year 2022-2023.The experiment was set up in a Randomized Block Design with twenty one different treatments and three replications. Healthy and disease free uniform sized cormel of every genotype was planted at 60 X 45 cm spacing. Fertilizer applications and other cultivation practices were followed as per recommendations and observations of various quantitative traits were recorded periodically. Subsequently, data was statistically analyzed as per the methods suggested by Panse and Sukhatme (1985) [6] .
Results and Discussion
There were significant differences observed in respect to plant height among different taro genotypes as shown in Table 1.
| Genotypes | — | Plant height (cm) | Number of suckers plant-1 | Number of leaves per plant | Petiole length (cm) | Leaf area (cm2) | Number of corms plant-1 | Corm length (cm) | Corm diameter (cm) | Weight of corms plant-1 (g) | Total yield (q ha-1) [corm + cormel | Herbage yield (q ha-1) |
|---|---|---|---|---|---|---|---|---|---|---|---|---|
| G1 | DPLT – 1 | 49.70 | 7.90 | 5.39 | 45.01 | 386.72 | 1.94 | 8.31 | 5.18 | 135.66 | 134.64 | 22.75 |
| G2 | DPLT – 2 | 36.95 | 5.93 | 3.77 | 30.53 | 182.65 | 1.40 | 6.43 | 4.44 | 132.33 | 115.85 | 14.21 |
| G3 | DPLT – 3 | 76.09 | 8.26 | 5.16 | 70.51 | 554.46 | 2.27 | 7.07 | 5.57 | 276.02 | 245.64 | 25.94 |
| G4 | DPLT – 4 | 53.17 | 7.78 | 4.61 | 48.80 | 846.21 | 2.07 | 8.15 | 5.47 | 245.96 | 256.82 | 33.55 |
| G5 | DPLT – 5 | 30.24 | 2.29 | 4.28 | 25.99 | 94.38 | 1.02 | 4.77 | 2.57 | 114.25 | 101.99 | 12.99 |
| G6 | SreePallavi | 69.88 | 7.54 | 5.89 | 63.53 | 562.57 | 1.67 | 9.88 | 6.07 | 187.41 | 211.60 | 32.32 |
| G7 | DPLT – 7 | 44.10 | 8.24 | 5.10 | 43.62 | 496.99 | 1.73 | 9.01 | 5.71 | 165.47 | 172.17 | 26.92 |
| G8 | DPLT – 8 | 65.87 | 7.68 | 5.14 | 61.58 | 520.36 | 1.20 | 6.37 | 5.47 | 147.56 | 134.02 | 22.65 |
| G9 | DPLT – 9 | 44.93 | 8.09 | 4.42 | 39.89 | 334.89 | 1.40 | 7.26 | 4.85 | 135.58 | 119.21 | 15.51 |
| G10 | DPLT - 10 | 42.44 | 6.36 | 5.33 | 34.21 | 215.36 | 1.87 | 8.65 | 5.59 | 152.86 | 157.16 | 22.29 |
| G11 | DPLT - 11 | 35.13 | 6.23 | 5.15 | 31.85 | 395.62 | 1.27 | 7.90 | 5.45 | 141.41 | 118.52 | 19.58 |
| G12 | DPLT- 12 | 51.77 | 6.53 | 4.70 | 48.32 | 768.86 | 2.20 | 10.48 | 5.19 | 201.92 | 184.25 | 23.80 |
| G13 | DPLT - 13 | 55.04 | 5.20 | 4.40 | 51.10 | 518.26 | 1.40 | 5.84 | 4.64 | 156.66 | 144.78 | 21.99 |
| G14 | DPLT - 14 | 58.81 | 8.64 | 4.10 | 52.12 | 593.03 | 1.47 | 8.54 | 6.04 | 194.28 | 160.76 | 20.05 |
| G15 | Mahim | 44.49 | 8.40 | 5.06 | 37.25 | 206.10 | 1.27 | 6.81 | 5.03 | 184.68 | 174.98 | 16.76 |
| G16 | PBNT – 1 | 123.46 | 5.05 | 5.93 | 119.09 | 1111.89 | 1.57 | 9.21 | 6.35 | 237.69 | 201.99 | 37.35 |
| G17 | PBNT – 2 | 49.44 | 3.53 | 4.34 | 47.73 | 183.10 | 1.19 | 5.15 | 3.68 | 166.46 | 140.11 | 18.37 |
| G18 | PBNT – 3 | 53.96 | 5.60 | 5.69 | 46.11 | 194.47 | 1.33 | 5.94 | 4.09 | 156.33 | 137.36 | 23.56 |
| G19 | PBNT – 4 | 117.86 | 5.09 | 5.85 | 113.48 | 1016.77 | 1.07 | 8.27 | 6.23 | 241.34 | 179.29 | 34.76 |
| G20 | PBNT – 5 | 84.40 | 6.33 | 5.50 | 80.10 | 703.05 | 1.43 | 7.57 | 5.82 | 166.87 | 133.52 | 30.47 |
| G21 | PBNT – 6 | 77.19 | 6.20 | 5.46 | 74.14 | 428.83 | 1.35 | 6.86 | 5.27 | 150.74 | 152.54 | 24.32 |
| SE(m) ± | 2.90 | 0.31 | 0.19 | 3.04 | 14.83 | 0.08 | 0.38 | 0.23 | 6.29 | 7.13 | 1.02 | |
| CD (P=0.05) | 8.29 | 0.89 | 0.53 | 8.68 | 42.39 | 0.22 | 1.09 | 0.66 | 17.97 | 20.37 | 2.92 |
Table text extracted from the original PDF; superscript letters are shown inline. The original table image is below.
View original table image
The maximum plant height at 120 DAP (123.46 cm) was recorded in (G 16 ) PBNT-1, which was statistically at par with (G 19 ) PBNT-4 (117.86 cm). While, minimum plant height (30.24 cm) was recorded in (G 5 ) DPLT-5. Similar variations in plant height among different taro cultivars have been documented in various studies by Chadha et al., 2007 [2] and Rao et al., 2008 [8] . The variations in the height might bedue to the inherent genetic characters of that particular genotype and the influence of external environmental factors. Similarly, the significant difference was observed in the trait of number of suckers per plant during various growth stages. The highest number of suckers plant -1 (8.64) was recorded in (G 14 ) DPLT-14. While the least number of suckers plant -1 (2.29) was found in (G 5 ) DPLT-5. The increased production of suckers per plant may primarily stem from specific varietal characteristics. However, environmental factors and cultivation practices also influence it to a certain extent (Rao et al., 2008 and Sibyala 2013) [8,12] . The maximum number of leaves (5.93 plant -1 ) found in (G 16 ) PBNT-1. While, minimum number of leaves (3.77 plant -1 ) was recorded in (G 2 ) DPLT-2. Leaves are essential in the creation of carbohydrates via photosynthesis, which increases plant vigor. Similar observations in various taro cultivars at different locations have been reported by Rao et al., 2008 [8] and Sibyala 2013 [12] . The data pertaining to petiole length illustrated in Table 1 reveals significant differences among the genotypes. The significantly highest petiole length (119.19 cm) was observed in genotype (G 16 ) PBNT-1. While lowest (25.99 cm) was recorded in (G 5 ) DPLT-5 genotype. There's a strong correlation between the length of the petiole and the plant height of the taro plant. In essence, as the petiole length increases, it is likely that the overall height of the taro plant will also increases. The observations align with the findings from Sibyala, 2013 [12] , Angami et al., 2015 [1] and Shellikeri et al., 2019 [11] . A significantly maximum leaf area (1111.89 cm 2 ) at 120 DAP was recorded in (G 16 ) PBNT-1. While minimum leaf area (94.38 cm 2 ) was recorded in (G 5 ) DPLT-5. Variations in leaf size can be attributed to both genetic factors within the plant and the external effects of the climate, comparable findings were documented by Angami et al., 2015 [1] and Shellikeri et al., 2019 [11] . Highest number of corms plant -1 (2.27) observed in (G 3 ) DPLT-3. Whereas, lowest number of corms plant -1 (1.02) was recorded in (G 5 ) DPLT-5. The observed minimal differences among various genotypes may be due to the lack of significant genetic diversity in this trait. The results are in accordance with the findings of Sen et al., 2006 [10] and Sibyala, 2013 [12] . The perusal of data in respect to corm length revealed significant differences. The maximum corm length (10.48 cm) was recorded in genotype (G 12 ) DPLT-12, while, minimum (4.77 cm) was recorded in (G 5 ) DPLT-5. The size of the corm, particularly its length, is shaped by a combination of factors such as inherent genetic attributes, environmental conditions and accumulation of photosynthates (Chadha et al., 2007) [2] . Similarly, the maximum corm diameter (6.35 cm) was recorded in (G 16 ) PBNT-1, while minimum (2.57 cm) was recorded in (G 5 ) DPLT-5. It might be due to genetic characters, environmental conditions and products of photosynthesis gathered from the plants foliage directly influence the corm's diameter. Similar findings have been documented by Sibyala, 2013 [12] and Shellikeri et al., 2019 [11] . The data regarding the weight of corm plant -1 have been subjected to statistical analysis. Notably, there was a significant variation in corm weight observed among all the taro genotypes. The significantly maximum weight of corms plant -1 (276.02 g) was recorded by (G 3 ) DPLT-3 genotype; however, weight of corms plant -1 (114.25 g) was found minimum in (G 5 ) DPLT-5. The differences in the weight of taro corms produced by individual plants can be attributed due to variances in the accumulation of dry matter, the specific environmental conditions experienced during the growth period, and the genetic composition of the different genotypes, as noted in a study by Chattopadhyay et al., 2006 [3] . The genotypes showed significant differences in their total corm and cormel yield per hectare. The data on these traits revealed that genotype (G 4 ) DPLT-4 with 256.82 q ha -1 was a superior genotype, which produced highest corm and cormel yield. Genotype (G 5 ) DPLT-5 recorded lowest corm and cormel yield (101.99 q ha -1 ). The differences in yield are often linked to two main factors i.e larger corm sizes and enhanced plant growth. These results align with the findings of several studies conducted by Sibyala, 2013 [12] , Angami et al., 2015 [1] and Shellikeri et al., 2019 [11] . The genotype (G 16 ) PBNT-1 (128.34 q ha -1 ) consistently gave the highest herbage at every harvest and it was statistically at par with genotype (G 19 ) PBNT-4 (120.48 q ha -1 ). Whereas, the (G 5 ) DPLT-5 recorded lowest (44.95 q ha -1 ) cumulative herbage yield. The variation in herbage yield may be linked to vegetative growth patterns, genetic variations and adaptability to diverse agro-climatic conditions seen in various taro genotypes. Shellikeri et al., 2019 [11] also documented differences in herbage yield among native genotypes of taro in his study.
Correlation of yield attributing quantitative traits with herbage and corm yield
Understanding the association of different traits within a crop species is crucial for driving genetic improvements through the selection of appropriate breeding methodologies. The degree of variability and the correlation between different traits play an instrumental role in executing a successful selection program. Yield traits (herbage yield and total corm and cormel yield) and other quantitative traits were taken into consideration for estimation of multiple correlation matrix. It helps to understand the relationships between the traits, thereby guiding decisions to achieve the best possible outcomes in breeding programs. Correlation coefficients were analyzed and presented in Table 2.
| — | X1 | X2 | X3 | X4 | X5 | X6 | X7 | X8 | X9 | X10 | X11 | X12 |
|---|---|---|---|---|---|---|---|---|---|---|---|---|
| X1 | 1.000 | |||||||||||
| X2 | -0.337 | 1.000 | ||||||||||
| X3 | 0.561** | -0.015 | 1.000 | |||||||||
| X4 | -0.226 | 0.265 | -0.298 | 1.000 | ||||||||
| X5 | 0.028 | 0.210 | -0.456* | 0.571** | 1.000 | |||||||
| X6 | 0.560** | 0.012 | 0.474* | -0.065 | 0.122 | 1.000 | ||||||
| X7 | -0.281 | 0.392 | -0.324 | 0.795** | 0.495* | 0.146 | 1.000 | |||||
| X8 | -0.246 | 0.265 | -0.327 | 0.997** | 0.574** | -0.081 | 0.807** | 1.000 | ||||
| X9 | 0.166 | 0.210 | 0.191 | -0.028 | 0.248 | 0.507* | 0.285 | -0.032 | 1.000 | |||
| X10 | 0.290 | 0.077 | 0.077 | -0.141 | 0.231 | 0.560** | 0.149 | -0.141 | 0.803** | 1.000 | ||
| X11 | -0.195 | 0.367 | -0.393 | 0.790** | 0.704** | 0.121 | 0.845** | 0.795** | 0.302 | 0.293 | 1.000 | |
| X12 | -0.090 | 0.170 | -0.032 | 0.399 | 0.366** | 0.405 | 0.583** | 0.392 | 0.661** | 0.622** | 0.666** | 1.000 |
Table text extracted from the original PDF; superscript letters are shown inline. The original table image is below.
View original table image
The herbage yield was significantly and positively correlated with plant height, number of leaves per plant, leaf area and petiole length. This clearly shows that an increase in plant height, number of leaves per plant, leaf area and petiole length leads to a rise in the herbage yield. The correlation of total corm and cormel yield were significantly positive with number of leaves per plant, leaf area, number of corms per plant, number of cormels per plant and herbage yield. The findings from this study indicate that the number of leaves per plant, leaf area, number of corms per plant, number of cormels per plant and herbage yield play a crucial role in enhancing the total yield of corms and cormels in taro. These observations also align with the findings of Mohankumar et al., 1990 [5] , Paul et al., 2014 [7] and Shellikeri et al., 2019 [11] . .000 *Significant at 5% level of significance **Significant at 1% level of significance X1-Days to sprouting; X2-Percent sprouting; X3-Days to first leaf emergence; X4-Plant height (cm); X5-Number of leaves per plant; X6-Number of suckers per plant; X7-Leaf area (cm 2 ); X8-Petiole length; X9-Number of corms per plant; X10-Number of cormels per plant; X11-Herbage yield (q ha -1 ); X12-Total corm and cormel yield (q ha -1 ).
Conclusion
In summing up the present investigation based on the obtained results it may be concluded that, among twentyone taro genotypes, PBNT-1 (G 16 ) stands out superior in plant height, number of leaves per plant, petiole length, leaf area, corm diameter and herbage yield per hectare followed by (G 19 ) PBNT-4. Whereas, DPLT-5 (G 5 ) shown poor performance among rest of the genotypes under study with respect to the various quantitative traits in Marathwada region.
References
10 in the original paper- Angami T, Jha AK, Buragohain J, Deka BC, Verma VK, Nath A. Evaluation of taro cultivars for growth, yield, and quality attributes. J Hort. Sciences. 2015;10:183-189.
- Chadha ML, Kuo G, Gowda CLL. Comparative studies on morphological characters, yield, nutritional status, and isozymes activity of some elite genotypes of taro grown in West Bengal. Acta Horticulturae. 2007;752:219-224.
- Chattopadhyay A, Mukherjee D, Rao LL, Satapathy TP, Sen H. Genetic variability and character correlation in Dasheen taro. The Horticultural Sci. J. 2004;19:102106.
- Mohankumar CR, Saraswathy P, Sadanandan N. Correlation and path analysis on yield and yield components in taro. J Root Crops. 1990;16:140-141.
- Panse VG, Sukhatme PV. Statistical methods for agricultural workers. IARI, New Delhi. 1985;2:381.
- Paul KK, Bari MA. Accession characterization and genetic variability studies in Colocasia esculenta L. Schott. Bangladesh J Sci. and Industrial Res. 2011;46:235-242.
- Rao BN, Roy SS, Devi YI, Lavid P, Singh SG. Colocasia germplasms of Manipur; a performance analysis. Ind. Hort. Congress. 2008;140-141.
- Sastri BN. Colocasia. Wealth of India. 1950;3:309-310.
- Sen H, Chattopadhyay A, Pal S. Characterization of swamp taro landraces of eastern India. The Horticultural Journal. 2006;19:107-110.
- Shellikeri B, Malshe KV, Parulekar YR, Mhas NV. Determination of moisture content in leaf, corms, and cormels of colocasia. J Pharma and Phyto. 2019;9:2363-2365.
Cited by 1
From OpenAlex, OpenCitations and reference lists read by Scinovex
- Assessment of nutritional quality of taro (Colocasia esculenta L. Schott.) genotypes of the Eastern Himalaya, India ↗
Hammylliende Talang, Gabriella T. Mawlong, Lanamika Kjam, M. Bilashini Devi, Bishal Gurung, Niraj Biswakarma et al. · Frontiers in Nutrition · 2025
Introduction: The eastern Himalayan region of India with diverse agro-climatic conditions is one of the important hotspots of the world's biodiversity. A wide range of genetic variability of plant species like Colocasia is available in the region which is consumed by the local tribes. Materials and methods: L. Schott. genotypes under a split-plot design with three replications. Results and discussion:…
❝ 4PDF