
Research article · 2024 · Full text
International Journal of Agriculture Extension and Social DevelopmentAssessment of self-perceived life satisfaction of marginal and small farm women in Telangana state
Volume 7(2) · Pages 240–242 · DOI: 10.33545/26180723.2024.v7.i2d.337 ↗
Research areasAgricultural risk and resilience
Abstract
Author-writtenIn rural areas, around 80 percent of all economically active women work in the agricultural and related sectors, where 33 percent of the labor force is employed in the agricultural sector. Self-perceived life satisfaction is the extent to which people positively assess the overall quality of her life or how much does the individual enjoy their present way of living? It is a measure of wellbeing, can be assessed in terms of mood, fulfillment with interpersonal relationships and with goals attained, self-concepts, and self-perceived capacity for coping with day-to-day living. The present study is an attempt to evaluate self-perceived life satisfaction among rural farm women and to analyze the relationship between profile characteristics of farm women with their life satisfaction. Ex post facto research design was adopted to assess the self-perceived life satisfaction of rural farm women. The sample for the study includes 50 marginal and 50 small farm women, total comprising of 100 respondents were selected from two districts i.e., Nalgonda and Yadadri Bhuvanagiri through random sampling method. In the study, the results indicated that majority of the respondents were engaged in Agriculture along with Agricultural laborers as occupation, medium income group had medium family size (4-6 members) residing in pucca house. Further, the correlation analysis showed a negative and significant relationship between family size, house type and self-perceived life satisfaction while annual income was positively significant at 0.05 level of significance among marginal farm women. Occupation had positive and significant relationship, whereas family size was negatively significant with the self-perceived life satisfaction at 0.05 level of significance among small farm women.
Summary
Source-checkedPlain-language reading of the full paper, prepared with AI and checked against the text. Each point links to the authors' own words.
Why it matters
- A significant portion of economically active women in rural areas work in agriculture and related sectors, with 33% of the total labor force employed in agriculture. View evidence ↗
- Rural women face a heavy workload, with fieldwork and domestic chores taking up between 16 and 18 hours of their day. View evidence ↗
- Self-perceived life satisfaction serves as a measure of well-being, encompassing mood, interpersonal relationships, goal achievement, and coping abilities. View evidence ↗
The question
- The study aimed to examine how various independent variables relate to the self-perceived life satisfaction of farm women. View evidence ↗
What they did
- The researchers used an ex post facto research design to assess life satisfaction. View evidence ↗
- The sample consisted of 100 randomly selected respondents (50 marginal and 50 small farm women) from the Nalgonda and Yadadri Bhuvanagiri districts. View evidence ↗
- Life satisfaction was measured using a 35-statement, 5-point Likert scale developed by Singh and Joseph. View evidence ↗
- The collected data were analyzed using frequency, percentage, and correlation methods. View evidence ↗
What they found
- The majority of the respondents (75.00%) were employed in a combination of agriculture and agricultural labor. View evidence ↗
- A majority of the women (67.00%) lived in pucca houses. View evidence ↗
- Overall, 59.00% of the women reported medium self-perceived life satisfaction, while 41.00% reported high satisfaction. View evidence ↗
- Among marginal farm women, there was a positive and significant correlation between annual income and life satisfaction (p < 0.05). View evidence ↗
- For marginal farm women, family size and house type showed a negative and significant relationship with life satisfaction (p < 0.05). View evidence ↗
- Small farm women showed a positive and significant relationship between their occupation and their self-perceived life satisfaction (p < 0.05). View evidence ↗
- Among small farm women, an increase in family size was significantly associated with a decrease in self-perceived life satisfaction (p < 0.05). View evidence ↗
What it means
- The authors recommend policy interventions focused on improving housing, income levels, and family support to enhance the well-being of farm women. View evidence ↗
Visual summary
3 visualsIllustrations explain the paper; charts are replotted from the paper's own table values.
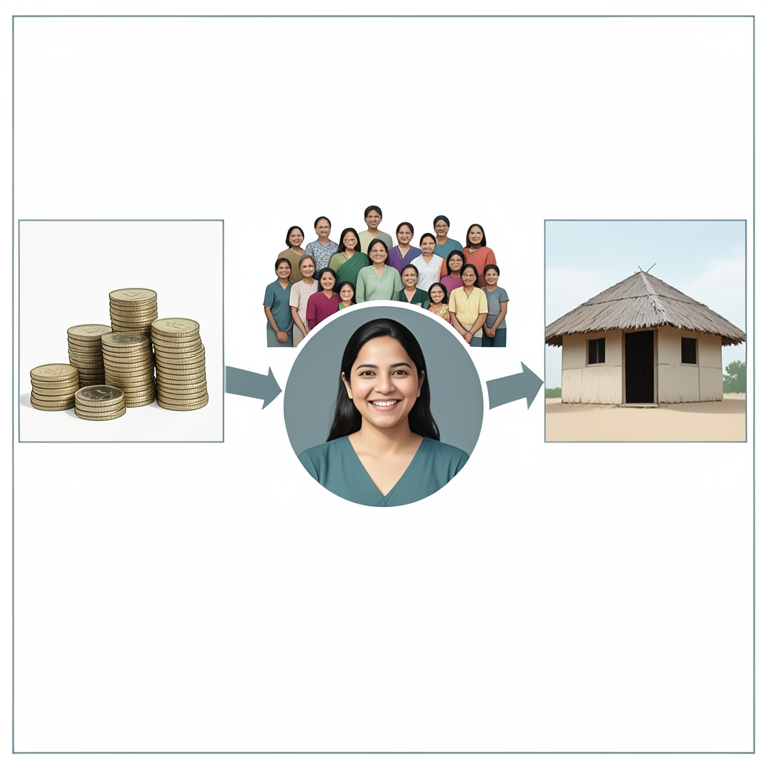
Factors Influencing Life Satisfaction
AI-generated conceptual illustration (Indian farm women in Telangana state). It explains the idea and does not show study data.
View source evidence ↗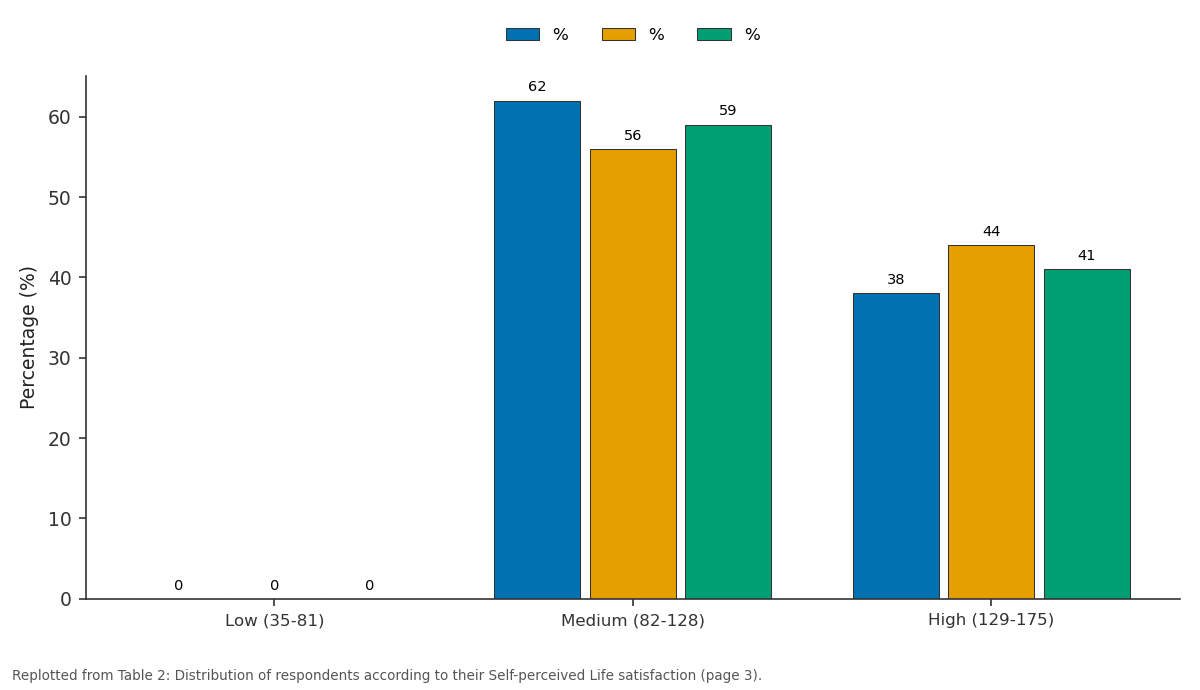
% and % and more: Low (35-81) vs Medium (82-128) vs High (129-175)
Replotted from Table 2 (page 3) of the original paper. Every bar is the paper's own table value.
View source evidence ↗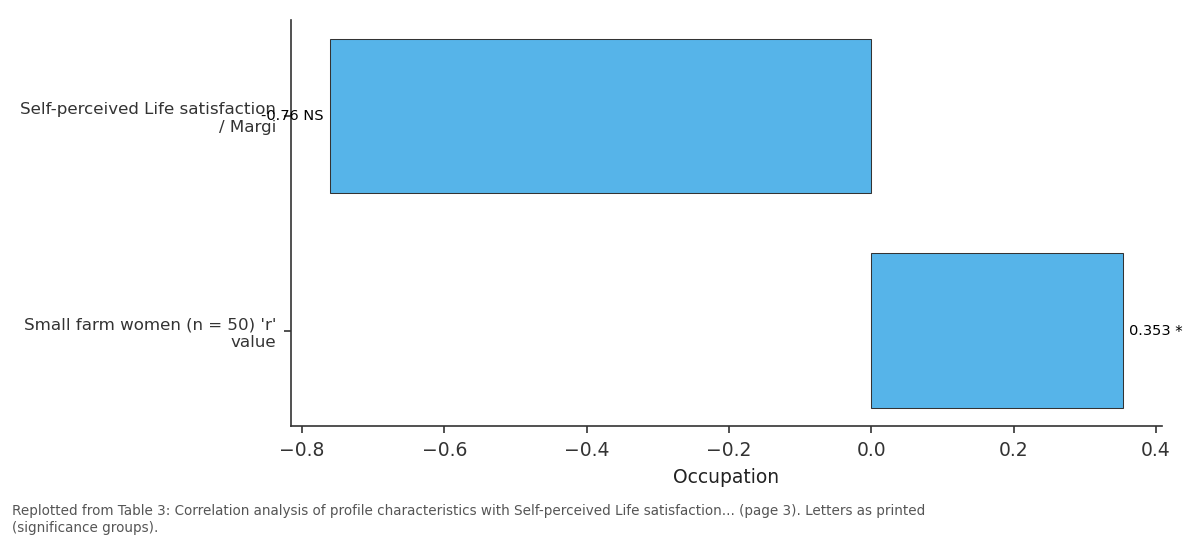
Occupation: Self-perceived Life... vs Small farm women (n =...
Replotted from Table 3 (page 3) of the original paper. Every bar is the paper's own table value.
View source evidence ↗Figures & tables
From the original paper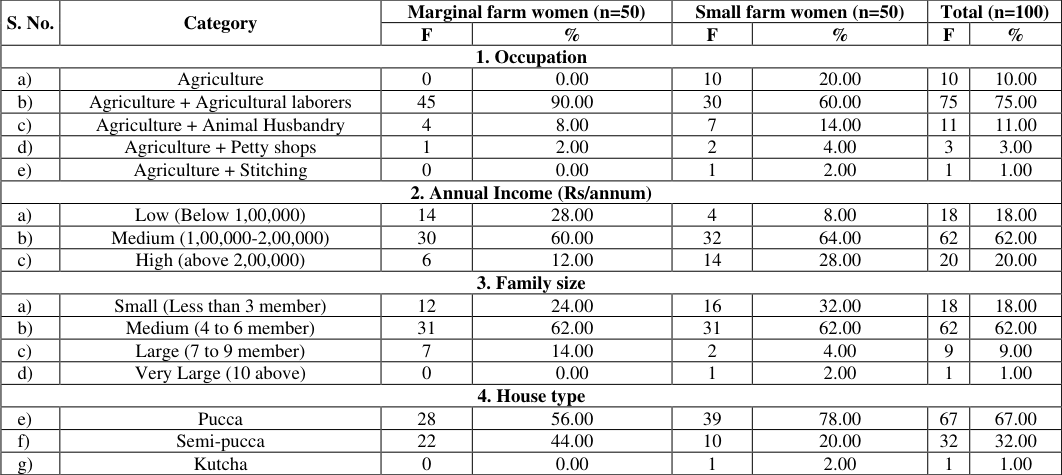 Table 1
 Table 2
 Table 3
Introduction
In rural areas, around 80 percent of all economically active women work in the agricultural and related sectors, where 33 percent of the labor force is employed in the agricultural sector. In Indian villages, women carry out a wide range of tasks, such as taking care of the family's necessities and engaging in domestic income-generating activities like farming and animal husbandry (Singh et al. 2014) [3] . According to the report by the UN Commission on the Status of Women (2012) [5] , fieldwork and domestic chores account for 16 to 18 hours of work per day for rural women. In fact, rural Indian women's lives are marked by a heavy workload and an extensive range of their responsibilities. It is crucial, then, to comprehend how women's experiences with wellbeing are affected by these conditions. The Latin term for satisfaction implies "to make or do enough." Contentment with accepting one's life circumstances or having one's desires and needs met for the duration of one's life are prerequisites for being satisfied with one's life. Life satisfaction is essentially an individual's subjective evaluation of the quality of their existence. Life satisfaction judgments have a significant cognitive component because they are by nature evaluations. Satisfaction with life, especially when it comes to having wants and expectations met. A feeling of well-being can be measured by considering factors including mood, contentment with relationships and goals attained, selfperceived coping skills, and self-concepts. (Sethi, 2009) [2] . Self-perceived life satisfaction is a measure of well-being and may be assessed in terms of mood, satisfaction with relations with others and with achieved goals, self-concepts, and self-perceived ability to cope with daily life. It is having a favorable attitude of one's life as a whole rather than an assessment of current feelings. Life satisfaction has been measured in relation to economic standing, amount of education, experiences, and residence, as well as many other www.extensionjournal.com topics. (Diener, 1984) [1] . Self-perceived life satisfaction comes under SDG 3 i.e., Good health and well-being.
Objective
To study the relationship between independent variables and self-perceived life satisfaction of farm women.
Methodology
For the present study, Ex post facto research design was adopted to assess the self-perceived life satisfaction of rural farm women. The sample for the study includes 50 marginal and 50 small farm women, total comprising of 100 respondents were selected from two districts i.e., Nalgonda and Yadadri Bhuvanagiri through random sampling method. Self-perceived Life satisfaction was measured by using scale developed by Singh and Joseph which consists of 35 statements with 5-point Likert scale. Data was collected using structured interview schedule and scale. Data was analyzed with the help of frequency, percentage and correlation. The results from Table 1 inferred that with regard to marginal farm women, high majority (90.00%) of farm women were engaged in agriculture + agricultural laborers, followed by agriculture + animal husbandry (8.00%) and only 2.00 percent of respondents were engaged in agriculture + petty shops. With regard to small farm women, majority (60.00%) of the respondents were engaged in agriculture + agricultural laborers, followed by agriculture + animal husbandry (14.00%), 4.00 percent of respondents were engaged in agriculture + petty shops and only 2.00 percent of respondents were engaged in agriculture + stitching. Overall, three fourth (75.00%) of the respondents were engaged in agriculture + agricultural laborers, followed by agriculture + animal husbandry (11.00%), 10.00 percent of respondents were engaged in agriculture, 3.00 percent of respondents were engaged in agriculture + petty shops and only 1.00 percent of respondents were engaged in agriculture + stitching.
| S. No. | Category | Marginal farm women (n=50) | — | Small farm women (n=50) | — | Total (n=100) | — |
|---|---|---|---|---|---|---|---|
| F | % | F | % | F | % | ||
| 1. Occupation | |||||||
| a) | Agriculture | 0 | 0.00 | 10 | 20.00 | 10 | 10.00 |
| b) | Agriculture + Agricultural laborers | 45 | 90.00 | 30 | 60.00 | 75 | 75.00 |
| c) | Agriculture + Animal Husbandry | 4 | 8.00 | 7 | 14.00 | 11 | 11.00 |
| d) | Agriculture + Petty shops | 1 | 2.00 | 2 | 4.00 | 3 | 3.00 |
| e) | Agriculture + Stitching | 0 | 0.00 | 1 | 2.00 | 1 | 1.00 |
| 2. Annual Income (Rs/annum) | |||||||
| a) | Low (Below 1,00,000) | 14 | 28.00 | 4 | 8.00 | 18 | 18.00 |
| b) | Medium (1,00,000-2,00,000) | 30 | 60.00 | 32 | 64.00 | 62 | 62.00 |
| c) | High (above 2,00,000) | 6 | 12.00 | 14 | 28.00 | 20 | 20.00 |
| 3. Family size | |||||||
| a) | Small (Less than 3 member) | 12 | 24.00 | 16 | 32.00 | 18 | 18.00 |
| b) | Medium (4 to 6 member) | 31 | 62.00 | 31 | 62.00 | 62 | 62.00 |
| c) | Large (7 to 9 member) | 7 | 14.00 | 2 | 4.00 | 9 | 9.00 |
| d) | Very Large (10 above) | 0 | 0.00 | 1 | 2.00 | 1 | 1.00 |
| 4. House type | |||||||
| e) | Pucca | 28 | 56.00 | 39 | 78.00 | 67 | 67.00 |
| f) | Semi-pucca | 22 | 44.00 | 10 | 20.00 | 32 | 32.00 |
| g) | Kutcha | 0 | 0.00 | 1 | 2.00 | 1 | 1.00 |
Table text extracted from the original PDF; superscript letters are shown inline. The original table image is below.
View original table image
Results and Discussion
The results inferred that among marginal farm women, majority (60.00%) of the respondents belonged to medium annual income followed by low annual income (28.00%) and high annual income (12.00%). While among small farm women, majority (64.00%) of respondents belonged to medium annual income followed by high annual income (28.00%) and low annual income (8.00%). Overall, majority (62.00%) of the respondents belonged to medium annual income and low annual income (28.00%).
The findings of the study indicated that among marginal farm women, more than half (62.00%) of the respondents had medium family size followed by small family size (24.00%) and large family size (14.00%). With regard to small farm women, majority (62.00%) of the respondents had medium family size followed by small family size (32.00%), large family size (4.00%) and very large family size (2.00%). Overall, majority (62.00%) of the respondents had medium family size and only 1.00 percent had very large family size.
The results of the study from Table 1 inferred that among marginal farm women, maximum number (44.00%) of the respondents residing in pucca house and semi-pucca house (44.00%). While among the small farm women, little more than three fourth (78.00%) of the respondents residing in pucca house followed by semi-pucca house (20.00%) and only 2.00 percent of them were residing in kutcha house. Overall, majority (67.00%) of the respondents residing in pucca house and very few (2.00%) of them were residing in kutcha house. www.extensionjournal.com The results revealed that among marginal farm women, majority (62.00%) of the respondents had medium selfperceived life satisfaction and 38.00 percent of the respondents had high self-perceived life satisfaction. Among small farm women, majority (56.00%) of the respondents had medium self-perceived life satisfaction and 44.00 percent of the respondents had high self-perceived life satisfaction. Overall, majority (59.00%) of the respondents had medium self-perceived life satisfaction and 41.00 percent of the respondents had high self-perceived life satisfaction. From the results of Table 3 it could be observed that there was a negative and significant relationship between family size, house type and self-perceived life satisfaction among marginal farm women at the 0.05 level of probability. There was a positive and significant relationship between the annual income and self-perceived life satisfaction among marginal farm women at the 0.05 level of probability. It emphasized that as the annual income increases; there was an increase in self-perceived life satisfaction among the farm women of marginal land holding. It was evident from the Table 3 that there was a positive and significant relationship between the occupation and selfperceived life satisfaction among small farm women at the 0.05 level of probability. There was a negative and significant relationship between the family size and selfperceived life satisfaction among small farm women at the 0.05 level of probability. It depicted that as the family size increases, the self-perceived life satisfaction decreases among the farm women of small land holding.
Conclusion
The study examined the livelihood patterns and socioeconomic factors influencing the life satisfaction of marginal and small farm women. Results showed that a significant majority of the farm women were engaged in agriculture and agricultural labor, highlighting their integral role in agricultural activities. Annual income levels varied, with most respondents falling into medium income categories. Family size and housing type were also significant factors, with medium-sized families and pucca houses being predominant. In terms of self-perceived life satisfaction, a majority of respondents reported medium levels, indicating a moderate sense of satisfaction with their lives. Annual income had a positive correlation with life satisfaction among marginal farm women, while for small farm women, occupation and family size were significant factors. Overall, the study underlines the complex interplay between socio-economic factors and self-perceived life satisfaction among marginal and small farm women. Policy interventions should focus at improving income levels, housing conditions, and family support could potentially enhance the well-being and life satisfaction of the farm women, thereby contributing to their overall empowerment and improved quality of life.
Figures and tables from the paper
| S. No. | Category | Marginal farm women (n=50) | — | Small farm women (n=30) | — | Total (n=100) | — |
|---|---|---|---|---|---|---|---|
| F | % | F | % | F | % | ||
| 1. | Low (35-81) | 0 | 0.00 | 0 | 0.00 | 0 | 0.00 |
| 2. | Medium (82-128) | 31 | 62.00 | 28 | 56.00 | 59 | 59.00 |
| 3. | High (129-175) | 19 | 38.00 | 22 | 44.00 | 41 | 41.00 |
| Total | 50 | 100.00 | 50 | 100.00 | 60 | 100.00 |
Table text extracted from the original PDF; superscript letters are shown inline. The original table image is below.
View original table image
References
3 in the original paper- Diener E. Subjective well-being. Psychol Bull. 1984;95:542-575.
- Singh K, Kaur J, Singh D, Junnarkar M. SocioDemographic Variables Affecting Well-Being: A Study on Indian Rural Women. Psychol Stud. 2014;59(2):197206.
- United Nations (Commission on the Status of Women). Report on the fifty-sixth session (14 March 2011, 27 February-9 March and 15 March 2012). Retrieved from http://www.un.org/ga/search/view_doc.asp?symbol=E/ 2012/27.