
Research article · 2024 · Full text
International Journal of Advanced Biochemistry ResearchPerformance of taro (Colocasia esculenta L.) genotypes for qualitative traits under Marathwada conditions
Volume 8(2) · Pages 383–385 · DOI: 10.33545/26174693.2024.v8.i2e.571 ↗
Research areasPacific and Southeast Asian StudiesLivestock and Poultry Management
Abstract
Author-writtenThe experiment was laid out in Randomized Block Design with 21 treatments replicated thrice. Taro genotypes with "Apex down" leaf position include G1-G4, G6, G8, G9, G11, G13, G14, G15, and G21. Those with "Cup shaped" are G5, G7, G10, G12, and G16-G20. For leaf blade color, G6-G9, G16-G19 and G21 are "Dark green", G1-G4, G10-G15 and G20 are "Green". Genotypes G4, G7, and G17 have "Green" petioles, G1-G3, G6, G8-G13, and G15 are "Light green", G16 and G18-G21 are "Brown", and G5 and G14 are "Yellow". Finally, G1-G4, G6, G7, and G9-G21 have "Dumb bell" corms, while G5 and G8 have "Conical" and "Round" corms respectively. Higher amount of reducing sugar (3.58%) and starch content (22.51%) was recorded in (G9) DPLT-9.
Summary
Source-checkedPlain-language reading of the full paper, prepared with AI and checked against the text. Each point links to the authors' own words.
Why it matters
- Taro is an important tuber crop, but it remains largely underutilized and is grown in only a few regions of India. View evidence ↗
- In the Marathwada region of Maharashtra, taro leaves and corms are widely eaten, yet the crop is not grown commercially for high yields or market sale. View evidence ↗
- There is currently very little knowledge regarding high-yielding taro varieties, and no specific variety has been recommended for cultivation in the Marathwada region. View evidence ↗
The question
- The study aimed to evaluate various taro genotypes based on their qualitative traits to identify suitable options for the region. View evidence ↗
What they did
- The research was carried out at the College of Horticulture, Vasantrao Naik Marathwada Krishi Vidyapeeth in Parbhani, Maharashtra, during 2022-2023. View evidence ↗
- The experiment utilized a Randomized Block Design featuring twenty different taro genotypes, each replicated three times. View evidence ↗
- Leaf lamina position, leaf blade color, petiole color, and corm shape were visually assessed using the International Plant Genetic Resources Institute (IPGRI) descriptors. View evidence ↗
- Reducing sugar content was measured using the Lane Eynons method, and starch content in cormels was determined via the anthrone reagent method on a dry weight basis. View evidence ↗
- Acridity was determined through oral tasting of raw leaves and boiled corms. View evidence ↗
What they found
- Reducing sugar content ranged from 1.38% to 3.58%, with the highest value found in G9 (DPLT-9) at 3.58% and the lowest in G12 (DPLT-12) at 1.38%. View evidence ↗
- Starch content peaked in G9 (DPLT-9) at 22.51% and was lowest in G5 (DPLT-5) at 12.57%. View evidence ↗
What it means
- The authors concluded that DPLT-9 (G9) is superior for reducing sugar and starch content, while PBNT-1 (G16) is desirable due to its lower acridity. View evidence ↗
- The authors suggest that these qualitative parameters can be used to improve taro through future breeding programs. View evidence ↗
Visual summary
2 visualsIllustrations explain the paper; charts are replotted from the paper's own table values.
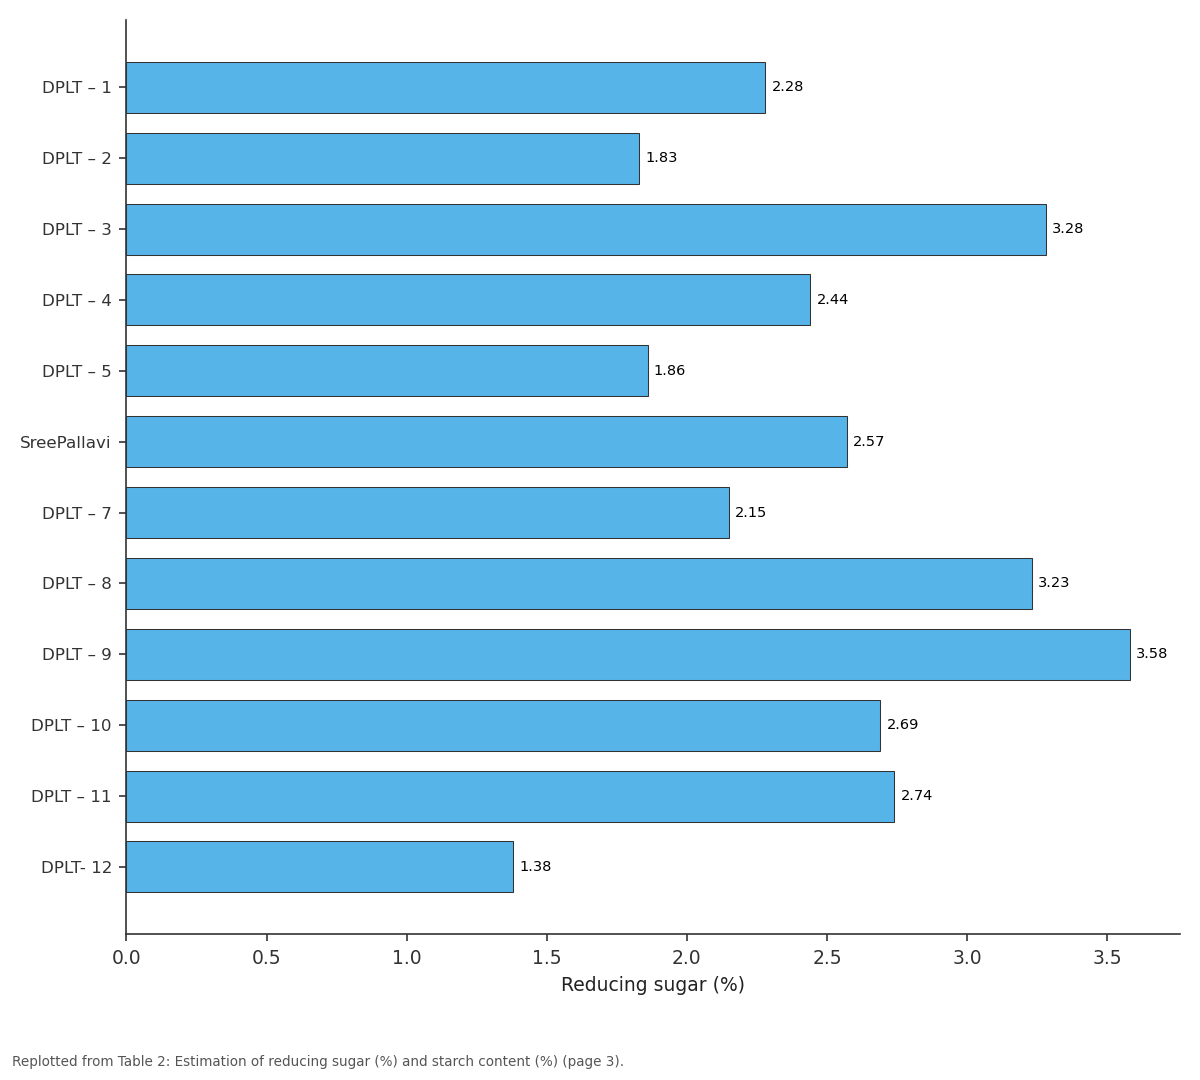
Reducing sugar (%): DPLT – 1 vs DPLT – 2 vs DPLT – 3 vs DPLT – 4 vs DPLT – 5
Replotted from Table 2 (page 3) of the original paper. Every bar is the paper's own table value.
View source evidence ↗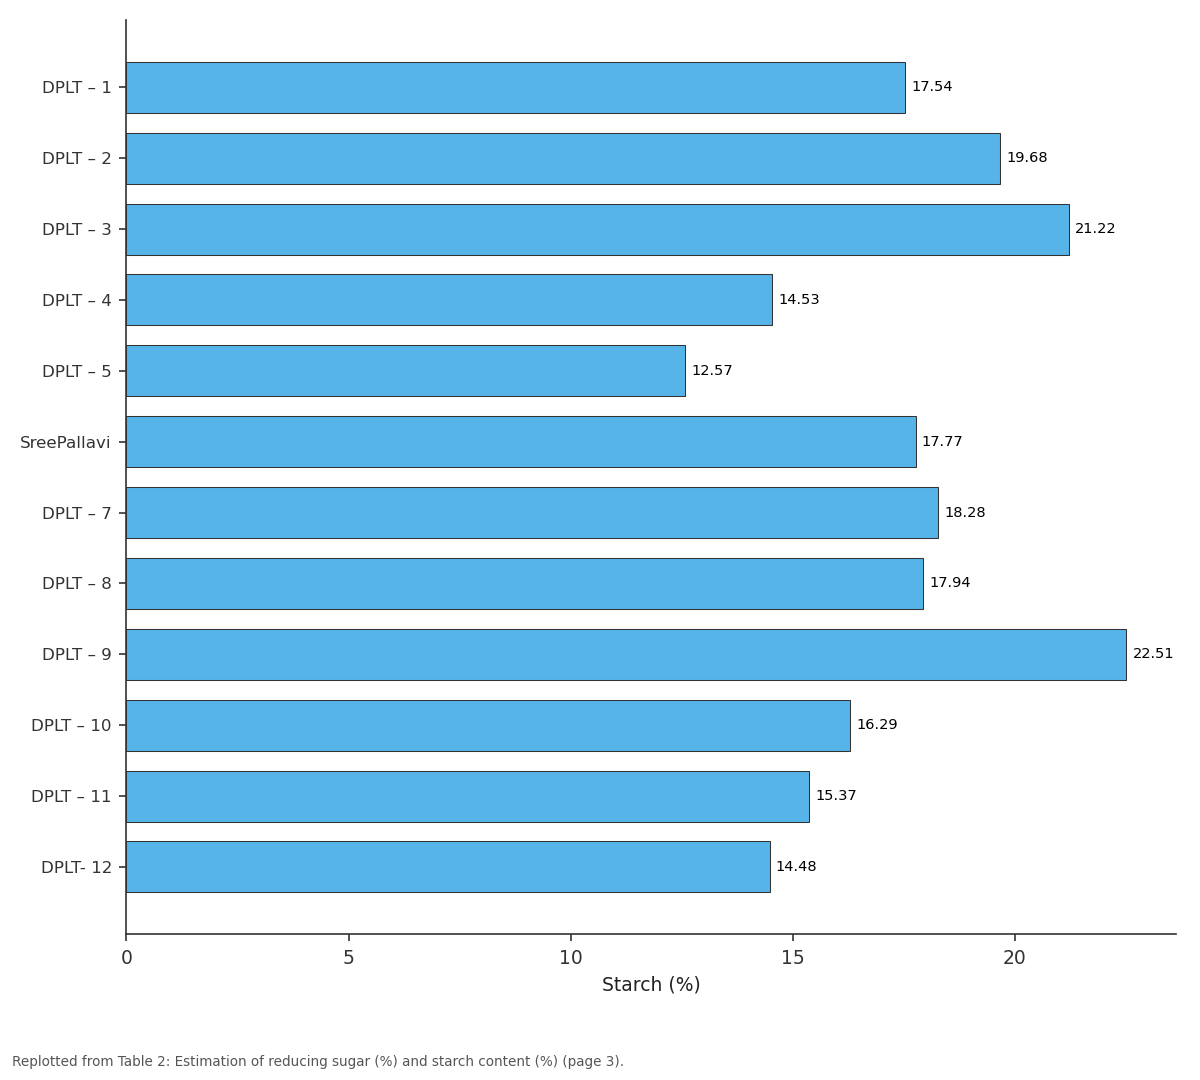
Starch (%): DPLT – 1 vs DPLT – 2 vs DPLT – 3 vs DPLT – 4 vs DPLT – 5
Replotted from Table 2 (page 3) of the original paper. Every bar is the paper's own table value.
View source evidence ↗Figures & tables
From the original paper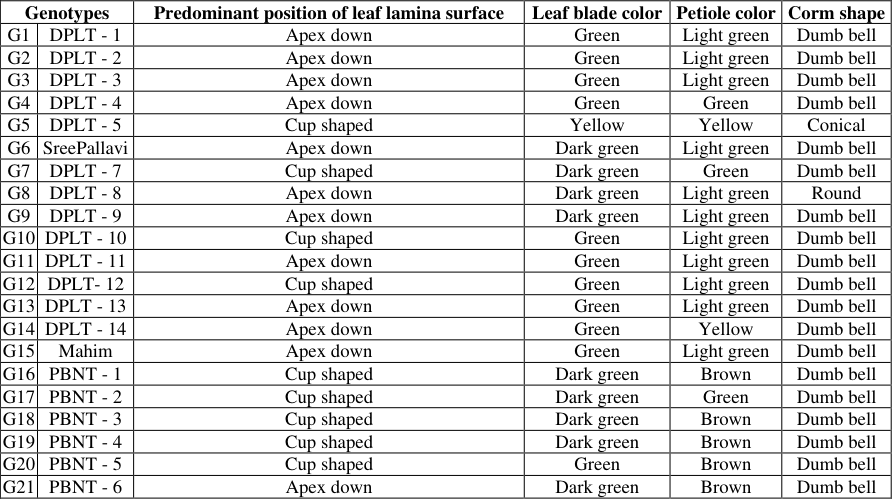 Table 1
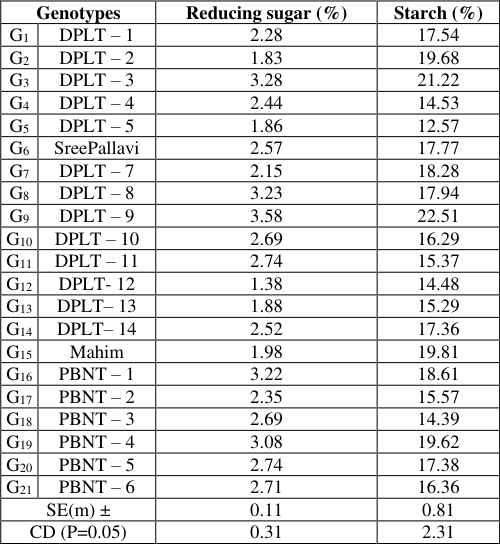 Table 2
Introduction
Taro is a significant tuber crop. It is also a largely underutilized crop in India and is being grown only in a few areas. Its genotypes have not been extensively studied in terms of qualitative. Inspite of its leaves and corms are widely consumed in the Marathwada region of Maharashtra, but it is not commercially grown for high yield and market purposes. As a result, there is a little knowledge on high-yielding varieties, and no variety is suggested for cultivation in this region. However, except from a few attempts of cultivar collection and evaluation, not much work has been done so far in this crop towards the production of high yielding suitable varieties (Plucknette et al., 1970) [6] . Therefore, it was felt necessary to conduct well-planned research in order to evaluate suitable taro genotypes for its qualitative traits.
Methodology
The present investigation was conducted at College of Horticulture, Vasantrao Naik Marathwada Krishi Vidyapeeth, Parbhani (Maharashtra), during the year 2022-2023. The experiment was set up in a Randomized Block Design with twenty genotypes replicated thrice. According to the descriptor of International Plant Genetic Resources Institute (IPGRI), young, fully opened leaves were chosen to observe the position of the leaf lamina, the shapes of the leaf lamina were: (1) drooping; (2) horizontal; (3) cup-shaped; (4) erectapex up and (5) erect-apex down. The color of the leaf blade and petiole color were observed on fully expanded and mature leaf with the help of IPGRI descriptor. Corm shapes were visually observed with the help of descriptors of IPGRI. As a result, corm morphologies were classified into eight different categories as conical (1), round (2), cylindrical (3), elliptical (4), dumb-bell (5), elongated (6), flat and multifaced (7) and clustered (8). The reducing sugars content was estimated by Lane Eynons method. Starch content in the cormels was estimated by anthrone reagent method on dry weight basis. The acridity of taro was tested orally by tasting the raw leaves and boiled corms of the taro and accordingly presence or absence of acridity was determined.
Results and Discussion
During the investigation, several qualitative traits of twenty one taro genotypes were recorded and are presented in Table 1.
| Genotypes | — | Predominant position of leaf lamina surface | Leaf blade color | Petiole color | Corm shape |
|---|---|---|---|---|---|
| G1 | DPLT - 1 | Apex down | Green | Light green | Dumb bell |
| G2 | DPLT - 2 | Apex down | Green | Light green | Dumb bell |
| G3 | DPLT - 3 | Apex down | Green | Light green | Dumb bell |
| G4 | DPLT - 4 | Apex down | Green | Green | Dumb bell |
| G5 | DPLT - 5 | Cup shaped | Yellow | Yellow | Conical |
| G6 | SreePallavi | Apex down | Dark green | Light green | Dumb bell |
| G7 | DPLT - 7 | Cup shaped | Dark green | Green | Dumb bell |
| G8 | DPLT - 8 | Apex down | Dark green | Light green | Round |
| G9 | DPLT - 9 | Apex down | Dark green | Light green | Dumb bell |
| G10 | DPLT - 10 | Cup shaped | Green | Light green | Dumb bell |
| G11 | DPLT - 11 | Apex down | Green | Light green | Dumb bell |
| G12 | DPLT- 12 | Cup shaped | Green | Light green | Dumb bell |
| G13 | DPLT - 13 | Apex down | Green | Light green | Dumb bell |
| G14 | DPLT - 14 | Apex down | Green | Yellow | Dumb bell |
| G15 | Mahim | Apex down | Green | Light green | Dumb bell |
| G16 | PBNT - 1 | Cup shaped | Dark green | Brown | Dumb bell |
| G17 | PBNT - 2 | Cup shaped | Dark green | Green | Dumb bell |
| G18 | PBNT - 3 | Cup shaped | Dark green | Brown | Dumb bell |
| G19 | PBNT - 4 | Cup shaped | Dark green | Brown | Dumb bell |
| G20 | PBNT - 5 | Cup shaped | Green | Brown | Dumb bell |
| G21 | PBNT - 6 | Apex down | Dark green | Brown | Dumb bell |
Table text extracted from the original PDF; superscript letters are shown inline. The original table image is below.
View original table image
Predominant position of leaf lamina surface
Taro genotypes G 1 , G 2 , G 3 , G 4 , G 6 , G 8 , G 9 , G 11 , G 13 , G 14 , G 15 and G 21 had "Apex down" predominant position of leaf lamina surface and G 5 , G 7 , G 10 , G 12 , G 16 , G 17 , G 18 , G 19 and G 20 had "Cup shaped" predominant position of leaf lamina surface. Among the cultivars, two unique leaf orientations were identified. The predominant leaf position was the "Apex down" type, seen in the majority of the cultivars. In contrast, only a few cultivars displayed a "Cup shaped" orientation. The observed variation between the cultivars is likely attributable to genetic factors (Ankush 2017) [2] .
Leaf blade color
Genotypes G 6 , G 7 , G 8 , G 9 , G 16 , G 17 , G 18 , G 19 and G 21 were "Dark green" leaf blade color and genotypes G 1 , G 2 , G 3 , G 4 , G 10 , G 11 , G 12 , G 13 , G 14 , G 15 and G 20 were "Green" leaf blade color, whereas genotypes G 5 was "Yellow" leaf blade color. Variations in leaf blade colors like dark green, green, yellow were noticed, potentially resulting from varietal differences. Chlorophyll, being the primary pigment responsible for the green coloration in plants, can cause changes in leaf shade depending on its concentration. Lower or higher chlorophyll levels could lead to paler or deeper green shades, respectively. Mabhaudi and Modi 2013 [3] and Ankitha 2018 [1] also reported similar variations in their work.
Petiole color
Taro genotypes G 4 , G 7 and G 17 had "Green" petiole color, genotypes G 1 , G 2 , G 3 , G 6 , G 8 , G 9 , G 10 , G 11 , G 12 , G 13 and G 15 had "Light green" petiole color. While, genotype G 16, G 18 , G 19, G 20 and G 21 had "Brown" petiole color and genotypes G 5 and G 14 had "Yellow" petiole color. Similar variations were reported by Mabhaudi and Modi 2013 [3] and Ankitha 2018 [1] . The observed variations in petiole color are due to genetic makeup among the various genotypes.
Corm shape
Genotypes G 1 , G 2 , G 3 , G 4 , G 6 , G 7 , G 9 , G 10 , G 11 , G 12 , G 13 , G 14 , G 15 , G 16 , G 17 , G 18 , G 19 , G 20 and G 21 were having "Dumb bell" corm shape, whereas G 5 and G 8 were having "Conical" and "Round" corm shape respectively. Similar variations were found by Ankitha 2018 [1] . The variation in corm shape may result from genetic variations among the distinct genotypes.
Reducing sugar (%) Significant differences in reducing sugar content among the genotypes were observed and are illustrated in Table 2. The reducing sugar was varied from 1.38% to 3.58%. Highest amount of reducing sugar (3.58%) was recorded in (G 9 ) DPLT-9 and was statistically at par with (G 3 ) DPLT-3 (3.28%). Whereas, lowest reducing sugar (1.38%) was found in the genotype (G 12 ) DPLT-12. Sucrose is a predominant sugar in taro. Sugar content plays a crucial role in determining the suitability of taro for processing. The significant variations observed in the chemical composition of various taro cultivars are likely primarily attributed to varietal differences (Manisha et al., 2021 and Sangeeta et al., 2023) [5,7] .
| Genotypes | — | Reducing sugar (%) | Starch (%) |
|---|---|---|---|
| G1 | DPLT – 1 | 2.28 | 17.54 |
| G2 | DPLT – 2 | 1.83 | 19.68 |
| G3 | DPLT – 3 | 3.28 | 21.22 |
| G4 | DPLT – 4 | 2.44 | 14.53 |
| G5 | DPLT – 5 | 1.86 | 12.57 |
| G6 | SreePallavi | 2.57 | 17.77 |
| G7 | DPLT – 7 | 2.15 | 18.28 |
| G8 | DPLT – 8 | 3.23 | 17.94 |
| G9 | DPLT – 9 | 3.58 | 22.51 |
| G10 | DPLT – 10 | 2.69 | 16.29 |
| G11 | DPLT – 11 | 2.74 | 15.37 |
| G12 | DPLT- 12 | 1.38 | 14.48 |
| G13 | DPLT– 13 | 1.88 | 15.29 |
| G14 | DPLT– 14 | 2.52 | 17.36 |
| G15 | Mahim | 1.98 | 19.81 |
| G16 | PBNT – 1 | 3.22 | 18.61 |
| G17 | PBNT – 2 | 2.35 | 15.57 |
| G18 | PBNT – 3 | 2.69 | 14.39 |
| G19 | PBNT – 4 | 3.08 | 19.62 |
| G20 | PBNT – 5 | 2.74 | 17.38 |
| G21 | PBNT – 6 | 2.71 | 16.36 |
| SE(m) ± | 0.11 | 0.81 | |
| CD (P=0.05) | 0.31 | 2.31 |
Table text extracted from the original PDF; superscript letters are shown inline. The original table image is below.
View original table image
The highest amount of starch (22.51%) was obtained in (G 9 ) DPLT-9, which was statistically at par with (G 3 ) DPLT-3 (21.22%). While, lowest amount of starch (12.57%) was found in the genotype (G 5 ) DPLT-5. The observed variations in starch content might be influenced by various factors, including soil conditions, environmental factors, and inherent genetic differences (Mandal et al., 2015) [4] .
Conclusions
It may be concluded that, among the twenty-one taro genotypes, DPLT-9 (G 9 ) recorded highest amount of reducing sugar and starch content. Whereas, leaves of PBNT-1 (G 16 ) found less acrid as compared to rest of the genotypes which is considered as desirable character.
Therefore, these qualitative parameters may helpful to bring improvement in taro by undertaking breeding programs in near future.
References
5 in the original paper- Mabhaudhi T, Modi AT. Preliminary Assessment of Genetic Diversity in three Taro (Colocasia esculenta L. Schott) Landraces Using Agromorphological and SSR DNA Characterization. J Agric Sci Technol. 2013;3:265-271.
- Mandal R, Mandal N, Mitra S, Mukharjee A, Tarafdar J. Development of DUS standard for taro [Colocasia esculenta var. antiquorum (L.) Schott.] using digital morphometrics. Appl Biol Res. 2015;17:70-76.
- Manisha MC, Mitra S, Jamir AR, Kongbrailatpam M. Evaluation of physicochemical properties in different cultivars of Taro [Colocasia esculenta (L.) Schott]: A comparative study. Pharm Innov J. 2021;40:1-9.
- Plucknett DL, De la Pena RS, Obero F. Taro (Colocasia esculenta). A Review of Field Crop. 1970;23:413-426.
- Sangeeta D, Latha GK, Arunkumar B, Ravi CS, Kantharaj Y, Kumar HY. Evaluation of Taro (Colocasia esculenta L.) Genotypes for Growth, Yield and Quality Attributes under the Hill Zone of Karnataka. Biol Forum Int J. 2023;15:36-41.
Cited by 1
From OpenAlex, OpenCitations and reference lists read by Scinovex
- Extent and patterns of morphological and molecular genetic diversity and population structure of Nigerian Taro cultivars ↗
Joy Jesumeda Oladimeji, Ayodeji Abe, Pullikanti Lava Kumar, Paterne Angelot Agre, Oluyinka Johnson Ilesanmi, Ramesh Raju Vetukuri et al. · BMC Plant Biology · 2024
BACKGROUND: Genetic diversity is crucial for conservation efforts as well as breeding programs targeted at the development of improved varieties. Taro, a climate-resilient crop, plays a vital role in the nutritional and economic livelihoods of many households in Nigeria, but its yield is very low due to inadequate genetic improvement efforts. A diversity assessment of Nigerian taro is therefore required…
❝ 4PDF