
Research article · 2024 · Full text
International Journal of Agriculture and Food ScienceEffect of intra row spacing and NPS fertilizer rate on yield and yield components of Mung bean (Vigna radiata L.) in Arba Minch district, Southern Ethiopia
Volume 6(1) · Pages 01–08 · DOI: 10.33545/2664844x.2024.v6.i1a.158 ↗
Research areasAgronomic Practices and Intercropping SystemsAgricultural pest management studiesLegume Nitrogen Fixing Symbiosis
Abstract
Author-writtenMung bean is becoming an important pulse crop in dry land areas of Ethiopia. However, its productivity is influenced by intra row spacing and nutrient management in a given environment. Accordingly, a field experiment was conducted to determine the optimum level of intra row spacing and NPS fertilizer rate for enhanced productivity of mung bean in Arba Minch district. It was carried out during the 2021 cropping season and the treatments consisted of factorial combinations of four intra row spacing (5, 10, 15 and 20 cm) with five NPS fertilizer rates (0, 50, 100, 150 and 200 kg ha-1) laid out in RCBD with three replications. Results revealed that interaction of intra row spacing and NPS fertilizer rate was significant (p0.05) for number of days to flowering, nodulation parameters, number of primary branches per plant, number of seeds per pod and hundred seed weight. It was observed that NPS fertilizer rate highly significantly affected number of days to 50% flowering, number of primary branches per plant, and nodule parameters, the highest values of which were recorded for application of 200 kg ha-1, whereas the highest number of seeds per pod, and hundred seed weight were recorded for 100 kg of NPS ha-1. The result also showed that intra row spacing of 20 cm showed significantly higher values for number of days to 50% flowering, number of primary branches per plant, number of seed per pod and hundred seed weight. The interaction effect resulted in the highest number of days to 90% physiological maturity for recorded 20 cm with 200NPS kgha-1 while showed maximum values of plant height, leaf area index and above ground dry biomass yield for recorded 5 cm with NPS 200 kgha-1. On the other hand, significantly higher values of number of pods per plant, seed yield, harvest index and net-return with acceptable MRR were recorded for intra row spacing of 10 cm with 100 kg of NPS ha-1. Therefore, it was concluded that application of 100 kg NPS fertilizer ha-1 with 10 cm intra row spacing could enable producers to harvest better mung bean yield and get more economic return from the crop in the study area.
Summary
Source-checkedPlain-language reading of the full paper, prepared with AI and checked against the text. Each point links to the authors' own words.
Why it matters
- Mung bean, known locally in Ethiopia as 'Masho', is a significant pulse crop for smallholders and has been designated as a key export commodity. View evidence ↗
- Mung bean productivity in Ethiopia is low compared to other countries, likely due to poor cultivation methods, lack of high-yielding varieties, and insufficient fertilizer use on marginal lands. View evidence ↗
- Optimizing the spacing between plants within a row can improve yields by managing how plants compete for available environmental resources. View evidence ↗
The question
- The study aimed to identify the optimal intra-row spacing and NPS fertilizer application rate to increase mung bean productivity in the Arba Minch district of Southern Ethiopia. View evidence ↗
What they did
- During the 2021 season, researchers used a randomized complete block design (RCBD) with three replications to test four spacing levels (5, 10, 15, and 20 cm) and five NPS fertilizer rates (0, 50, 100, 150, and 200 kg ha-1). View evidence ↗
- The distance between rows was kept constant at 40 cm, resulting in plant densities ranging from 125,000 to 500,000 plants per hectare depending on the intra-row spacing. View evidence ↗
- The researchers measured phonological attributes (flowering and maturity dates), growth attributes (leaf area, plant height, branches), and yield components (pods, seeds, and biomass) using five randomly selected plants per plot. View evidence ↗
What they found
- Flowering occurred earliest with the narrowest spacing (5 cm at 41.12 days) and without fertilizer (39.88 days), while the widest spacing (20 cm at 43.9 days) and highest fertilizer rate (200 kg ha-1 at 44.6 days) delayed flowering. View evidence ↗
- The number of primary branches per plant was highest with the widest spacing (5.6 branches at 20 cm) and the highest fertilizer rate (5.58 branches at 200 kg ha-1). View evidence ↗
- NPS fertilizer significantly increased nodulation, with the highest total nodules (48.28) and effective nodules (24.54) occurring at 200 kg ha-1 compared to the unfertilized control (13.88 and 5.89, respectively). View evidence ↗
- The maximum plant height (71.77 cm) was achieved with narrow 5 cm spacing and 200 kg ha-1 of NPS, whereas the minimum height (43.96 cm) occurred with 20 cm spacing and no fertilizer. View evidence ↗
- Above-ground dry biomass yield peaked at 5,957.1 kg ha-1 with 5 cm spacing and 200 kg ha-1 of NPS, and was lowest at 3,130.3 kg ha-1 with 20 cm spacing and no fertilizer. View evidence ↗
- The maximum grain yield (2,245.5 kg ha-1) was achieved using 10 cm spacing and 100 kg ha-1 of NPS, while the lowest yield (569.9 kg ha-1) resulted from 20 cm spacing without fertilizer. View evidence ↗
- The harvest index was highest (42.28%) at 10 cm spacing with 100 kg ha-1 of NPS and lowest (17.01%) at 5 cm spacing without fertilizer. View evidence ↗
- Economically, the combination of 10 cm spacing and 100 kg ha-1 of NPS provided the highest net benefit (56,585.8 Birr ha-1) and the highest marginal rate of return (2,928.4%). View evidence ↗
What it means
- The authors conclude and recommend that mung bean growers in the study area and similar agro-ecologies use an intra-row spacing of 10 cm and an NPS fertilizer rate of 100 kg ha-1 for maximum yield and economic return. View evidence ↗
Visual summary
3 visualsIllustrations explain the paper; charts are replotted from the paper's own table values.
Optimal Growth Parameters
AI-generated conceptual illustration (Mung bean plants (Vigna radiata L.)). It explains the idea and does not show study data.
View source evidence ↗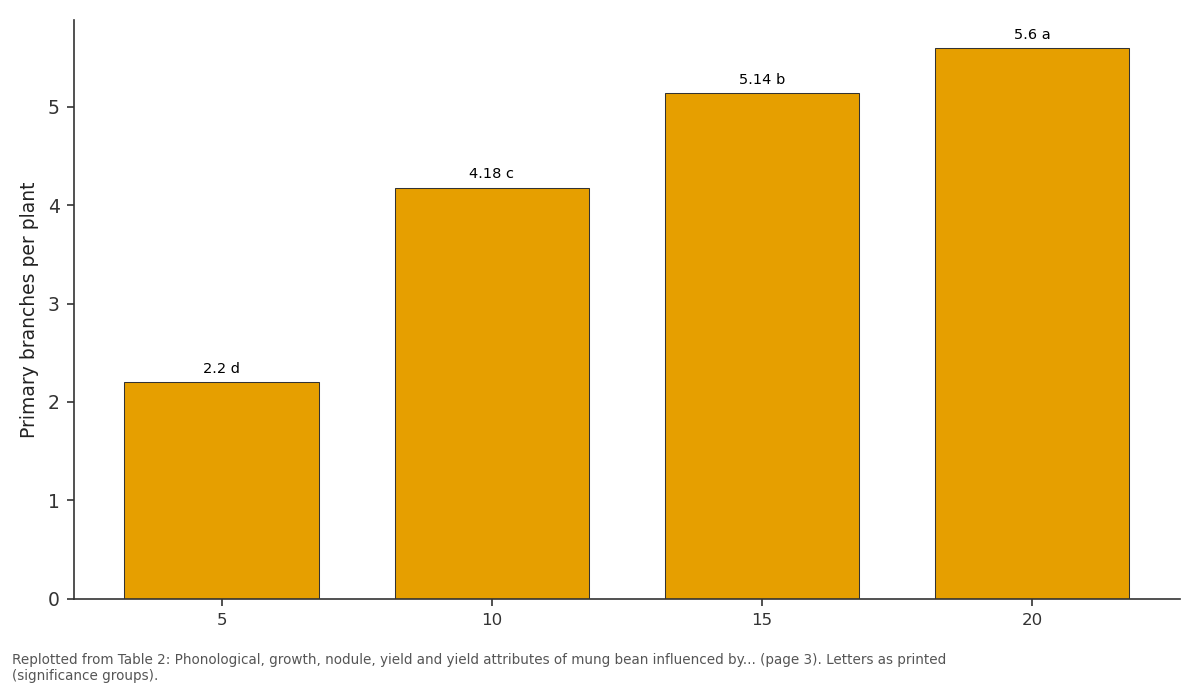
PB: 5 vs 10 vs 15 vs 20
Replotted from Table 2 (page 3) of the original paper. Every bar is the paper's own table value.
View source evidence ↗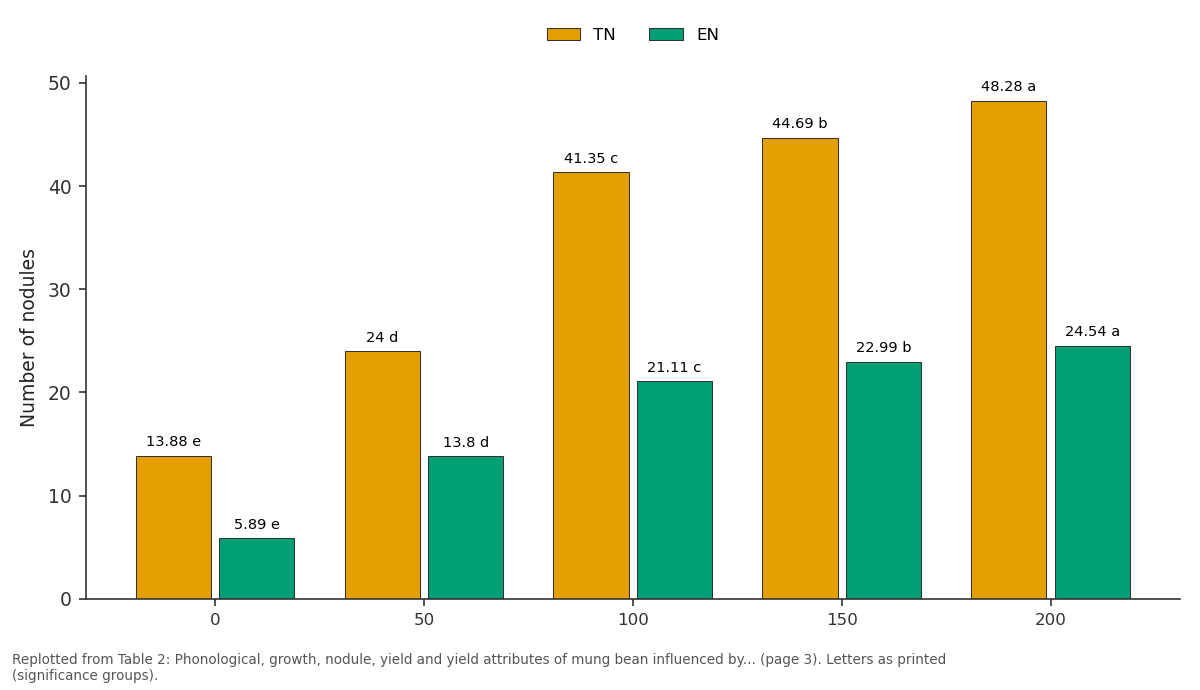
TN and EN: 0 vs 50 vs 100 vs 150 vs 200
Replotted from Table 2 (page 3) of the original paper. Every bar is the paper's own table value.
View source evidence ↗Figures & tables
From the original paper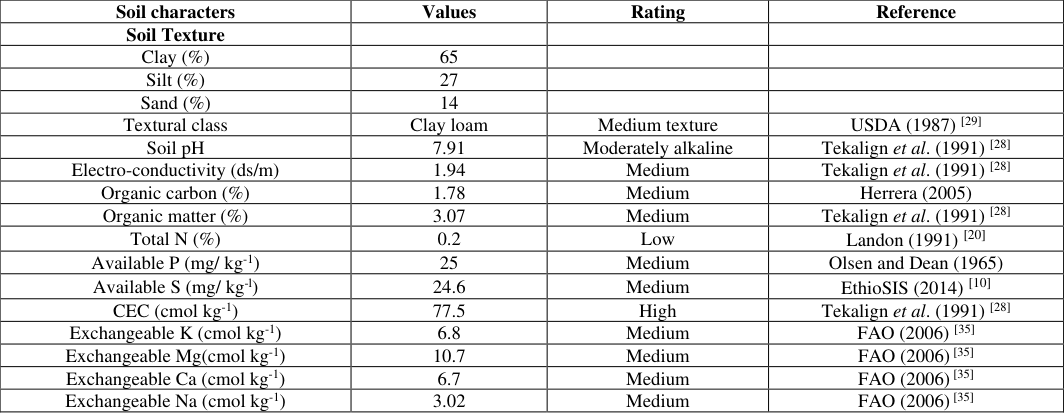 Table 1
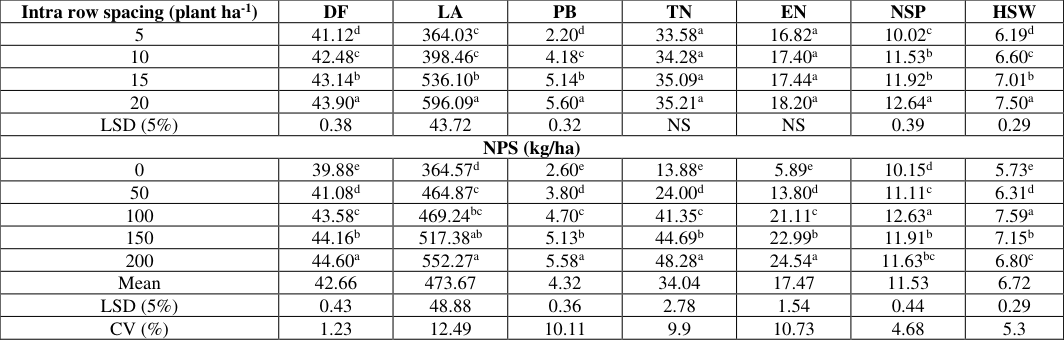 Table 2
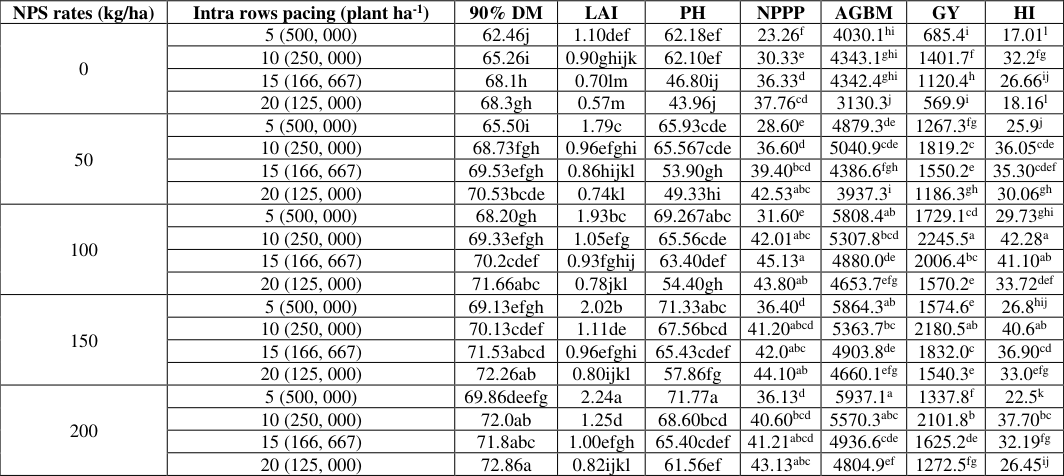 Table 3
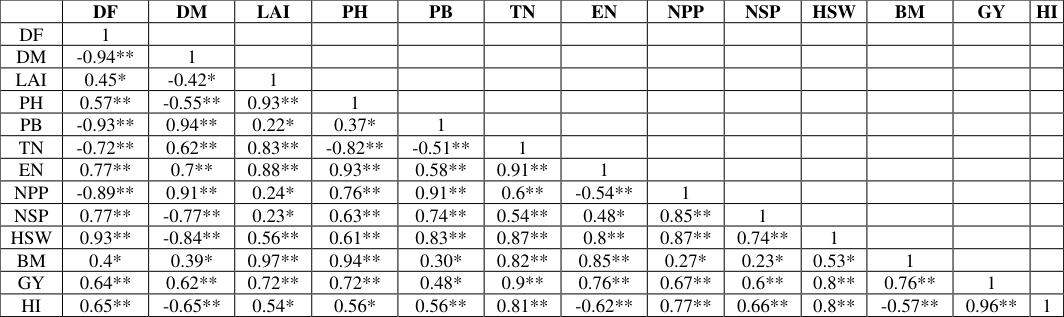 Table 4
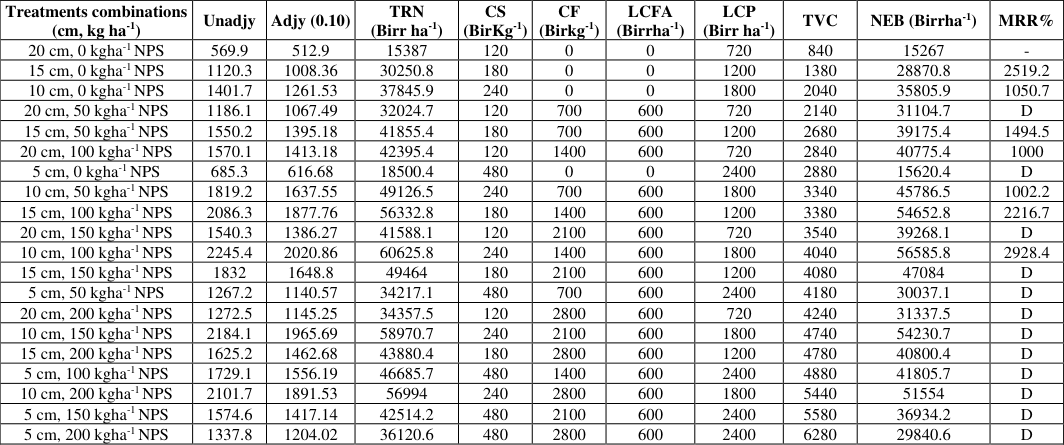 Table 4
Introduction
Mung bean (Vigna radiata L.) is among the important pulses cultivated in different agro ecological zones of the world (Khan et al. 2012) [19] . It is a warm-season annual crop characterized by fast growth under warm conditions, low water requirement, and excellent soil fertility enhancement through biological nitrogen fixation (Das et al. 2014; Yagoob and Yagoob, 2014) [5,32] . Mung bean is locally called "Masho" in Amharic. It is an important pulse crop for smallholders that has recently gained attention and was announced as the sixth export commodity by the Ethiopian Commodity Exchange (ECX 2014). According to CSA (2018) [4] , mung bean is produced at about 41 633.2 ha with a total production of 514 227.41 t and an average productivity of 1.23 t ha -1 in Ethiopia. Different authors reported low productivity of mung bean in Ethiopia compared to the production reported in other countries, which might be attributed to the cultivation of mung bean in marginal lands without sufficient fertilizer, methods of cultivation, poor crop stand, limited fertilizer application, poor plant protection measures, and lack of high yielding varieties were found to be the main reasons for low productivity. Nutrient management of mung bean affects crop growth, development and the final product.
According to Achakzai et al. (2012) [33] , reported by Sisay and Zenebe (2021) [34] , mung beans, like other legumes, require nitrogen, phosphorus, potassium, and sulfur for growth and development. The management of fertilizer is one crucial factor that significantly affects the growth and yield of the mung bean. Moreover, the intra-row spacing of plants depends on the availability of environmental resources for which plants compete and the growth patterns and morphological characteristics of the competing plants. In line with this, it has been reported that optimum intra row spacing of the plant can significantly improve mung bean yield (Kabir and Sarkar 2008; Singh et al. 2012) [16,27] . Thus, this study was initiated to determine the optimum intra-row spacing and NPS rate for improved productivity of mung bean in ARBA Minch district of Southern Ethiopia.
Methodology Description of the study area
The study was conducted in ARBA Minch district, Southern Ethiopia. It is geographically situated at 6°03'00'' N latitude and 37°36'00'' E longitude and an altitude of 1278 M.A.S.L. The district's average minimum and maximum temperatures are 17.30 °C and -30.60 °C, respectively. The rainfall pattern of the study district is characterized by a bimodal distribution in Belg and Meher seasons with an average total annual amount of 830.7 mm. The main crops grown mainly in the study district are teff, maize, and legumes, especially mung bean and haricot bean, and fruit trees, especially banana, mango, papaya, and avocado.
Experimental design and treatments
The experiment was laid out in randomized complete block design (RCBD) with three replications. The treatments consisted of 20 factorial combinations of four intra row spacing of mung bean plants (5, 10, 15 and 20 cm) and five levels of NPS fertilizer (0, 50, 100, 150 and 200 kgha -1 ). The inter-row spacing was set at 40 cm in all the plots, which corresponded to the plant density of 500000, 250000, 166000 and 125000 plants ha -1 . The total area of the field was 480 m 2 , with a net experimental area of 288 m 2 . The spacing between blocks and plots was 1.00 m and 0.50 m, respectively.
Experimental procedures and agronomic managements
The experimental field was prepared from February to March 2021 with oxen and then harrowed twice by human labour. All unwanted materials and plant residues were removed. The land was divided into three blocks, each with twenty plots. Treatments were randomly assigned to each plot. Fertilizer was hand drilled in rows of the respective plots. Two seeds per hill were sown and thinned to one plant per hill after establishment. All other field management practices were uniformly applied to all plots based on the recommendation for mung bean (EARO, 2016) [8] .
Soil Sampling Collection and Analysis
Soil samples were collected from 0-20 cm depth in a zigzag pattern using an auger at an interval of eight meters before the experimental field was ploughed. The samples from each spot were mixed thoroughly and quartered to obtain one representative composite sample. The composited samples of 1 kg were labelled correctly and then taken to the chemistry laboratory of ARBA Minch University.
Soil samples were analyzed for total nitrogen using the Kjeldahl digestion, distillation, and titration method as described by Black (1934) [31] . Soil pH was measured potentiometrically in 1:2.5 soil-water suspensions with a standard glass electrode pH meter (Van Reeuuwijik 1992) [30] . Available Phosphorus was determined using the Olsen extraction method as described by Olsen et al. (1954) [25] . Available sulfur was analysed by turbid metric method. Cation Exchange Capacity (CEC) was determined by the ammonium acetate method. Electro-conductivity was determined by a standard glass electrode using EC meter. The volumetric method determined Organic carbon content (Walkey and Black 1934) [31] . Exchangeable bases such as Ca, Mg, K and Na were determined after extracting the soil samples with ammonium acetate (1N NH 4 OAc) at pH 7.0. Exchangeable Ca and Mg in the extracts were analysed using an atomic absorption spectrophotometer, while Na and K were analyzed by flame photometer.
Crop data collection and analysis
Data on phonological attributes, such as days to 50% flowering and days to 90% physiological maturity were collected. Growth attributes such as leaf area, leaf area index, plant height and number of branches per plant were determined from five randomly selected plants. The total number of nodules per plant was determined by counting the number of nodules produced by five randomly selected plants from destructive rows of each plot. Cutting each nodule with a sharp blade determined the number of effective nodules per plant. Yield and yield components such as number of pods per plant, number of seeds per pod and total above ground dry biomass yield were determined from five plants harvested from the central rows of each plot. Hundred seed weight was determined by the weight of a hundred randomly sampled seeds after threshing and adjusting to 10% moisture content. Grain yield was measured by harvesting and threshing five randomly selected plants from the central rows of each plot. Harvest Index was recorded as the ratio of grain yield to total above ground biomass yield and multiplied by one hundred.
Statistical analysis
Data collected for various growth, yield, and yield related parameters were subjected to Analysis of Variance (ANOVA) using statistical analysis software (SAS, version 9.0). Interpretations were made following the procedure described by Gomez and Gomez (1984) [36] , and mean separation was carried out using the Least Significant Difference (LSD) test at 5% P level. A simple correlation analysis was done using SAS, version 9.0, to determine the relationship between plant parameters affected by intra-row spacing and NPS fertilizer [14] .
Partial budget analysis
The partial budget analysis was carried out using the methodology described by CIMMYT (1988) [3] . To determine yield and profit maximization rate of seed and fertilizer, the marginal revenue and marginal cost analysis was used. The total variable cost was calculated as the sum of costs incurred for NPS fertilizer, seed and labor. On the other hand, market price of grain during harvesting time was taken as value for determination of revenue.
Results
Results
Soil physicochemical properties
Results of the laboratory analysis revealed that soil texture of the experimental site is clay loam (USDA 1987) [29] with a pH value of 7.9 (Table 1), which is moderately alkaline (Tekalign 1991) [28] . In line with this, it has been reported that mung bean grows on a wide range of soils with pH ranging from 5-8, and it is somewhat tolerant to saline soils (Mogotsi 2006) [23] . [28] Total N (%) 0.2 Low Landon (1991) [20] Available P (mg/ kg -1 ) 25 Medium Olsen and Dean (1965) Available S (mg/ kg -l ) 24.6 Medium EthioSIS (2014) [10] CEC (cmol kg -1 ) 77.5 High Tekalign et al. (1991) [28] Exchangeable K (cmol kg -1 ) 6.8 Medium FAO (2006) [35] Exchangeable Mg(cmol kg -1 ) 10.7 Medium FAO (2006) [35] Exchangeable Ca (cmol kg -1 ) 6.7 Medium FAO (2006) [35] Exchangeable Na (cmol kg -1 )
| Soil characters | Values | Rating | Reference |
|---|---|---|---|
| Soil Texture | |||
| Clay (%) | 65 | ||
| Silt (%) | 27 | ||
| Sand (%) | 14 | ||
| Textural class | Clay loam | Medium texture | USDA (1987) [29] |
| Soil pH | 7.91 | Moderately alkaline | Tekalign et al. (1991) [28] |
| Electro-conductivity (ds/m) | 1.94 | Medium | Tekalign et al. (1991) [28] |
| Organic carbon (%) | 1.78 | Medium | Herrera (2005) |
| Organic matter (%) | 3.07 | Medium | Tekalign et al. (1991) [28] |
| Total N (%) | 0.2 | Low | Landon (1991) [20] |
| Available P (mg/ kg-1) | 25 | Medium | Olsen and Dean (1965) |
| Available S (mg/ kg-l) | 24.6 | Medium | EthioSIS (2014) [10] |
| CEC (cmol kg-1) | 77.5 | High | Tekalign et al. (1991) [28] |
| Exchangeable K (cmol kg-1) | 6.8 | Medium | FAO (2006) [35] |
| Exchangeable Mg(cmol kg-1) | 10.7 | Medium | FAO (2006) [35] |
| Exchangeable Ca (cmol kg-1) | 6.7 | Medium | FAO (2006) [35] |
| Exchangeable Na (cmol kg-1) | 3.02 | Medium | FAO (2006) [35] |
Table text extracted from the original PDF; superscript letters are shown inline. The original table image is below.
View original table image
3.02 Medium FAO (2006) [35] Total soil nitrogen was 0.2%, which is the low range as rated by London (1990) [20] . Therefore, the soil's total nitrogen level was insufficient for optimum crop growth and yield. The available phosphorous (P) of the soil was 25 ppm.
According to the rating of Olsen and Dean (1965) [25] , the level of available P was in the medium range. The available sulphur content of the soil was 24 mg kg -1 , and according to the rating of EthioSIS (2014) [10] , it was in the medium range. The organic matter content of the soil was 3.07%, which is also in the medium range (Tekalign 1991) [28] . Cation exchanging capacity of the soil was 77.5 cmol kg -1 , which is rated as high (Tekalign 1991) [28] . Electrical conductivity of the soil was 1.94 ds/m and rated as medium (Tekalign 1991) [28] .
Effect of intra row spacing and NPS fertilizer rate on phonological parameters of mung bean
The result of the analysis of variance revealed that the effects of intra-row spacing and NPS fertilizer rate were highly significant (p< 0.01) for a number of days to 50% flowering, but their interaction was not significant (p> 0.05).
The earliest flowering (41.12 days) was observed for intra row spacing of 5 cm, while intra row spacing of 20 cm resulted in delayed flowering (43.9 days) (Table 2). On the other hand, the shortest duration (39.88 days) to reach 50% flowering was recorded for the unfertilized control plot, while the prolonged period (44.6 days) to 50% flowering was recorded for the application of 200 kg ha -1 of NPS (Table 2). Results also revealed that both intra row spacing and NPS fertilizer rate had highly significant (p< 0.01), and their interaction had a significant (p< 0.05) effect on the number of days to 90% physiological maturity. The shortest duration (62.46 days) to reach 90% physiological maturity was recorded for intra-row spacing of 5 cm with 0 kg of NPS ha - 1 , whereas a prolonged period (72.86 days) to 90% physiological maturity was recorded for intra-row spacing of 20 cm with 200 kg NPS ha -1 (Table 3).
| NPS rates (kg/ha) | Intra rows pacing (plant ha-1) | 90% DM | LAI | PH | NPPP | AGBM | GY | HI |
|---|---|---|---|---|---|---|---|---|
| 0 | 5 (500, 000) | 62.46j | 1.10def | 62.18ef | 23.26f | 4030.1hi | 685.4i | 17.01l |
| 10 (250, 000) | 65.26i | 0.90ghijk | 62.10ef | 30.33e | 4343.1ghi | 1401.7f | 32.2fg | |
| 15 (166, 667) | 68.1h | 0.70lm | 46.80ij | 36.33d | 4342.4ghi | 1120.4h | 26.66ij | |
| 20 (125, 000) | 68.3gh | 0.57m | 43.96j | 37.76cd | 3130.3j | 569.9i | 18.16l | |
| 50 | 5 (500, 000) | 65.50i | 1.79c | 65.93cde | 28.60e | 4879.3de | 1267.3fg | 25.9j |
| 10 (250, 000) | 68.73fgh | 0.96efghi | 65.567cde | 36.60d | 5040.9cde | 1819.2c | 36.05cde | |
| 15 (166, 667) | 69.53efgh | 0.86hijkl | 53.90gh | 39.40bcd | 4386.6fgh | 1550.2e | 35.30cdef | |
| 20 (125, 000) | 70.53bcde | 0.74kl | 49.33hi | 42.53abc | 3937.3i | 1186.3gh | 30.06gh | |
| 100 | 5 (500, 000) | 68.20gh | 1.93bc | 69.267abc | 31.60e | 5808.4ab | 1729.1cd | 29.73ghi |
| 10 (250, 000) | 69.33efgh | 1.05efg | 65.56cde | 42.01abc | 5307.8bcd | 2245.5a | 42.28a | |
| 15 (166, 667) | 70.2cdef | 0.93fghij | 63.40def | 45.13a | 4880.0de | 2006.4bc | 41.10ab | |
| 20 (125, 000) | 71.66abc | 0.78jkl | 54.40gh | 43.80ab | 4653.7efg | 1570.2e | 33.72def | |
| 150 | 5 (500, 000) | 69.13efgh | 2.02b | 71.33abc | 36.40d | 5864.3ab | 1574.6e | 26.8hij |
| 10 (250, 000) | 70.13cdef | 1.11de | 67.56bcd | 41.20abcd | 5363.7bc | 2180.5ab | 40.6ab | |
| 15 (166, 667) | 71.53abcd | 0.96efghi | 65.43cdef | 42.0abc | 4903.8de | 1832.0c | 36.90cd | |
| 20 (125, 000) | 72.26ab | 0.80ijkl | 57.86fg | 44.10ab | 4660.1efg | 1540.3e | 33.0efg | |
| 200 | 5 (500, 000) | 69.86deefg | 2.24a | 71.77a | 36.13d | 5937.1a | 1337.8f | 22.5k |
| 10 (250, 000) | 72.0ab | 1.25d | 68.60bcd | 40.60bcd | 5570.3abc | 2101.8b | 37.70bc | |
| 15 (166, 667) | 71.8abc | 1.00efgh | 65.40cdef | 41.21abcd | 4936.6cde | 1625.2de | 32.19fg | |
| 20 (125, 000) | 72.86a | 0.82ijkl | 61.56ef | 43.13abc | 4804.9ef | 1272.5fg | 26.45ij |
Table text extracted from the original PDF; superscript letters are shown inline. The original table image is below.
View original table image
| Intra row spacing (plant ha-1) | DF | LA | PB | TN | EN | NSP | HSW |
|---|---|---|---|---|---|---|---|
| 5 | 41.12d | 364.03c | 2.20d | 33.58a | 16.82a | 10.02c | 6.19d |
| 10 | 42.48c | 398.46c | 4.18c | 34.28a | 17.40a | 11.53b | 6.60c |
| 15 | 43.14b | 536.10b | 5.14b | 35.09a | 17.44a | 11.92b | 7.01b |
| 20 | 43.90a | 596.09a | 5.60a | 35.21a | 18.20a | 12.64a | 7.50a |
| LSD (5%) | 0.38 | 43.72 | 0.32 | NS | NS | 0.39 | 0.29 |
| NPS (kg/ha) | |||||||
| 0 | 39.88e | 364.57d | 2.60e | 13.88e | 5.89e | 10.15d | 5.73e |
| 50 | 41.08d | 464.87c | 3.80d | 24.00d | 13.80d | 11.11c | 6.31d |
| 100 | 43.58c | 469.24bc | 4.70c | 41.35c | 21.11c | 12.63a | 7.59a |
| 150 | 44.16b | 517.38ab | 5.13b | 44.69b | 22.99b | 11.91b | 7.15b |
| 200 | 44.60a | 552.27a | 5.58a | 48.28a | 24.54a | 11.63bc | 6.80c |
| Mean | 42.66 | 473.67 | 4.32 | 34.04 | 17.47 | 11.53 | 6.72 |
| LSD (5%) | 0.43 | 48.88 | 0.36 | 2.78 | 1.54 | 0.44 | 0.29 |
| CV (%) | 1.23 | 12.49 | 10.11 | 9.9 | 10.73 | 4.68 | 5.3 |
Table text extracted from the original PDF; superscript letters are shown inline. The original table image is below.
View original table image
Effect of intra row spacing and NPS fertilizer rate on growth parameters of mung bean
The result of analysis of variance revealed that the effects of intra-row spacing and NPS fertilizer rate were highly significant (p< 0.01) effect on leaf area, but their interaction effects were non-significant (p<0.01) effect. The lowest leaf area (364.57 cm 2 ) was recorded at intra row spacing of 5 cm while highest leaf area (552.27 cm 2 ) was recorded at intra row spacing of 20 cm (Table 2). The lower leaf area (364.57 cm 2 ) was recorded for 0 kg NPS ha -1 , while the highest leaf area (552.27 cm 2 ) was recorded for 200 kg NPS ha -1 . In addition, leaf area index was highly significantly (p< 0.01) influenced by intra row spacing and NPS fertilize rates and by their interaction (p< 0.05). The highest leaf area index (2.24) was recorded at 5 cm intra row spaced with 200 kg NPS ha -1 , while the lowest value (0.57) was recorded for intra row spacing of 20 cm with 0 kg NPS ha -1 (Table 3). The result indicated that both intra row spacing and NPS fertilizer rate and their interaction had highly significant (p< 0.01) and significant (p< 0.05) effects, respectively, on plant height (Table 3). The tallest height (71.77 cm) was recorded for intra-row spacing of 5 cm with 200 kg ha -1 of NPS, while the minimum value (43.96 cm) was recorded for intrarow spacing of 20 cm without NPS application. The result indicated that intra-row spacing and NPS fertilizer rate had a highly significant (p< 0.01) effect on the number of primary branches per plant, but their interaction was not significant (p>0.05). The highest number of primary branches per plant (5.6) was recorded for the wider intra row spacing (20 cm), while the lowest (2.2) was recorded for the closest spacing (5 cm). On the other hand, the highest number of primary branches (5.58) was recorded for the application of 200 kg ha -1 of NPS, while the lowest value (2.6) was for the unfertilized control plot (Table 2).
Effect of intra row spacing and NPS fertilizer rate on nodule parameters of mung bean
The analysis of variance showed that the effect of intra row spacing and its interaction with NPS rate was nonsignificant (p> 0.05), but NPS fertilizer rates had significant (p<0.05) effect on total number of nodules per plant. The highest number of nodules (48.28) was produced at 200 kgha -1 of NPS, while the lowest value (13.88) was recorded for the unfertilized control plot (Table 2). Also, the effect of intra row spacing and its interaction with NPS rate was nonsignificant, but the application of NPS fertilizer had a significant (p<0.05) effect on the number of effective nodules per plant. The highest number of effective nodules (24.54) was recorded for the application of 200 kg ha -1 of NPS, while the lowest value (5.89) was for the unfertilized control treatment (Table 2).
Effect of intra row spacing and NPS fertilizer rate on yield and yield components of mung bean
The analysis of variance revealed that both intra row spacing and NPS fertilize rate had highly significant (p<0.01) effect on number of pods per plant of mung bean, which also significantly (p<0.05) affected by the interaction of the two factors. The highest number of pods per plant (45.13) was recorded at intra row spacing of 15 cm with 100 kg NPS ha -1 , while intra row spacing of 5 cm with the application of 0 kgha -1 of NPS resulted in the lowest value (23.26) (Table 3). The number of seeds per pod was also highly significantly (p< 0.01) affected by intra row spacing and NPS fertilize rate, but their interaction was nonsignificant (p> 0.05). The highest number of seeds per pod (12.64) was produced at the widest intra row spacing (20 cm), while the value (10.02) was for 5 cm. (Table 2). Similarly, application of 100 kgha -1 of NPS resulted in the highest number of seeds per pod (12.63), while the lowest value (10.15) was recorded for the unfertilized plot (Table 2). The results also showed that the effect of intra row spacing and NPS rate was highly significant (p< 0.01), but their interaction was non-significant (p>0.05) for hundred seed weight of mung bean (Table 2). The highest hundred seed weight (7. 5 g) was recorded for intra row spacing of 20 cm, while the lowest value (6.19 g) was for intra row spacing of 5 cm. Application of 100 kg ha -1 of NPS resulted in the highest hundred seed weight (7.59 g), while the lowest value (5.73 g) was recorded for the plot maintained without NPS fertilizer (Table 2). The analysis of variance revealed that the effect of intra row spacing and NPS fertilizer rate was highly significant (p< 0.01) effect on above ground dry biomass while their interaction was significant (p< 0.05) for above ground dry biomass yield of mung bean. The highest dry biomass yield (5957.1 kgha -1 ) was produced at intra row spacing of 5 cm with 200 kg ha -1 of NPS, while the lowest (3130.3 kgha -1 ) was recorded for intra row spacing of 20 cm without NPS application (Table 3). Also, the effect of intra row spacing and NPS fertilizer rate was highly significant (p< 0.01) for grain yield per hectare. Their interaction was also significant (p< 0.05) for the same parameter. The highest grain yield (2245.5 kg ha -1 ) was recorded for intra row spacing of 10 cm with the application of 100 kg of NPS ha -1 , while the lowest (569.9 kg ha -1 ) was obtained from intra row spacing of 20 cm with no application of NPS fertilizer (Table 3). Harvest index was significantly affected by intra row spacing and NPS fertilize rate (p< 0.001) as well as by their interaction (p< 0.05). The highest harvest index (42.28%) was recorded for intra row spacing of 10 cm with the application of 100 kgha -1 of NPS fertilizer, which was statically similar with the value obtained at 15 cm with the same fertilizer rate, while the lowest harvest index (17.01%) was recorded for intra row spacing of 5 cm maintained without fertilizer (Table 3).
Pearson correlation analysis among traits
Number of branches per plant showed a positive and highly significant correlation with number of days to 50% flowering (r=0.93*), number of pods per plant (r=0.91**), and number of seeds per pod (r=0.74**), hundred seed weight (r=0.83**), aboveground dry biomass yield (r=30*) and grain yield (r = 48*), but negatively correlated with number of days to 90% physiological maturity (r=-0.94*). A positive and highly significant correlation existed between plant height (r = 91**) and the number of pods per plant. Similarly, a positive and highly significant correlation was observed for plant height and number of days to flowering (r = 0.57**), leaf area index (r = 0.95**), total number of nodules (r=0.82**), number of effective nodules (r=0.93**), number of primary branches per plant (r=0.37*), hundred seed weight (r =0.61**), above ground dry biomass yield (r = 94**) and grain yield (r =0.72**), but negative correlation to days to maturity (r= -0.55**). Grain yield showed a positive and highly significant correlation with number of days to flowering (r = 0.64**), number of days to maturity (r = 0.62**), leaf area index (r = 0.72**), plant height (r = 72**), number of pods per plant (r=67**), number of seeds per pod (r=60**), hundred seed weight (r= 0.80**), above ground dry biomass yield (r=76**) and harvest index (r = 0.96**). is significant at 0.05 (p< 0.05) and 0.01 (p< 0.01) probability levels respectively. DF= number of days to 50% Flowering; PM= number of days to 90% physiological maturity; PB= total number of primary branches per plant; PH=plant height; TN= Total number of nodules; EN=Number of effective nodulation; NPP =Number of pods per plant; NSP =number of seeds per pod; BM = aboveground dry biomass yield; GY = Grain Yield; HSW= hundred seed weight and HI= harvest index.
Economic Analysis
A cost-benefit analysis was undertaken for different fertilizer treatments to determine the highest net benefit with an acceptable, marginal rate of return (Table 5). Accordingly, unit cost of fertilizer unit cost of seed were taken as variable costs, fertilizer cost, unit labor cost of planting and unit quantities of price of mung bean at local condition was taken as value of crop all were as variable costs. Before calculating value-cost and benefit -cost ratio, grain yield was adjusted to 10% reduction to reduce extrapolation error. Gross benefit of the treatments was calculated using the adjusted yield and the field gate price of the crop. In contrast, net benefit was calculated by subtracting variable costs from the gross benefit of each treatment. Accordingly, the highest net benefit (56585.8 Birr ha -1 ) was obtained from the treatment combination of 100 kg of NPS ha -1 and intra row spacing of 10 cm, while the lowest net benefit (15267 Birr ha -1 ) was obtained from the treatment combination of 200 kg of NPS ha -1 and intra row spacing of 20 cm. The highest marginal rate of return (MRR) (2928.4%) was obtained from the treatment combination of 100 kg NPS ha -1 and intra row spacing of 10 cm (Table 14). Therefore, the best alternative return, the above-mentioned fertilizer rate is recommended as best economically treatment was (intra row spacing 10 cm) with (100 kg ha -1 ) for the study area (Table 4).
| Treatments combinations (cm, kg ha-1) | Unadjy | Adjy (0.10) | TRN (Birr ha-1) | CS (BirKg-1) | CF (Birkg-1) | LCFA (Birrha-1) | LCP (Birr ha-1) | TVC | NEB (Birrha-1) | MRR% |
|---|---|---|---|---|---|---|---|---|---|---|
| 20 cm, 0 kgha-1 NPS | 569.9 | 512.9 | 15387 | 120 | 0 | 0 | 720 | 840 | 15267 | - |
| 15 cm, 0 kgha-1 NPS | 1120.3 | 1008.36 | 30250.8 | 180 | 0 | 0 | 1200 | 1380 | 28870.8 | 2519.2 |
| 10 cm, 0 kgha-1 NPS | 1401.7 | 1261.53 | 37845.9 | 240 | 0 | 0 | 1800 | 2040 | 35805.9 | 1050.7 |
| 20 cm, 50 kgha-1 NPS | 1186.1 | 1067.49 | 32024.7 | 120 | 700 | 600 | 720 | 2140 | 31104.7 | D |
| 15 cm, 50 kgha-1 NPS | 1550.2 | 1395.18 | 41855.4 | 180 | 700 | 600 | 1200 | 2680 | 39175.4 | 1494.5 |
| 20 cm, 100 kgha-1 NPS | 1570.1 | 1413.18 | 42395.4 | 120 | 1400 | 600 | 720 | 2840 | 40775.4 | 1000 |
| 5 cm, 0 kgha-1 NPS | 685.3 | 616.68 | 18500.4 | 480 | 0 | 0 | 2400 | 2880 | 15620.4 | D |
| 10 cm, 50 kgha-1 NPS | 1819.2 | 1637.55 | 49126.5 | 240 | 700 | 600 | 1800 | 3340 | 45786.5 | 1002.2 |
| 15 cm, 100 kgha-1 NPS | 2086.3 | 1877.76 | 56332.8 | 180 | 1400 | 600 | 1200 | 3380 | 54652.8 | 2216.7 |
| 20 cm, 150 kgha-1 NPS | 1540.3 | 1386.27 | 41588.1 | 120 | 2100 | 600 | 720 | 3540 | 39268.1 | D |
| 10 cm, 100 kgha-1 NPS | 2245.4 | 2020.86 | 60625.8 | 240 | 1400 | 600 | 1800 | 4040 | 56585.8 | 2928.4 |
| 15 cm, 150 kgha-1 NPS | 1832 | 1648.8 | 49464 | 180 | 2100 | 600 | 1200 | 4080 | 47084 | D |
| 5 cm, 50 kgha-1 NPS | 1267.2 | 1140.57 | 34217.1 | 480 | 700 | 600 | 2400 | 4180 | 30037.1 | D |
| 20 cm, 200 kgha-1 NPS | 1272.5 | 1145.25 | 34357.5 | 120 | 2800 | 600 | 720 | 4240 | 31337.5 | D |
| 10 cm, 150 kgha-1 NPS | 2184.1 | 1965.69 | 58970.7 | 240 | 2100 | 600 | 1800 | 4740 | 54230.7 | D |
| 15 cm, 200 kgha-1 NPS | 1625.2 | 1462.68 | 43880.4 | 180 | 2800 | 600 | 1200 | 4780 | 40800.4 | D |
| 5 cm, 100 kgha-1 NPS | 1729.1 | 1556.19 | 46685.7 | 480 | 1400 | 600 | 2400 | 4880 | 41805.7 | D |
| 10 cm, 200 kgha-1 NPS | 2101.7 | 1891.53 | 56994 | 240 | 2800 | 600 | 1800 | 5440 | 51554 | D |
| 5 cm, 150 kgha-1 NPS | 1574.6 | 1417.14 | 42514.2 | 480 | 2100 | 600 | 2400 | 5580 | 36934.2 | D |
| 5 cm, 200 kgha-1 NPS | 1337.8 | 1204.02 | 36120.6 | 480 | 2800 | 600 | 2400 | 6280 | 29840.6 | D |
Table text extracted from the original PDF; superscript letters are shown inline. The original table image is below.
View original table image
| — | DF | DM | LAI | PH | PB | TN | EN | NPP | NSP | HSW | BM | GY | HI |
|---|---|---|---|---|---|---|---|---|---|---|---|---|---|
| DF | 1 | ||||||||||||
| DM | -0.94** | 1 | |||||||||||
| LAI | 0.45* | -0.42* | 1 | ||||||||||
| PH | 0.57** | -0.55** | 0.93** | 1 | |||||||||
| PB | -0.93** | 0.94** | 0.22* | 0.37* | 1 | ||||||||
| TN | -0.72** | 0.62** | 0.83** | -0.82** | -0.51** | 1 | |||||||
| EN | 0.77** | 0.7** | 0.88** | 0.93** | 0.58** | 0.91** | 1 | ||||||
| NPP | -0.89** | 0.91** | 0.24* | 0.76** | 0.91** | 0.6** | -0.54** | 1 | |||||
| NSP | 0.77** | -0.77** | 0.23* | 0.63** | 0.74** | 0.54** | 0.48* | 0.85** | 1 | ||||
| HSW | 0.93** | -0.84** | 0.56** | 0.61** | 0.83** | 0.87** | 0.8** | 0.87** | 0.74** | 1 | |||
| BM | 0.4* | 0.39* | 0.97** | 0.94** | 0.30* | 0.82** | 0.85** | 0.27* | 0.23* | 0.53* | 1 | ||
| GY | 0.64** | 0.62** | 0.72** | 0.72** | 0.48* | 0.9** | 0.76** | 0.67** | 0.6** | 0.8** | 0.76** | 1 | |
| HI | 0.65** | -0.65** | 0.54* | 0.56* | 0.56** | 0.81** | -0.62** | 0.77** | 0.66** | 0.8** | -0.57** | 0.96** | 1 |
Table text extracted from the original PDF; superscript letters are shown inline. The original table image is below.
View original table image
Discussion
In Ethiopia, several biotic and abiotic factors lead to decreased yield of mung bean (Das et al. 2014) [5] . The major reasons for its low yield are the limited experience of farmers in its production practices, as it is a recently introduced crop which is not well known in the area, less interest of farmers to produce, limited use of inputs, including inappropriate agronomic practices, inadequate or imbalanced fertilizer application and irregular planting spaces as a result of broad casting, lack of improved varieties, and diseases and pests (Hasanuzzaman et al. 2013; Fanuel and Walelign 2013) [15,11] . The present study showed that interaction effect of intra-row spacing and NPS fertilizer rate was highly significant (p< 0.01) for days to 90% physiological maturity, but their interaction was not significant (p> 0.05) for days to 50% flowering. The earliest flowering and shortest duration to reach 90% physiological maturity were observed for narrow intra row spacing with no NPS ha -1. The possible reason might be due to high competition among plants for growth resources that led to early formation of reproductive parts. This result was in line with the findings of Asaye et al. (2018) [2] , who reported early flowering with intra row spacing of 5 cm in mung bean. Other consistent findings of Gezahegn et al. (2021) [13] and Nuru (2021) [24] indicated that increased NPS rates (150 kgha -1 NPS) resulted in the longest duration to maturity. The lowest leaf area but increase in LAI with narrow intra-row spacing at narrow intra-row spacing plus the highest NPS rate might be due to the production of more leaves with more expanded area in response to the supply of more nitrogen from increased NPS rate. This result was in agreement with the findings of Masa (2017) [21] , who reported that LAI increased as intra row spacing decreased (5 cm) and vice versa (15 cm) in mung bean and common bean, respectively. The height of plant showed tallest at narrow intra row spacing, whereas highest number of primary branches per plant was recorded for the wider intra row spacing. On the other hand, the highest number of primary branches was recorded for application of higher N amount of NPS, while the lowest value was for the unfertilized control plot. The increase in a number of primary branches at higher NPS rates might be due to an adequate supply of nitrogen, which is responsible for vegetative growth. Both number of nodules and number of effective nodules were highest at highest amount of NPS, while the lowest value was recorded for the unfertilized control plot. The increase in a number of effective nodules with an increasing rate of NPS application might be associated with increased supply and plant uptake of phosphorus and sulfur that stimulates active nodule formation and enhances the yield of mung bean. Similarly, Adugna et al. (2020) [1] and Deresa (2018) [6] have reported that the highest total number of nodules per plant of mung bean and common bean, respectively, was recorded for application of the highest rate of NPS (200 kgha -1 ), while the lowest value was recorded for the control plot. Also, the increase in a number of seeds per pod at the widest intrarow spacing might be because of less competition for resources and, probably, an increased rate of dry matter partitioning to reproductive parts. In agreement with the current result, Gebrelibanose and Fisha (2018) [12] have reported that wider intra row spacing (20 cm) of mung bean resulted in the highest numbers of seeds. The grain yield of 2245.5 kg ha -1 was recorded for intra row spacing of 10 cm with application of 100 kg of NPS ha -1 , while the lowest grain yield (569.9 kg ha -1 ) was obtained from intra row spacing of 20 cm with no application of NPS fertilizer. The highest harvest index (42.28%) was recorded for intra row spacing of 10 cm with the application of 100 kgha -1 of NPS fertilizer, which was statically similar with the value obtained at 15 cm with the same fertilizer rate, while the lowest harvest index (17.01%) was recorded for intra row spacing of 5 cm maintained without fertilizer.
Conclusion
Our study revealed that the effect of intra row spacing and NPS fertilizer rate was highly significant (p≤0.01) for the number of days to 50% flowering, number of primary branches, total number of nodules, number of effective nodules, number of seeds per pod and hundred seed weight. Moreover, the interaction of intra row spacing and NPS rate significantly affected the number of days to 90% physiological maturity, leaf area index, plant height, number of pods per plant, above ground dry biomass yield, grain yield and harvest index. Besides, all yield-related parameters also showed significant and positive correlations with grain yield. Results of partial budget analysis showed that the highest net benefit (56585.8 Birr ha -1 ) with an acceptable marginal rate of return (2928.4%) was obtained from the combination of 10 cm intra row spacing and application of 100 kg of NPS ha -1 . In general, the study recommends that intra row spacing of 10 cm with application of 100 kg ha -1 of NPS fertilizer would offer the highest grain yield, MRR and net benefit to growers of mung bean in the study district and other similar agroecology.
Acknowledgement
AcknowledgementWe are grateful to ARBA Minch University for providing financial support for the accomplishment of this research work. Our Special thanks go also to ARBA Minch district administrators, development agents and the community for their imaginative opinions and cooperation during the field work.
References
21 in the original paper- Adugna SH, Andargachew G, Ashenafi Haile G. Growth, nodulation and yield response of green bean (Phaseolus vulgaris L.) to plant population and blended NPS fertilizer rates at Alage, Central Rift Valley of Ethiopia. Alage Agricultural Technical and Vocational Education Training (ATVET) College. 2020;16(11):1503-1513.
- Asaye B, Tilahun T, Daniel T. Effect of inter-and intrarow spacing on yield and yield components of mung bean (Vigna radiata L.) under rain-fed condition at Metema District, northwestern Ethiopia. Agriculture & Food Security. 2018;7:84.
- Das S, Shekhar UD, Ghosh P. Assessment of molecular genetic diversity in some green gram cultivars as revealed by ISSR analysis. Advances in Applied Science Research. 2014;5(2):93-97.
- Deresa SH. Response of common bean (Phaseolus vulgaris L.) varieties to rates of blended NPS fertilizer in Adola district, Southern Ethiopia. African Journal of Plant Science. 2018;12(8):164-179.
- Fanuel L, Walelign W. Growth, light interception, radiation use efficiency and productivity of mung bean (Vigna radiata Wilczek [Fabaceae]) cultivars as influenced by sowing date. Ethiopian Journal of Biological Sciences. 2013;12(2):117-133.
- Gebrelibanose G, Fiseha B. Effect of Inter Row and Intra Row Spacing on Yield and Yield Components of Mung Bean (Vigna radiate L.) in Northern Ethiopia. Academic Journal. 2018;6(1):348-352.
- Gezahegn B, Habtamu A, Thomas A. Effect of Plant Population and NPS Fertilizer Rates on Yield and Yield Components of Mung Bean (Vigna radiata L. Wilczek) in Bako, Western Ethiopia. Asian Journal of Research in Crop Science. 2021;6(4):28-39.
- Mijena D, Getiso A. Morphological and yield performance of Brachiaria grass in response to NPS fertilizer and harvesting stage at Wondogenet, Ethiopia. Int J Res Agron. 2022;5(2):190-196.
- Kabir MH, Sarkar MA. Seed yield of mung bean as affected by variety and plant spacing in Kharif-I season. Journal of the Bangladesh Agricultural University. 2008;6(2):239-244.
- Khan A, Allahdad S. Effect of seed rate on growth, yield components and yield of mash bean grown under irrigated conditions of arid uplands of Balochistan, Pakistan. Pakistan Journal of Botany. 2011;43(2):961969.
- Khan FS, Ahmed ZI, Ansar M, Shah H. Response of mung bean genotypes to Rhizobium inoculum and varying levels of nitrogen fertilizer. Pakistan Journal of Agricultural Sciences. 2008;21(1-4):33-44.
- Khan MA, Naveed K, Ali K, Ahmad B, Jan S. Impact of mung bean-maize intercropping on growth and yield of mung bean. Journal of Research in Weed Science. 2012;18(2):191-200.
- Masa M, Tamado T, Abdulatif A. Effect of Plant Spacing on Yield and Yield Related Traits of Common Bean (Phaseolus vulgaris L.) Varieties at Areka, Southern Ethiopia. 2017;4(2):1-13.
- Mezgebu D, Jemal A, Tesema MW, Tamado T. Response of Mung Bean (Vigna radiata (L.) Wilczek) to Levels of Nitrogen and Phosphorus Fertilizer under Irrigation in Central Ethiopia. Asian Plant Research Journal. 2020;6(3):10-17.
- Nuru S. Effects of NPS Fertilizer Rates on Growth, Yield Components and Yield of Mung bean (Vigna radiata L.) Wilczek] Varieties under Irrigation at Gewane, North-eastern Ethiopia. International Journal of Research in Agricultural Sciences. 2021;8(4):217233.
- Olsen SR, Cole CV, Watanabe FR, Dean LA. Estimation of Available Phosphorous in Soils by Extraction with Sodium Bicarbonate. Washington, D.C: United States Department of Agriculture Circular. 1954;939:1-19.
- Singh SP, Sandhu SK, Dhaliwal LK, Inderjeet S. Effect of Planting Geometry on Microclimate, Growth and Yield of Mung bean (Vigna radiata L.). Journal of Agricultural Physics. 2012;12(1):70-73.
- Walkey A, Black CA. An examination of the Degtjareff method for determining soil organic matter and proposed modification of the chromic acid titration method. Soil Sciences. 1934;37:29-34.
- Yagoob H, Yagoob M. The effects of water deficit stress on protein yield of mung bean genotypes. Peak Journal of Agricultural Science. 2014;2(3):30-35.
- Achakzai AK, Liasu MO, Popoola OJ. Effect of mycorrhizal inoculation on the growth and phytoextraction of heavy metals by maize grown in oil contaminated soil. Pak. J Bot. 2012 Feb 1;44(1):221230.
- Sisay G, Gitima G, Mersha M, Alemu WG. Assessment of land use land cover dynamics and its drivers in Bechet Watershed Upper Blue Nile Basin, Ethiopia. Remote Sensing Applications: Society and Environment. 2021 Nov 1;24:100648.
Cited by 1
From OpenAlex, OpenCitations and reference lists read by Scinovex
- Growth and yield response of mungbean [ Vigna radiata L. (Wilczek)] to blended NPSB fertilizer rates ↗
Shiferaw Mebrat, Yenus Ousman, Alemu Degwale, Fekadu Habtie, Lukas Pawera · Agronomy Journal · 2026
Abstract In Ethiopia, mungbean [ Vigna radiata L. (Wilczek)] is an emerging crop with low productivity. Although blended fertilizer containing nitrogen phosphorus sulfur boron (NPSB) fertilizer is effective for many crops, evidence on its effect on mungbean in West Belesa, Northern Ethiopia, is limited. Consequently, a field experiment was conducted during the 2021 and 2022 cropping seasons to evaluate the…
❝ 0