
Research article · 2024 · Full text
International Journal of Agriculture Extension and Social DevelopmentSeasonality and volatility in arrivals and prices of turmeric in major markets of Marathwada region
Volume 7(2) · Pages 183–185 · DOI: 10.33545/26180723.2024.v7.i2c.324 ↗
Research areasAgricultural Economics and Practices
Abstract
Author-writtenThe present investigation aims to examine the seasonality and volatility in arrivals and prices of turmeric among selected markets in Marathwada. For the present investigation, the time series data on monthly arrivals and prices of turmeric required for the study were collected from MSAMB, Pune for respective markets viz., Basamat, Hingoli and Nanded. These three major APMCs, from Marathwada region were selected for the period of last 10 years i.e. 2012-2021 to analyse the trends. The result of present investigation shows that the clear pattern of maximum and minimum arrivals and prices. The seasonal indices of turmeric arrivals in selected markets reached their peak during the month of March to June, and in the other months, no distinct trends were seen. While the price indices are moving around the average prices of turmeric. The estimates of intra-year variation revealed that variability in arrivals were greater than variations in prices of turmeric in Marathwada region. In contrast, the inter-year fluctuations in arrivals were greater than the variability in prices of turmeric in selected markets of Marathwada.
Summary
Source-checkedPlain-language reading of the full paper, prepared with AI and checked against the text. Each point links to the authors' own words.
Why it matters
- Turmeric is an important spice crop originating from India and used across various industries as a condiment, coloring agent, and flavoring agent. View evidence ↗
- India is the dominant global producer of turmeric, contributing 80% of the total global production. View evidence ↗
- In Maharashtra, turmeric cultivation saw significant growth between 2018-19 and 2022-23, with the area increasing from 17.224 thousand ha to 83 thousand ha. View evidence ↗
The question
- The study aimed to analyze the seasonal patterns and price volatility of turmeric arrivals in selected markets within the Marathwada region. View evidence ↗
What they did
- The research focused on three major turmeric markets in the Marathwada region: Basamat, Hingoli, and Nanded. View evidence ↗
- Seasonal variations were estimated using the twelve-month ratio to moving average method to calculate seasonal indices. View evidence ↗
- Intra-year and inter-year variations in arrivals and prices were measured using the Coefficient of Variation (C.V.) formula. View evidence ↗
What they found
- Peak arrival indices occurred in May, reaching 190.39% in the Basamat market and 169.20% in the Hingoli market. View evidence ↗
- The highest price index for turmeric in the Nanded market was recorded in April at 203.20%. View evidence ↗
- The lowest arrival indices were 37.69% in Basamat (February), 34.34% in Hingoli (March), and 22.25% in Nanded (February). View evidence ↗
- Intra-year variation in arrivals (65.81% in Basamat, 57.78% in Hingoli, 74.44% in Nanded) was significantly higher than the variation in prices (20.47% in Basamat, 23.46% in Hingoli, 22.21% in Nanded). View evidence ↗
- In the Basamat market, inter-year arrival variation ranged from a minimum of 47.88% in 2015 to a maximum of 82.05% in 2012. View evidence ↗
What it means
- The authors concluded that there is generally an inverse relationship between the arrivals of turmeric and its prices. View evidence ↗
- The study concluded that both intra-year and inter-year variability in turmeric arrivals were greater than the variability in prices across the studied markets. View evidence ↗
Visual summary
3 visualsIllustrations explain the paper; charts are replotted from the paper's own table values.

Arrivals vs Price Relationship
AI-generated conceptual illustration (turmeric rhizomes in a marketplace setting). It explains the idea and does not show study data.
View source evidence ↗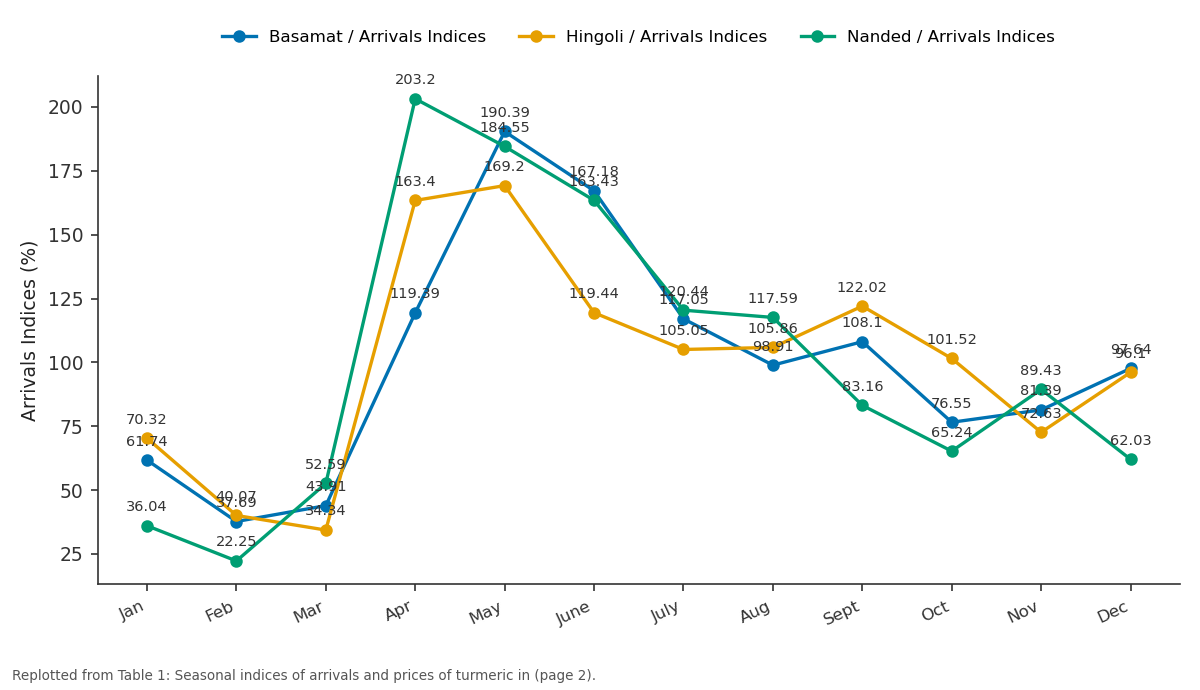
Basamat / Arrivals Indices and Hingoli / Arrivals Indices and more: Jan vs Feb vs Mar vs Apr vs May
Replotted from Table 1 (page 2) of the original paper. Every bar is the paper's own table value.
View source evidence ↗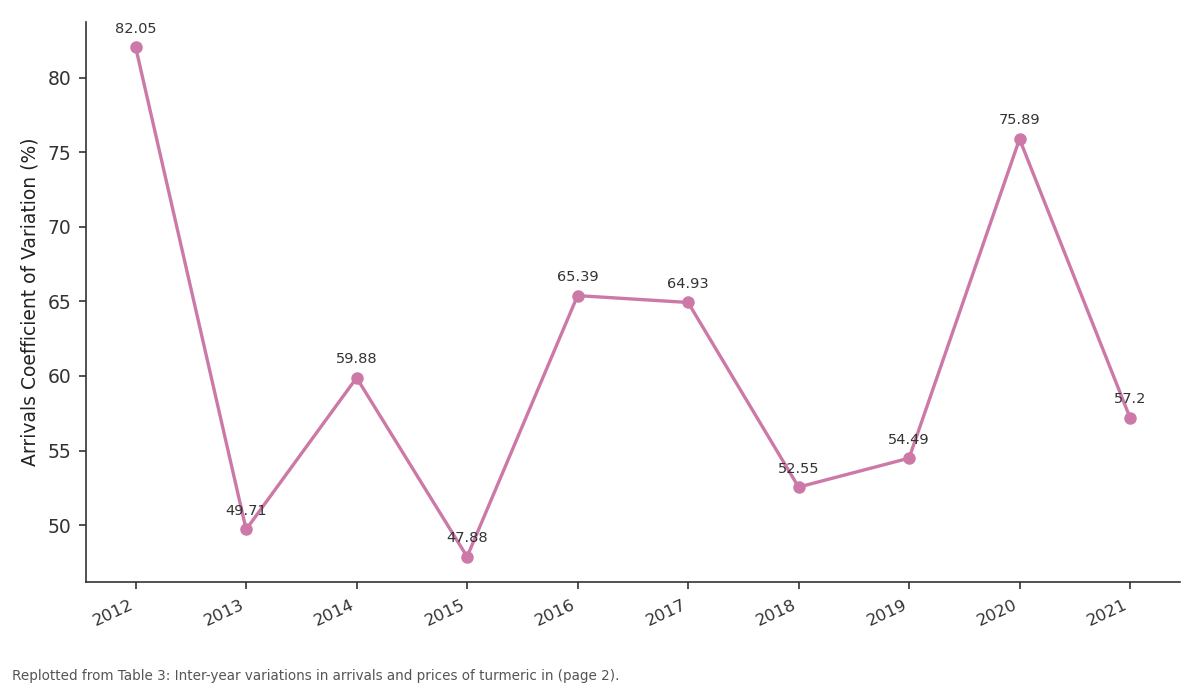
Basamat / Arrivals: 2012 vs 2013 vs 2014 vs 2015 vs 2016
Replotted from Table 3 (page 2) of the original paper. Every bar is the paper's own table value.
View source evidence ↗Figures & tables
From the original paper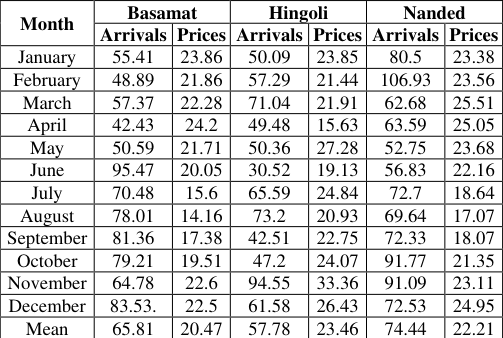 Table 2
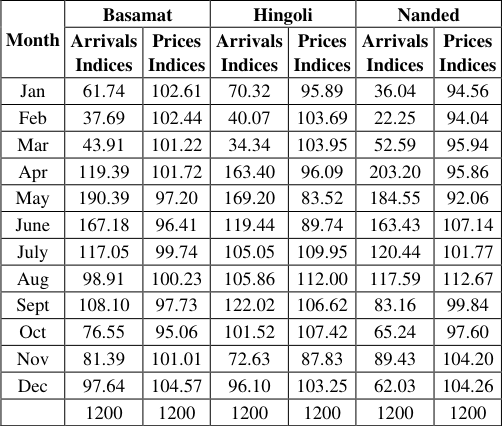 Table 1
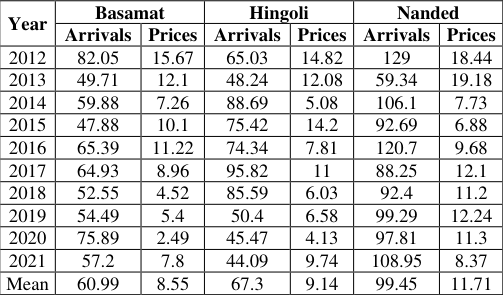 Table 3
Introduction
Turmeric (Curcuma longa) is a significant spice crop belonging to the family zingiberaceae, and it is rhizomatous herbaceous plant which is originated from India. It is used in diversified industries as a flavouring agent, a condiment, a coloured agent, and curry powder. India is referred to as the "Spices Bowl of the World" because many varieties of spices have been grown in the country since ancient times. Turmeric is produced, consumed, and exported mostly in India. Central and Latin America, Thailand, various Southeast Asian nations, and Taiwan are even significant producers. The annual global production of turmeric is about 11 lakh tonnes. India leads the global production scenario with a contribution of 80 percent, followed by China with 8 percent, Myanmar with 4 percent, and Bangladesh and Nigeria together with 6 percent of the total production. The area, production and productivity of turmeric was fluctuating during the year 2018-19 to the year 2022-23 in Maharashtra. There is an increase in area from 17.224 thousand ha in 2018-19 to 83 thousand ha in 2022-23. Similarly, the production has increased from 38.310 thousand tons in 2018-19 to 278 thousand tons in 2022-23. The productivity has increased from 2224 kg/ha in 2018-19 to 3349 kg/ha in 2022-23. In the year 2019-20, highest productivity i.e. 5152 kg/ha was noted. The area and production of turmeric has increasing trend from the year 2018-19 to 2022-23.
Materials and Methods
In the state of Maharashtra, this study was conducted. The current study focused on Marathwada region of Maharashtra. For the present study the major markets of turmeric namely Basamat, Hingoli and Nanded were selected from Marathwada region. The time series data on monthly average arrivals and prices of turmeric for the period from 2012 to 2021 were collected from MSAMB, Pune for respective markets and used for present study.
I. Seasonal indices of arrivals and prices of maize
To estimate the seasonal variations in arrivals and prices, seasonal indices were calculated by using twelve months ratio to moving average method.
II. Variation in arrivals and prices
To estimate both intra-year and inter-year in arrivals and prices following formula was used.
Result and Discussion 1) Seasonal Indices of arrivals and prices of turmeric in Marathwada
The seasonal indices of monthly arrivals and prices of turmeric for the period of last 10 years (2012 to 2021) in Basamat, Hingoli and Nanded markets of Marathwada region were calculated and the results are presented in Table 1. www.extensionjournal.com It could be noticed from the table that, the maximum indices of arrivals of turmeric were 190.39 and 169.20 percent, in Basamat and Hingoli markets, respectively and it was observed in the month of May. The highest price indices of turmeric in Nanded market were in the month of April, at 203.20 percent. On the contrary, the lowest arrivals indices were recorded in the months of February, i.e. 37.69 percent (Basamat), 34.34 percent in the month of March (Hingoli) and 22.25 percent in the month of February (Nanded), respectively. The maximum prices index of turmeric in Basamat market was attained in the month of December i.e. 104.57 percent. While in Hingoli market it was attained in the month of August i.e. 112 percent and in Nanded market it was attained in the month of August i.e. 112.67 percent, respectively. The lowest price indices were observed in the month of October for Basamat market i.e. 95.06 percent, while it was 83.52 percent and 92.06 percent in May for Hingoli and Nanded market. The seasonal indices of arrivals were maintained above 100 during the month of April to July in Basamat market and April to October in Hingoli market. In Nanded market the period could be defined during April to August. A distinct pattern of price indices above 100 was noticed for all the markets in Marathwada region starting from April to August.
| Month | Basamat | — | Hingoli | — | Nanded | — |
|---|---|---|---|---|---|---|
| Arrivals Indices | Prices Indices | Arrivals Indices | Prices Indices | Arrivals Indices | Prices Indices | |
| Jan | 61.74 | 102.61 | 70.32 | 95.89 | 36.04 | 94.56 |
| Feb | 37.69 | 102.44 | 40.07 | 103.69 | 22.25 | 94.04 |
| Mar | 43.91 | 101.22 | 34.34 | 103.95 | 52.59 | 95.94 |
| Apr | 119.39 | 101.72 | 163.40 | 96.09 | 203.20 | 95.86 |
| May | 190.39 | 97.20 | 169.20 | 83.52 | 184.55 | 92.06 |
| June | 167.18 | 96.41 | 119.44 | 89.74 | 163.43 | 107.14 |
| July | 117.05 | 99.74 | 105.05 | 109.95 | 120.44 | 101.77 |
| Aug | 98.91 | 100.23 | 105.86 | 112.00 | 117.59 | 112.67 |
| Sept | 108.10 | 97.73 | 122.02 | 106.62 | 83.16 | 99.84 |
| Oct | 76.55 | 95.06 | 101.52 | 107.42 | 65.24 | 97.60 |
| Nov | 81.39 | 101.01 | 72.63 | 87.83 | 89.43 | 104.20 |
| Dec | 97.64 | 104.57 | 96.10 | 103.25 | 62.03 | 104.26 |
| 1200 | 1200 | 1200 | 1200 | 1200 | 1200 |
Table text extracted from the original PDF; superscript letters are shown inline. The original table image is below.
View original table image
2) The intra-year variation in the arrivals and prices of turmeric in Marathwada
The intra-year variation in the arrivals and prices of turmeric in Basamat, Hingoli and Nanded markets over a period of 10 years (2012 to 2021) are given in Table 2. Table 2 revealed that, in Marathwada region, the complete range of variation in prices for turmeric in Basamat, Hingoli, and Nanded markets were 20.47, 23.46, and 22.21 percent, respectively. However, the variations in arrivals were much higher at 65.81, 57.78, and 74.44 percent, respectively. The monthwise analysis over the whole study period shows that, the estimates of arrivals were varied between 42.43 (April) to 95.47 (June) percent in Basamat market, while variation in prices were varies between 14.16 (August) to 24.2 (April) percent. In case of Hingoli market, the variation in arrivals and prices of turmeric ranged between 30.52 (June) to 94.55 (November) percent and 15.63 (April) to 33.36 (November) percent, respectively. In Nanded market, the variation in arrivals of turmeric ranged between 52.75 (May) to 106.93 (February) percent and variation in prices ranges from 17.07 (August) to 25.51 (March) percent, respectively. It is interesting to observe that there was a larger difference between the magnitudes of variation in arrivals of turmeric than variation in prices of turmeric in Marathwada region.
| Month | Basamat | — | Hingoli | — | Nanded | — |
|---|---|---|---|---|---|---|
| Arrivals | Prices | Arrivals | Prices | Arrivals | Prices | |
| January | 55.41 | 23.86 | 50.09 | 23.85 | 80.5 | 23.38 |
| February | 48.89 | 21.86 | 57.29 | 21.44 | 106.93 | 23.56 |
| March | 57.37 | 22.28 | 71.04 | 21.91 | 62.68 | 25.51 |
| April | 42.43 | 24.2 | 49.48 | 15.63 | 63.59 | 25.05 |
| May | 50.59 | 21.71 | 50.36 | 27.28 | 52.75 | 23.68 |
| June | 95.47 | 20.05 | 30.52 | 19.13 | 56.83 | 22.16 |
| July | 70.48 | 15.6 | 65.59 | 24.84 | 72.7 | 18.64 |
| August | 78.01 | 14.16 | 73.2 | 20.93 | 69.64 | 17.07 |
| September | 81.36 | 17.38 | 42.51 | 22.75 | 72.33 | 18.07 |
| October | 79.21 | 19.51 | 47.2 | 24.07 | 91.77 | 21.35 |
| November | 64.78 | 22.6 | 94.55 | 33.36 | 91.09 | 23.11 |
| December | 83.53. | 22.5 | 61.58 | 26.43 | 72.53 | 24.95 |
| Mean | 65.81 | 20.47 | 57.78 | 23.46 | 74.44 | 22.21 |
Table text extracted from the original PDF; superscript letters are shown inline. The original table image is below.
View original table image
3) The inter-year variability in the arrivals and prices of turmeric Marathwada Region
The inter-year variability in the arrivals and prices of turmeric in Basamat, Hingoli, and Nanded market during the period 2012 to 2021 are estimated in Table 3. percent and 4.13 to 14.82 percent, respectively. The arrivals of turmeric varied in the range of 59.34 to 129 percent in case of Nanded market. On the other hand, the annual variation was observed between 6.88 to 19.18 percent, respectively in the per quintal prices of Nanded market.
| Year | Basamat | — | Hingoli | — | Nanded | — |
|---|---|---|---|---|---|---|
| Arrivals | Prices | Arrivals | Prices | Arrivals | Prices | |
| 2012 | 82.05 | 15.67 | 65.03 | 14.82 | 129 | 18.44 |
| 2013 | 49.71 | 12.1 | 48.24 | 12.08 | 59.34 | 19.18 |
| 2014 | 59.88 | 7.26 | 88.69 | 5.08 | 106.1 | 7.73 |
| 2015 | 47.88 | 10.1 | 75.42 | 14.2 | 92.69 | 6.88 |
| 2016 | 65.39 | 11.22 | 74.34 | 7.81 | 120.7 | 9.68 |
| 2017 | 64.93 | 8.96 | 95.82 | 11 | 88.25 | 12.1 |
| 2018 | 52.55 | 4.52 | 85.59 | 6.03 | 92.4 | 11.2 |
| 2019 | 54.49 | 5.4 | 50.4 | 6.58 | 99.29 | 12.24 |
| 2020 | 75.89 | 2.49 | 45.47 | 4.13 | 97.81 | 11.3 |
| 2021 | 57.2 | 7.8 | 44.09 | 9.74 | 108.95 | 8.37 |
| Mean | 60.99 | 8.55 | 67.3 | 9.14 | 99.45 | 11.71 |
Table text extracted from the original PDF; superscript letters are shown inline. The original table image is below.
View original table image
Conclusions
1. With few exceptions, the seasonal indices of turmeric arrivals in selected markets reached their peak during the month of March to June, and in the other months, no distinct trends were seen. While the price indices are moving around the average prices of turmeric. With certain exceptions, an inverse relationship between arrivals and prices was found. 2. The estimates of intra-year variation revealed that variability in arrivals were greater than variations in prices of turmeric in Marathwada region. In contrast, the inter-year fluctuations in arrivals were greater than the variability in prices of turmeric in all eight selected markets of the Marathwada region. 3. The estimates of intra-year variation revealed that variation in arrivals were greater than variations in turmeric prices in Marathwada region. However, in all eight markets of the Marathwada region examined inter-year variability in arrivals exceeded those in prices.
References
5 in the original paper- Benke SR, Gholap VB, Gade PV. An economic analysis of green gram arrivals and price behaviour in Akola district (Akola Agricultural Produce Market Committee) of Maharashtra. International Research Journal of Agricultural Economics and Statistics. 2016;7(2):198-202.
- Bhavani Devi I, Srikala M, Ananda T. Price behaviour of chillies in Guntur market of Andhra Pradesh, India. Indian Journal of Agricultural Research. 2016;50(5):471-474.
- Bodade VM, Deshmukh RG, Borkar P. Turmeric price movement across major markets of Madhya Pradesh. International Research Journal of Agricultural Economics & Statistics. 2017;8(1):162-169.
- Bodade VM, Borkar PJ, Nage SM. Arrival and price behaviour of soybean in major markets of Madhya Pradesh. International Journal of Applied and Pure Science and Agriculture. 2016;2(12):146-149.
- Anusha S, Kumar BS, Kumar DS. Time series analysis of Indian spices export and prices. Indian Journal of Agricultural Research. 2020;54(1):65-70.
Cited by 1
From OpenAlex, OpenCitations and reference lists read by Scinovex
- Forecasting Pepper and Turmeric Prices in India: A Machine Learning Analysis of Macroeconomic Drivers ↗
D. Vaishnavi, B. R. Santosh, Guruprasad Desai · F1000Research · 2026
Background Accurate forecasting of agricultural commodity prices is crucial for maintaining economic stability and informing data-driven policy interventions in emerging economies, such as India. Price volatility in key spices, such as pepper and turmeric, can significantly impact producers, consumers, and market stakeholders, underscoring the need for robust predictive models that capture both short-term fluctuations and long-term dependencies. Methods This study…
❝ 0PDF