
Research article · 2024 · Full text
International Journal of Agriculture Extension and Social DevelopmentAnalysis on the trend, direction of trade and export status of mango pulp from India
Volume 7(2) · Pages 178–182 · DOI: 10.33545/26180723.2024.v7.i2c.323 ↗
Research areasAgricultural Economics and PracticesGlobal Trade and Competitiveness
Abstract
Author-writtenIndia is the leading fruits producer of the world contributing 21 percent to the Asia’s and 11 percent of world’s fruit area. The study was conducted to analyse the trend, growth and direction of trade of mango pulp (HS 4-digit 0804 and 0812) of India for the period of twenty yeas from 2001-02 to 2020-21. The Compound Annual Growth Rate (CAGR) for two period (2001-02 to 2010-11 and 2011-12 to 2020-21) was calculated and the results showed negative growth rate in period II for both export quantity and export value with 5.8 percent and 3.45 percent, respectively. The direction of trade analysed and the transition probability matrix showed that China was the loyal trading partner with 64 percent retention capacity. The decline in mango pulp export was due to diversification in the export basket within processed fruits where the export was increased in jam, jelly and marmalades of mango but India experienced a positive trade balance for mango pulp which was due to many exports promotion policy of India.
Summary
Source-checkedPlain-language reading of the full paper, prepared with AI and checked against the text. Each point links to the authors' own words.
Why it matters
- India is a global leader in fruit production, accounting for 11% of the world's fruit area and 21% of Asia's. View evidence ↗
- Despite high production, India's fruit and vegetable processing level is very low at 2.2%, significantly lower than countries like the USA (80%) or France (70%). View evidence ↗
- The agro-food processing industry is a major economic driver in India, representing 32% of the total food market and 13% of total exports. View evidence ↗
The question
- The study aimed to analyze the growth, trends, and trade direction of Indian mango pulp exports over a twenty-year period from 2001-02 to 2020-21. View evidence ↗
What they did
- The researchers used secondary data from multiple international and national sources, including APEDA, UN COMTRADE, and the Indian Trade Portal. View evidence ↗
- The analysis focused on mango pulp (HS codes 0804 and 0812) using time-series data for export quantity and value over 20 years. View evidence ↗
- Compound Growth Rate (CGR) was calculated using an exponential form to identify trends in production and exports. View evidence ↗
- The Markov Chain Approach (MCA) and a transitional probability matrix were used to examine the direction of trade and market share retention. View evidence ↗
What they found
- Between 2017 and 2022, India's mango pulp export value rose from US$ 182,165,550 to US$ 220,198,437, while imports decreased from US$ 822,239 to US$ 749,675. View evidence ↗
- In 2020-21, India ranked third globally in mango pulp exports with a trade value of 220.19 thousand USD, behind Mexico and the Netherlands. View evidence ↗
- Mango pulp exports peaked at 186,197 MT in 2009-10, but declined to 98,369 MT by 2020-21. View evidence ↗
- Export growth was positive in Period I (10.79% quantity, 16.71% value) but turned negative in Period II (-6.52% volume, -4.21% value). View evidence ↗
- China was identified as the most stable trading partner, retaining 64% of its previous import share from India. View evidence ↗
What it means
- The authors conclude that the decline in mango pulp exports was caused by a shift in global demand toward other processed mango products like jam, jelly, and marmalades. View evidence ↗
- The authors also attribute the export decline to the low productivity of the Totapuri mango variety, which is the preferred variety for pulp production. View evidence ↗
Visual summary
3 visualsIllustrations explain the paper; charts are replotted from the paper's own table values.
Export Growth Shift
AI-generated conceptual illustration (mango pulp in industrial drums). It explains the idea and does not show study data.
View source evidence ↗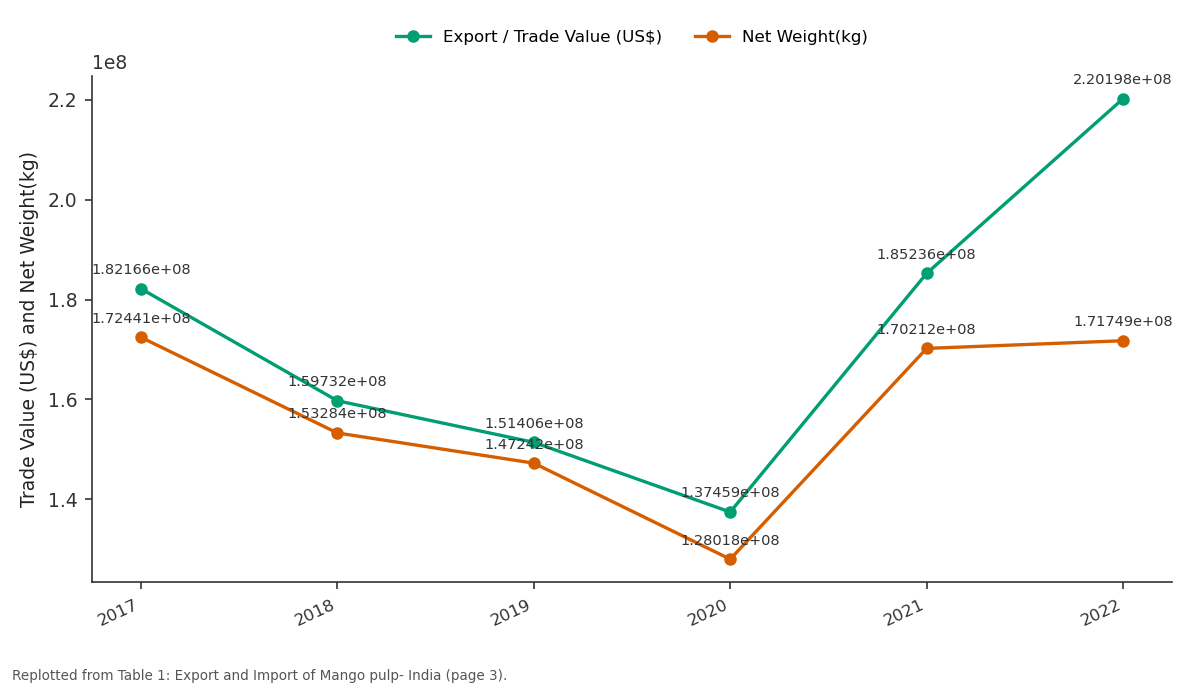
Export / Trade Value (US$) and Net Weight(kg): 2017 vs 2018 vs 2019 vs 2020 vs 2021
Replotted from Table 1 (page 3) of the original paper. Every bar is the paper's own table value.
View source evidence ↗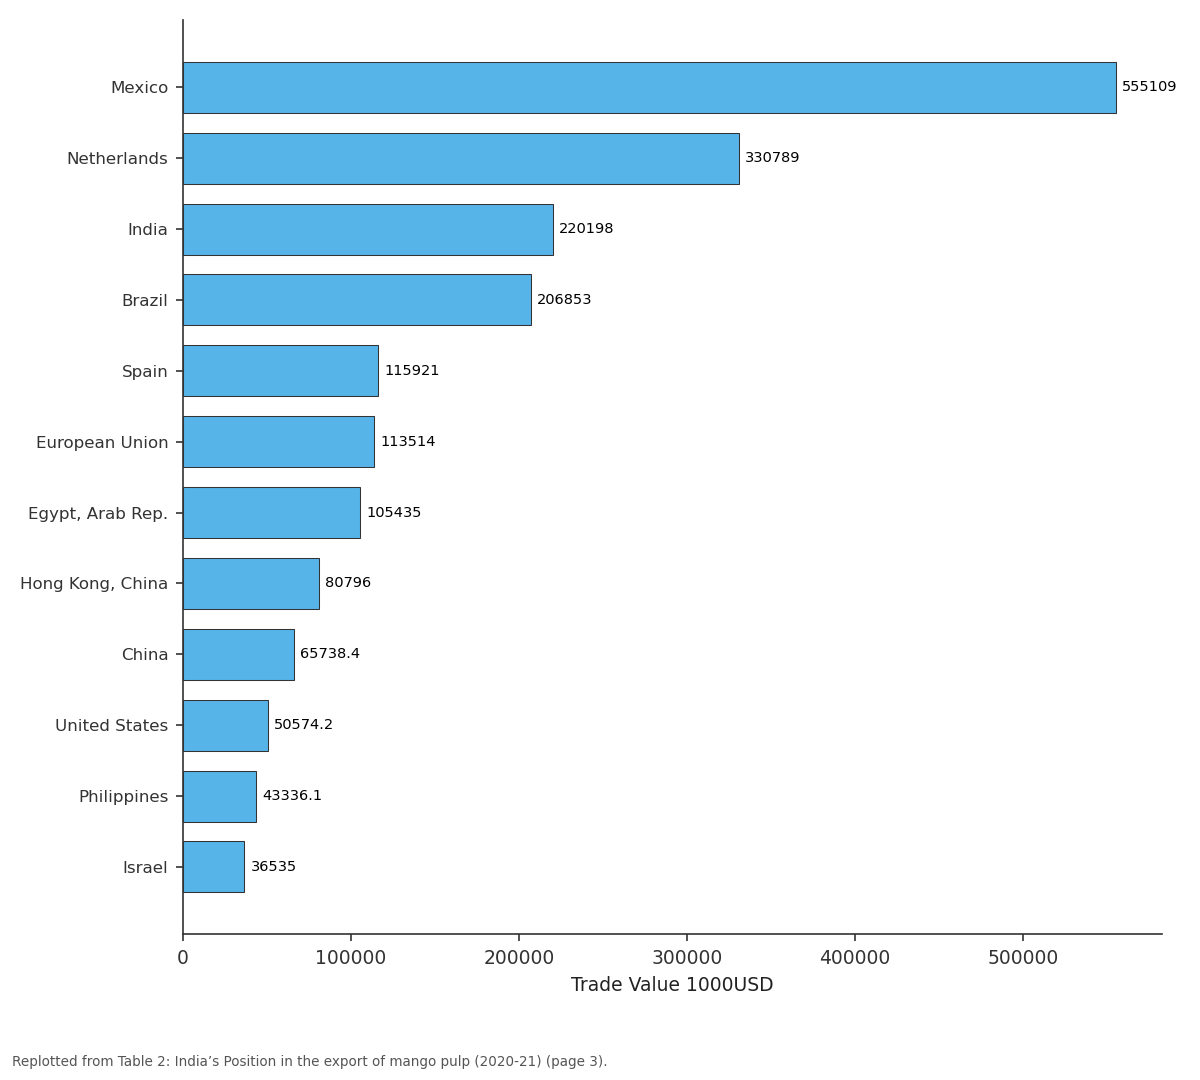
Trade Value 1000USD: Mexico vs Netherlands vs India vs Brazil vs Spain
Replotted from Table 2 (page 3) of the original paper. Every bar is the paper's own table value.
View source evidence ↗Figures & tables
From the original paper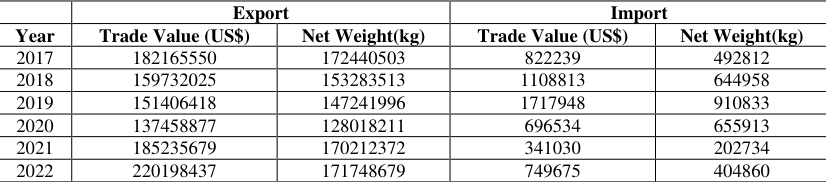 Table 1
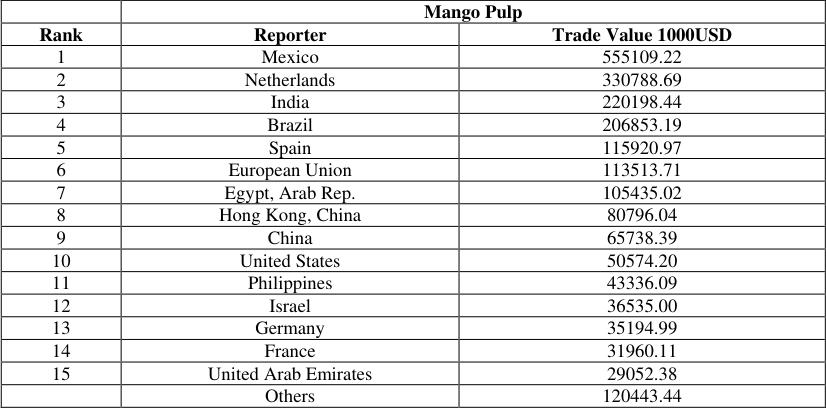 Table 2
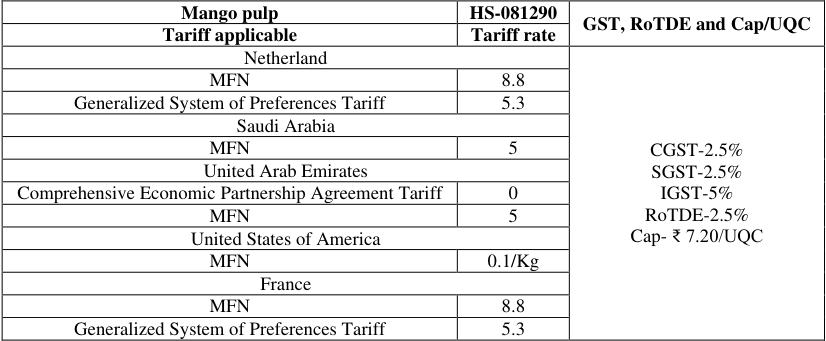 Table 3
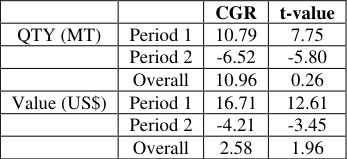 Table 4
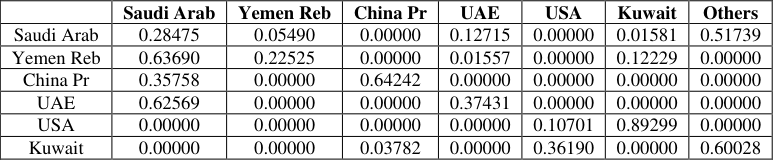 Table 5
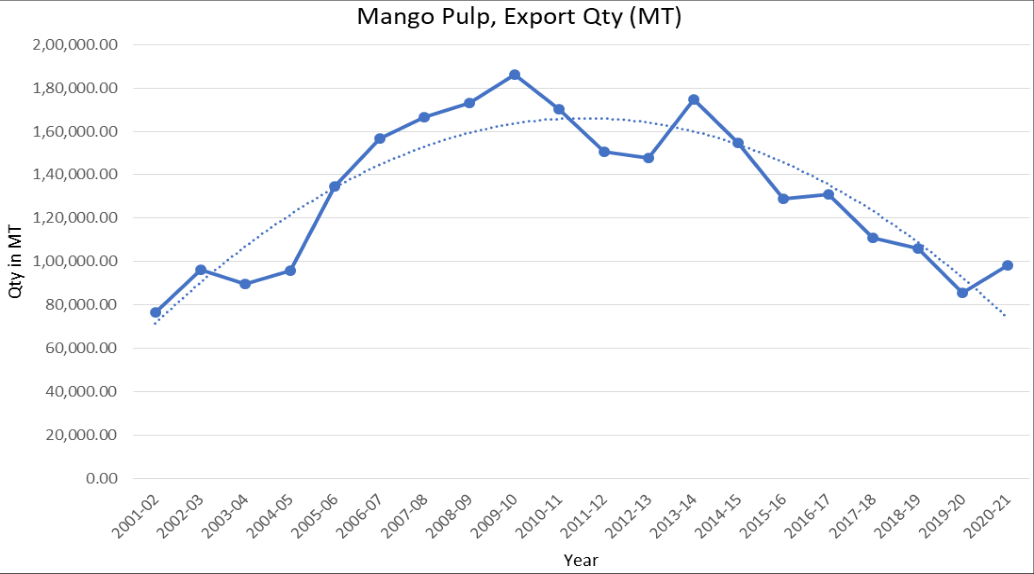 Figure 1
Introduction
India is the leading country in horticulture after China which produced 99.07 million metric tons of fruits and 191.77 million metric tons of vegetables from 2019 to 2020. India's share in the global production of mango, banana, onion, okra, and peas was 41 percent, 26 percent, 10 percent, 62 percent, and 36 percent, respectively. However, post-harvest loss was major in fruits-1-2 percent and vegetables-2-5 percent whereas the processing level of fruits and vegetables was very low in India (only 2.2 percent) compared to other countries such as the USA (80 percent), France (70 percent), and Thailand (30 percent), which was due to the lack of infrastructure for storage and processing of fruits and vegetables. However, the Indian agro-food processing industry accounts for 32 percent of the total food market and is one of the largest industries in the country, contributing 13 per cent to total exports and 6 per cent to industrial investment, ranking fifth in terms of production, consumption, export, and expected growth, employing around 18% of the country's industrial workforce. Changing lifestyles and increasing expenditures on health and nutritional foods have also contributed to the growth and sales of processed food in the domestic market at a faster pace. India's food and beverage packaging industry is expected to reach US$ 122.78 billion by 2025 due to 100% FDI in the food processing sector under the automatic route by the government. The sector has also recorded a sharp increase in investments, with a cumulative FDI inflow of US$ 10.94 billion between April 2000 and December 2021. Compound Growth Rate: Any variable's growth reveals its past performance and is widely used in economic research to determine a variable's trend over time. CGR was calculated to identify the trend in the production and export of processed fruits and processed vegetables from India using the exponential form as follows: ln Y t = ln Y o + t ln (1 +r). Here, Y t is the variable for which growth is calculated, r is the compound growth rate and In is the natural logarithm. Now, let ln Y o = β 1 and ln (1+r) =β 2 Therefore, the above equation becomes, ln Y t = β 1 + β 2t Now, β 1 and β 2 are estimated by Ordinary Least Square (OLS) method and the CAGR is given by, R = (antilog β 2 -1) × 100
Where, Y =Values of Production ('000 MT) and Export (MT/yr) t = time variable. b 0 and b 1 = coefficients to be estimated and ln is the natural log.
CAGR= (Antilog of b -1) x 100
Markov Chain Analysis: The trade directions of items exported were examined using the Markov Chain Approach (MCA). Central to MCA is the calculation of the transitional probability matrix P. The probability of retaining the previous period market share is interpreted by studying the diagonal elements of transitional probability matrix. Transitional probability matrix was obtained for the study period by using the actual proportion of exports to importing member countries. The elements of the matrix P show the probability that export of item might shift from j to i country with time. In this study, transitional probabilities were derived as a random process with selected eight importing countries. The exports to a specific country can be shown as:
Where, E it = Exports from India to the country i during the year t i.e. current year (2020). E it-1 = Exports to country during the period t-1 i.e. previous year. P ji = Probability that the exports will change from country to country. e it = statistically independent error terms of. t = time period n = number of countries The transitional probability P ji which can be arranged in a [c x r] matrix has following properties:
The diagonal element or transitional probabilities, on the indicate the probability that the share of exports in one country will shift to another over time; thus, the export share of a country during the period can be obtained by multiplying the actual exports in the previous period (t-1) by the transitional probability matrix. In this study, the P ji was calculated using the Minimum Absolute Deviations (MAD) method. The linear programming method was used as follows:
Where, o -is the vector of zeroes. p* -is the vector in which probability are set. i -is an apparently dimensioned vector of area. e -is a vector of error (1 u 1). y -is the vector of export to every country.
x -is the block diagonal matrix of lagged values of y v -is the vector of errors g -is the grouping matrix to add the row elements of p arranged in p* to unity. After calculating the transitional probability matrix, the expected shares of export were calculated by i=1, 2, 3…..n Where, y it = Estimated proportions of i th country's share at time t. y jt-1 = Observed proportion of j th country share at time t-1. P ji = Predicted transitional probability matrix.
The changes in India's exports of mango pulp to major importing countries will be analysed by employing the Markov chain model which captures the net effect changes in exports over the period. The advantages of Markov models are that they are completely general, and the generated sequences appear to be a sample of real-world usage as long as the model captures operational behaviour. Another advantage is that the model is based on a formal stochastic process, which has an analytical theory. Through this analysis, we can be able to identify which country will be having more retention of imports from India.
Result and Discussion Export and Import of Mango pulp
The export and import of mango pulp from India for the last five years from 2017-2022 is presented in Table 1. The export value was increased from US$ 182165550 in the year 2017 to US$ 220198437 in 2022 whereas the import was decreased from US$ 822239 in 2017 to US$ 749675 in 2022. This indicates that India was in the positive trade balance in the mango pulp trade for the last five years. www.extensionjournal.com
| — | Export | — | Import | — |
|---|---|---|---|---|
| Year | Trade Value (US$) | Net Weight(kg) | Trade Value (US$) | Net Weight(kg) |
| 2017 | 182165550 | 172440503 | 822239 | 492812 |
| 2018 | 159732025 | 153283513 | 1108813 | 644958 |
| 2019 | 151406418 | 147241996 | 1717948 | 910833 |
| 2020 | 137458877 | 128018211 | 696534 | 655913 |
| 2021 | 185235679 | 170212372 | 341030 | 202734 |
| 2022 | 220198437 | 171748679 | 749675 | 404860 |
Table text extracted from the original PDF; superscript letters are shown inline. The original table image is below.
View original table image
India's Position in the export of mango pulp
From the table it could be observed that India was in the third position with a trade value of 220.19 USD followed by Mexico (555.11 USD) and Netherlands (330.78 USD) for the period of 2020-21. The Indian mangoes are competitive in the world market for the taste and texture and the major varieties used for making pulp in India was Totapuri and Alphonso.
Tariff and export promotion for mango pulp export from India
The tariff rate for the export of mango pulp from India to top five importing countries viz., Netherland, Saudi Arabia, UAE, USA and France is presented in Table 3. The highest tariff rate was for European countries i.e., Netherland and France with 8.8 percent of Most Favoured Nation (MFN) and Generalized System of Preferences Tariff of 5.3 percent for each country. The Middle-East countries like Saudi Arabia and UAE had the MFN tariff of 5 percent and recently India signed CEPA which has the advantage of exporting to Gulf Council Countries (GCC) with zero rate of tariff other than MFN. The GST in India for export of mango pulp was 5 % with the RoTDE of 2.5% with the UQC cap of Rs. 7.20/Kg which is considered to be highest cap given compared to other processed fruits export.
Trend in the export of mango from India (2001-02 to 2020-21)
The X-Y plot for the export of mango pulp in terms of volume of export (MT) is given in Fig. 1. From this figure it could be concluded that the overall export showed a polynomial trend in the study period of 2001-02 to 2020-21. The growth rate in the export of mango pulp from India for period I and period II are established in Table 4. It is observed from the table that the period I has positive growth rate in terms of quantity as well as in value of export with 10.79 percent and 16.71 percent, respectively. There observed a negative growth rate of 6.52 percent and 4.21 percent for volume and value of mango pulp exported in period II, respectively. But the overall growth rate for the twenty-year period seems to be positive with 10.96 percent in volume exported and 2.58 percent in value of export.
| — | — | CGR | t-value |
|---|---|---|---|
| QTY (MT) | Period 1 | 10.79 | 7.75 |
| Period 2 | -6.52 | -5.80 | |
| Overall | 10.96 | 0.26 | |
| Value (US$) | Period 1 | 16.71 | 12.61 |
| Period 2 | -4.21 | -3.45 | |
| Overall | 2.58 | 1.96 |
Table text extracted from the original PDF; superscript letters are shown inline. The original table image is below.
View original table image
Direction of Trade
The direction of trade for mango pulp is presented in Table 5. From the table it could be concluded that China is the most stable country for exporting mango pulp from India as it retained 64 percent of its previous share from India. UAE is the next stable country with 37 percent of retention from previous year followed by Saudi Arab with 28 percent retention and Yemen with 23 percent of retention capacity of import from India. Kuwait is very unstable country as the country losses its100 percent of its previous year retention capacity where USA gained 89 percent and Yemen gained 12 percent of its trade from Kuwait. The other countries retained the maximum of 58 percent from its previous year as it constitutes of major importers like UK and Omen.
| — | Saudi Arab | Yemen Reb | China Pr | UAE | USA | Kuwait | Others |
|---|---|---|---|---|---|---|---|
| Saudi Arab | 0.28475 | 0.05490 | 0.00000 | 0.12715 | 0.00000 | 0.01581 | 0.51739 |
| Yemen Reb | 0.63690 | 0.22525 | 0.00000 | 0.01557 | 0.00000 | 0.12229 | 0.00000 |
| China Pr | 0.35758 | 0.00000 | 0.64242 | 0.00000 | 0.00000 | 0.00000 | 0.00000 |
| UAE | 0.62569 | 0.00000 | 0.00000 | 0.37431 | 0.00000 | 0.00000 | 0.00000 |
| USA | 0.00000 | 0.00000 | 0.00000 | 0.00000 | 0.10701 | 0.89299 | 0.00000 |
| Kuwait | 0.00000 | 0.00000 | 0.03782 | 0.00000 | 0.36190 | 0.00000 | 0.60028 |
Table text extracted from the original PDF; superscript letters are shown inline. The original table image is below.
View original table image
Conclusion
The Indian mangoes are considered as one of the tastiest mangoes in the world and the mango pulp export was increased for period I and showed a declining trend over period II. The reason for the decrease in the export of mango pulp was due to diversification of export baskets in the processed fruits. The jam, jelly and marmalades of mango was demanded more than the mango pulp in the global level; hence the export of jam, jelly and marmalades was increased and the mango pulp export was decreased.
The other reason for the decline in the export of mango pulp was due to low productivity of Totapuri mango variety which is considered as the suitable variety for making mango pulp. The direction of trade indicated that China was the loyal importer and the other countries had major share of retaining their previous year import from India.
Acknowledgement
AcknowledgementWe thank Agricultural and Processed Agricultural and Processed Food Products Export Development Authority (APEDA) for providing fellowship to this work and I extend my heartful gratitude to my chairman and advisory committee members to shape this article.
Figures and tables from the paper
| — | Mango Pulp | — |
|---|---|---|
| Rank | Reporter | Trade Value 1000USD |
| 1 | Mexico | 555109.22 |
| 2 | Netherlands | 330788.69 |
| 3 | India | 220198.44 |
| 4 | Brazil | 206853.19 |
| 5 | Spain | 115920.97 |
| 6 | European Union | 113513.71 |
| 7 | Egypt, Arab Rep. | 105435.02 |
| 8 | Hong Kong, China | 80796.04 |
| 9 | China | 65738.39 |
| 10 | United States | 50574.20 |
| 11 | Philippines | 43336.09 |
| 12 | Israel | 36535.00 |
| 13 | Germany | 35194.99 |
| 14 | France | 31960.11 |
| 15 | United Arab Emirates | 29052.38 |
| Others | 120443.44 |
Table text extracted from the original PDF; superscript letters are shown inline. The original table image is below.
View original table image
References
14 in the original paper- Angles S, Sundar A, Chinnadurai M. Impact of globalization on production and export of turmeric in India-An economic analysis. Agric. Econ. Res. Rev. 2011;24(347-2016-16971):301-308.
- Bairwa KC, Sharma R, Kumar T. Economics of growth and instability: Fruit crops of India. Rajasthan J Ext. Educ. 2012;20(1):128-132.
- Goyal SK, Gupta RB. Fresh and Processed Fruit & Vegetables: Growth in Production and Export from India. Foreign Trade Rev. 2009;43(4):32-51.
- Hasija RC, Kaushik LS, Suhag KS, Aneja DR. Growth and trend in area, production and productivity of wheat in Haryana. Agric. Sci. Dig. 2004;24(2):91-94.
- Jaskani MJ, Khan IA. Horticulture: An Overview. University of Agriculture Faisalabad, 2021.
- Joshi P, Kulkarni U, Munje S, Kulkarni S. Impact of Covid-19 pandemic on Indian fruits and vegetables export, postharvest management supply chain and future strategies. Agric International. 2019;6(2):4-8.
- Kumar V. Trends and performance of India's Agricultural Trade in the midst of COVID-19 pandemic. Indian J Agric. Econ. 2021;76(3):352-370.
- Manohar BH, Udhayan N. Growth and instability index of export of processed vegetables from India. J Pharm. Innov. 2022;11(5):991-994.
- Mohan A, Krishnan R, Arshinder K, Vandore J, Ramanathan U. Management of postharvest losses and wastages in the Indian tomato supply chain-a temperature-controlled storage perspective. Sustainability. 2023;15(2):1331.
- Mohandas K, Indhusree A, Kuruvila A. Exports of vegetables from India: An economic analysis. J Trop. Agric. 2018, 56(1).
- Nuthalapati CS, Sharma R. Requirement and Availability of Cold-Chain for Fruits and Vegetables in the Country. Benefits. 2021;23:4.
- Parihar S. Investigating Growth, Instability and Concentration of Indian Agricultural Export. Indore Management Journal. 2015, p. 13-19.
- Phadke M, Karandikar B, Gulati A. Grapes and Pomegranate Value Chains. In: Gulati, A., Ganguly, K., Wardhan, H. (eds) Agricultural Value Chains in India. India Studies in Business and Economics. Springer, Singapore, 2022. https://doi.org/10.1007/978-981-334268-2_5
- Rabha L, Sarma RK. Growth and export potential of horticultural crops from India: An overview. Econ. Aff. 2021;66(2):253-258.