
Research article · 2024 · Full text
International Journal of Agriculture Extension and Social DevelopmentConstruction of attitude scale for agricultural scientists towards their profession: A methodological approach
Volume 7(2) · Pages 172–177 · DOI: 10.33545/26180723.2024.v7.i2c.322 ↗
Research areasDiverse Educational Innovations StudiesAgricultural and Financial AuditingEducation and Professional Development
Abstract
Author-writtenThe research follows a systematic approach to develop and standardize items aimed at measuring the attitude of agricultural scientists towards their job. Initially, a total of 70 items were identified through an extensive literature review. Through collaboration with experts, a refined set of 60 items was selected after undergoing screening and editing processes. The scale value and quartile value of these items were determined based on assessments from a panel of 60 experts. Fifty-four items were ultimately selected for standardizing the scale. To ensure the validity of the items, both content validity and Kappa statistics were employed, leading to the final selection of 26 items for the attitude scale. The items were administered among 30 scientists who were not part of the sample group to verify reliability. The reliability of the test items was assessed using Cronbach's alpha, resulting in a high reliability value of 0.955 for the study. As a result, the standardized items for effectively measuring the attitude of agricultural scientists towards their job and workplace were found to be reliable and valid.
Summary
Source-checkedPlain-language reading of the full paper, prepared with AI and checked against the text. Each point links to the authors' own words.
Why it matters
- Agricultural scientists are essential for ensuring food security and promoting sustainable farming practices. View evidence ↗
- The professional attitude of these scientists significantly impacts innovation and progress within the agricultural sector. View evidence ↗
- Attitude scales are psychological tools used to quantify subjective perspectives on specific topics. View evidence ↗
The question
- The study aimed to develop and standardize a reliable scale to measure the attitudes of agricultural scientists toward their profession. View evidence ↗
What they did
- The researchers employed the Scale product method, combining elements of the Likert method and Thurston's equal appearing interval scale. View evidence ↗
- The initial pool of 70 items for the scale was gathered through a comprehensive review of existing literature. View evidence ↗
- Reliability was verified through pilot testing with 30 scientists who were not part of the original sample group. View evidence ↗
What they found
- Six items were removed due to high Q values and identical scale values, leaving 54 items for further screening. View evidence ↗
- Content validity testing led to the rejection of 23 items (I-CVI < 0.70), the revision of 5 items, and the acceptance of 26 items (I-CVI > 0.79). View evidence ↗
- The scale demonstrated high overall content validity, as indicated by an S-CVI/Ave score greater than 0.90. View evidence ↗
- After applying kappa statistics, 26 items were retained because they achieved an 'excellent' rating (kappa > 0.74). View evidence ↗
- The final scale showed high internal consistency and reliability, with a Cronbach's alpha value of 0.955. View evidence ↗
What it means
- The authors conclude that they have created a robust and reliable instrument for assessing the professional attitudes of agricultural scientists. View evidence ↗
- The validated scale is recommended as a valuable tool for future research to gain deeper insights into the perspectives of agricultural scientists. View evidence ↗
Visual summary
2 visualsIllustrations explain the paper; charts are replotted from the paper's own table values.
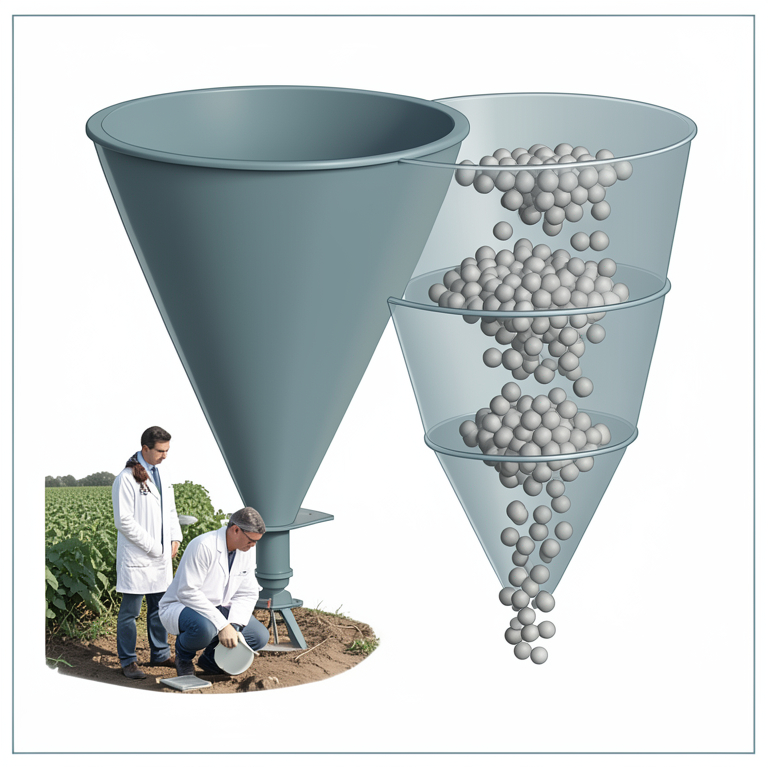
Scale Development Funnel
AI-generated conceptual illustration (agricultural scientists). It explains the idea and does not show study data.
View source evidence ↗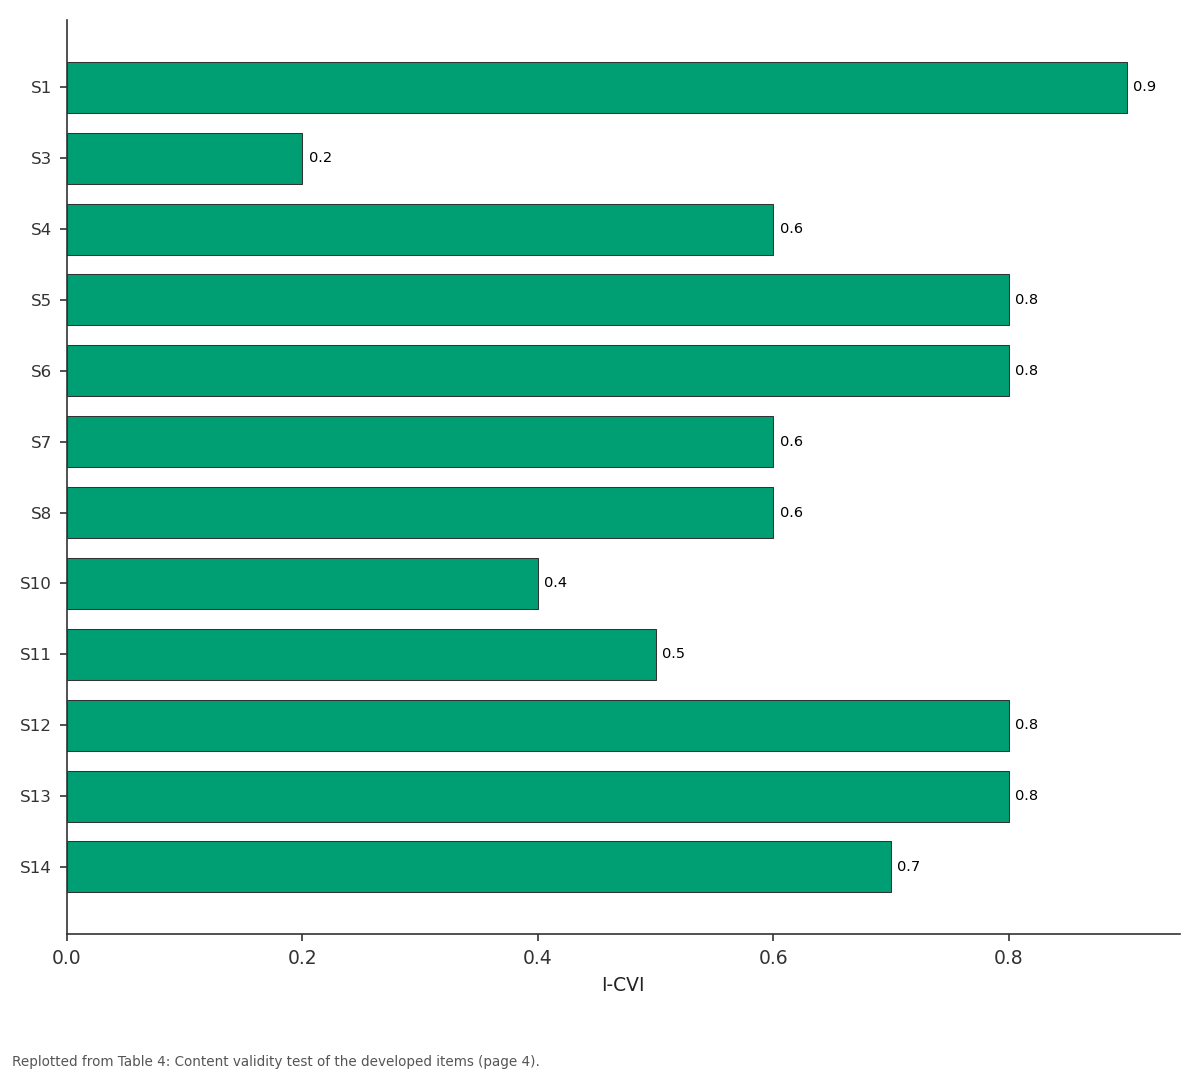
I-CVI: S1 vs S3 vs S4 vs S5 vs S6
Replotted from Table 4 (page 4) of the original paper. Every bar is the paper's own table value.
View source evidence ↗Figures & tables
From the original paper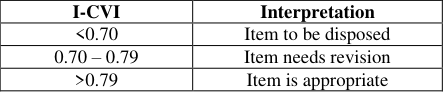 Table 1
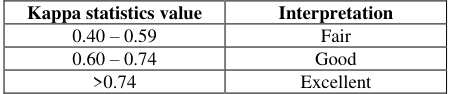 Table 2
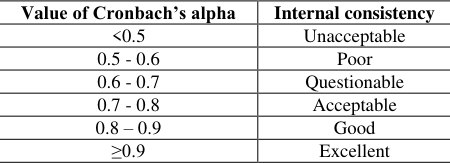 Table 3
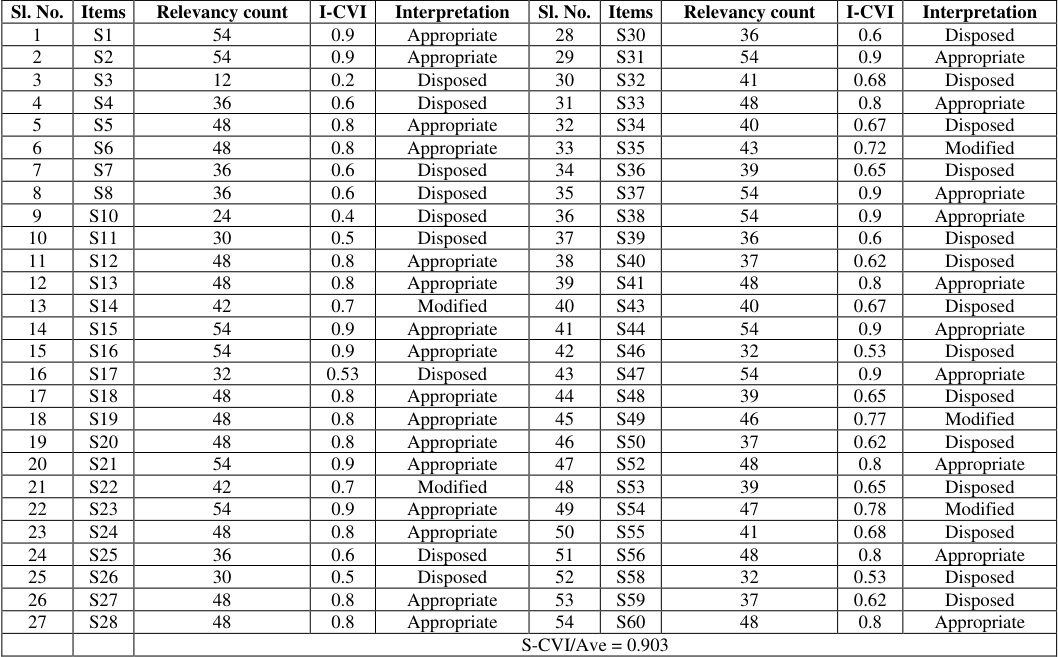 Table 4
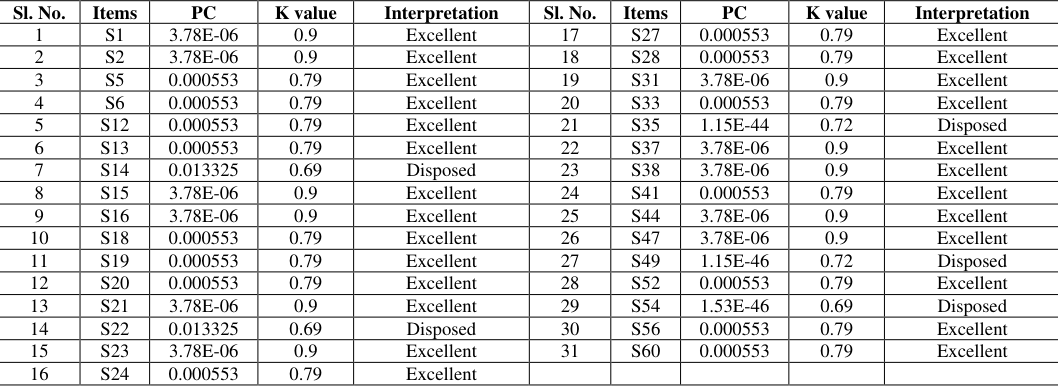 Table 5
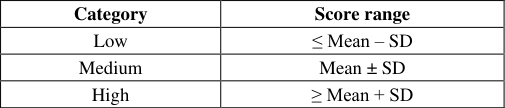 Table 6
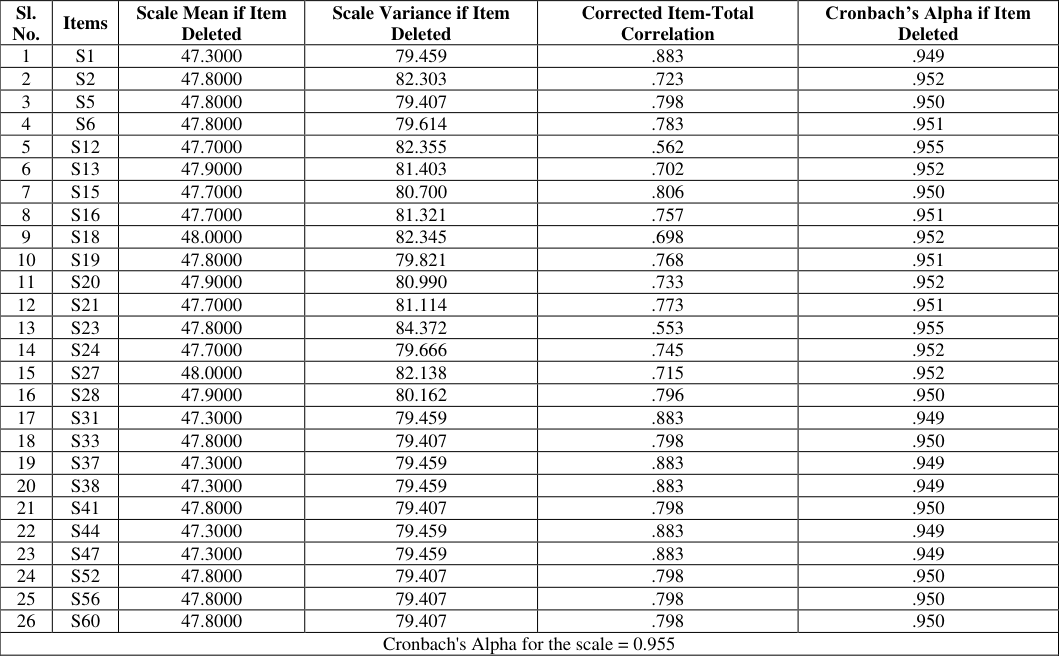 Table 7
Introduction
An attitude is a disposition to react favorably or unfavorably to a class of objects (Sarnoff, 1960) [1] . The role of attitude is significant in shaping how we perceive and react to different circumstances. It mirrors our mindset, convictions, and emotions, shaping our approach to challenges and interactions with others. In essence, our attitude is a potent influence that can affect not only our personal encounters but also the dynamics of the environments we engage with. The contribution of agricultural scientists is crucial in the promotion of sustainable farming methods and the assurance of food security. The manner in which they approach their academic or occupational environments has a substantial influence on advancements and creativity within the agricultural field. A constructive attitude entails a dedication to ongoing education, cooperation with colleagues, and the practical application of scientific principles to tackle field problems. Agricultural scientists who engage in their work with commitment and excitement play a key role in shaping robust and effective agricultural systems. The attitude scale serves as a psychological measurement instrument utilized to evaluate an individual's perspectives on specific objects, topics, or ideas. It commonly consists of a set of statements or inquiries crafted to measure the degree of agreement or disagreement from the respondent. The replies are quantified, generating a numerical scale that represents the individual's stance on the subject in question. In research, attitude scales play a crucial role by aiding psychologists and social scientists in comprehending and quantifying the intricate nature of human attitudes. They furnish a systematic approach for gauging subjective opinions, facilitating statistical analysis and comparisons among diverse groups or populations.
Methodology
Methodology
Selection of respondents
Sixty agricultural scientists specialized in agricultural extension from research, extension and academic centers of Kerala Agricultural University and Indian Council of Agricultural Research (ICAR) institutes were selected using simple random sampling technique for the study.
Data collection
The method used for attitude scale construction is Scale product method pioneered by (Eysenck and Crown, 1949) [2] suggested by Likert method with Thurston's equal appearing interval scale for item selection. This method stands as a statistical approach utilized in psychological studies for the examination of personality traits. The steps in developing items for attitude scale include item collection, item analysis, standardization of items and final selection of items for the test (Meenambigai et al., 2023) [3] .
Item collection
A thorough compilation of statements was created and gathered from literature, books, and conversations with experts, agricultural scientists, and researchers. The statements underwent a review and revision process, applying the criteria for attitude statements as delineated by (Edwards, 1957) [4] and endorsed by (Thurstone and Chave, 1629) [5] , (Wang, 1932) [6] , (Likert, 1932) [7] , (Bird, 1940) [8] , and (Edwars and Kilpatrick, 1948) [9] .
Item analysis
After undergoing a screening procedure utilizing a fivepoint response scale that encompassed choices such as "Most Relevant (MOR)," "More Relevant (MR)," "Relevant (R)," "Less Relevant (LR)," and "Not Relevant (NR)" assigning a score of 4,3,2,1 and 0 respectively. The items were presented to a group of evaluators who assessed the relevance of each item through methods such as postal communication, Google forms, and in-person visits. This approach aims to eliminate content that is deemed weak or irrelevant. Moreover, the evaluators were allowed to propose modifications, additions, or removals to the statements.
Determination of scale value and quartile value
Based on the rating the median value of the distribution and Q value for each statement were calculated. The median of the distribution for each statement was taken as scale value of the statement. The scale value was worked out with the help of formula (Thurstone and Chave, 1929) [10] :
Where, S = median or scale value of the statement l = the lower limit of the interval in which the median falls =the sum of the proportions below the interval in which the median falls = the proportion within the interval in which the median falls i=the width of the interval and is assumed to be equal to one The inter quartile range or Q value for each statement was worked out by the formula:
C 75 was the 75 th centile and calculated by the formula:
Where, l=the lower limit of the interval in which the 75 th centile falls =the sum proportion below the interval in which the 75th centile falls =the proportion within the interval in which the 75th centile falls C 25 was the 25 th centile and estimated by the formula:
Where, l = the lower limit of the interval in which the 25 th centile falls = the sum proportion below the interval in which the 25th centile falls = the proportion within the interval in which the 25th centile falls A higher Q value indicated that a statement was unclear or posed challenges in terms of the ratings it garnered. As a result, statements with elevated Q values were typically contemplated for exclusion. When multiple statements shared the same scale value, priority was given to the one with the lower Q value, signifying greater reliability and less ambiguity.
Standardization of scale
The reliability and validity of a scale were essential considerations in scale construction, ensuring the consistency and precision of the instrument to accurately measure its intended concept.
Validity test for the scale
The I-CVI served as a valuable instrument for evaluating the content validity of individual items in a scale or assessment. To compute the Content Validity Index at the item level (I-CVI), the ratio of experts who deemed the items relevant to the total number of content experts was calculated. The I-CVI ranged from 0 to 1, and its interpretation, as outlined by (Abdollahpour et al., 2010) [11] , is as follows:
The average item-level CVI (S-CVI/Ave) was the result of dividing the sum of the individual item-level CVIs (I-CVIs) by the total number of items in order to determine the Content Validity Index at the scale level (S-CVI). In this case, an S-CVI/Ave of 0.9 or higher showed outstanding content validity for the scale, implying a strong expert consensus that the items on the scale were pertinent and suitable for assessing the intended construct. A high S-CVI/Ave score indicated that the scale's overall content validity was at a high level. (Wynd et al., 2003) [12] suggested using multi-rater kappa statistics in addition to the Content Validity Index (CVI) to estimate content validity in order to overcome this restriction. Because they account for chance agreements among raters and reveal levels of agreement that go above what would be predicted by random chance, kappa statistics, or K, are very useful. For the estimation of modified kappa value, each items probability of chance agreements was calculated by the formula:
Where, N = number of experts in a panel A = number of panelists who agree that the item is relevant Finally, kappa value was estimated by formula:
Where, I-CVI = item level content validity index = probability of chance agreement
The table below shows the criteria for interpreting modified kappa value given by (Cicchetti and Sparrow, 1981) [13] .
Reliability of the scale
To ensure the statistical confirmation of reliability, the chosen elements underwent pilot testing involving 30 scientists not included in the actual sample. Each participant responded to statements using a five-point scale, ranging from "strongly agree" to "strongly disagree," with corresponding scores of 5, 4, 3, 2, and 1 for positive statements and reverse scores for negative ones. The reliability of each statement was assessed using Cronbach's alpha method by (Cronbach, 1651) [14] , which gauges the internal consistency of the scale. The value ranges from 0 to 1. The Cronbach's alpha was calculated using the formula:
Where, N= number of items = average covariance between item pairs = average variance
The proposed scale containing statements were presented to the selected respondents.
Results and Discussion
A distinct set of 70 statements were formulated to assess the attitude of agricultural scientists towards their profession.
The chosen statements were sent to 100 experts. Nonetheless, only 60 judges managed to submit their assessments within the designated time frame.
With the help of relevancy score for each statement, Scale value and quartile value was calculated. It was found that, six statements indicating higher Q value and had same scale value. Thus those 6 statements were excluded from the scale development. Thus remaining 54 statements were retained to the next screening procedure. The 54 statements were then subjected to standardization procedure. The content validity test was done both at item level i.e., item level content validity index (I-CVI) and at scale level i.e., item-level CVI (S-CVI/Ave). The result of the validity test is shown in Table 4. The result from the Table 5. Shows that, those items with kappa value greater than 0.74 were excellent and those items with kappa value less than 0.74 were removed. Thus 26 items were retained in the scale construction. For checking the reliability of the constructed scale, the 26 statements were subjected for a pilot testing in 30 nonsample respondents i.e., Agricultural scientists. The statements were presented to respondents using a five-point continuum: Strongly Agree (SA), Agree (A), Undecided (UD), Disagree (D), and Strongly Disagree (SD), assigned scores of 4, 3, 2, 1, and 0, respectively for positive statements, and 0, 1, 2, 3, and 4, respectively for negative statements. Cronbach's alpha method was used to test reliability of the constructed scale. Table 7. shows the results of reliability test conducted. The Cronbach's alpha value obtained for the scale was 0.955, which had higher internal consistency of the scale. Thus, the scale was confirmed as reliable.
| Sl. No. | Items | Scale Mean if Item Deleted | Scale Variance if Item Deleted | Corrected Item-Total Correlation | Cronbach’s Alpha if Item Deleted |
|---|---|---|---|---|---|
| 1 | S1 | 47.3000 | 79.459 | .883 | .949 |
| 2 | S2 | 47.8000 | 82.303 | .723 | .952 |
| 3 | S5 | 47.8000 | 79.407 | .798 | .950 |
| 4 | S6 | 47.8000 | 79.614 | .783 | .951 |
| 5 | S12 | 47.7000 | 82.355 | .562 | .955 |
| 6 | S13 | 47.9000 | 81.403 | .702 | .952 |
| 7 | S15 | 47.7000 | 80.700 | .806 | .950 |
| 8 | S16 | 47.7000 | 81.321 | .757 | .951 |
| 9 | S18 | 48.0000 | 82.345 | .698 | .952 |
| 10 | S19 | 47.8000 | 79.821 | .768 | .951 |
| 11 | S20 | 47.9000 | 80.990 | .733 | .952 |
| 12 | S21 | 47.7000 | 81.114 | .773 | .951 |
| 13 | S23 | 47.8000 | 84.372 | .553 | .955 |
| 14 | S24 | 47.7000 | 79.666 | .745 | .952 |
| 15 | S27 | 48.0000 | 82.138 | .715 | .952 |
| 16 | S28 | 47.9000 | 80.162 | .796 | .950 |
| 17 | S31 | 47.3000 | 79.459 | .883 | .949 |
| 18 | S33 | 47.8000 | 79.407 | .798 | .950 |
| 19 | S37 | 47.3000 | 79.459 | .883 | .949 |
| 20 | S38 | 47.3000 | 79.459 | .883 | .949 |
| 21 | S41 | 47.8000 | 79.407 | .798 | .950 |
| 22 | S44 | 47.3000 | 79.459 | .883 | .949 |
| 23 | S47 | 47.3000 | 79.459 | .883 | .949 |
| 24 | S52 | 47.8000 | 79.407 | .798 | .950 |
| 25 | S56 | 47.8000 | 79.407 | .798 | .950 |
| 26 | S60 | 47.8000 | 79.407 | .798 | .950 |
| Cronbach's Alpha for the scale = 0.955 |
Table text extracted from the original PDF; superscript letters are shown inline. The original table image is below.
View original table image
| Sl. No. | Items | PC | K value | Interpretation | Sl. No. | Items | PC | K value | Interpretation |
|---|---|---|---|---|---|---|---|---|---|
| 1 | S1 | 3.78E-06 | 0.9 | Excellent | 17 | S27 | 0.000553 | 0.79 | Excellent |
| 2 | S2 | 3.78E-06 | 0.9 | Excellent | 18 | S28 | 0.000553 | 0.79 | Excellent |
| 3 | S5 | 0.000553 | 0.79 | Excellent | 19 | S31 | 3.78E-06 | 0.9 | Excellent |
| 4 | S6 | 0.000553 | 0.79 | Excellent | 20 | S33 | 0.000553 | 0.79 | Excellent |
| 5 | S12 | 0.000553 | 0.79 | Excellent | 21 | S35 | 1.15E-44 | 0.72 | Disposed |
| 6 | S13 | 0.000553 | 0.79 | Excellent | 22 | S37 | 3.78E-06 | 0.9 | Excellent |
| 7 | S14 | 0.013325 | 0.69 | Disposed | 23 | S38 | 3.78E-06 | 0.9 | Excellent |
| 8 | S15 | 3.78E-06 | 0.9 | Excellent | 24 | S41 | 0.000553 | 0.79 | Excellent |
| 9 | S16 | 3.78E-06 | 0.9 | Excellent | 25 | S44 | 3.78E-06 | 0.9 | Excellent |
| 10 | S18 | 0.000553 | 0.79 | Excellent | 26 | S47 | 3.78E-06 | 0.9 | Excellent |
| 11 | S19 | 0.000553 | 0.79 | Excellent | 27 | S49 | 1.15E-46 | 0.72 | Disposed |
| 12 | S20 | 0.000553 | 0.79 | Excellent | 28 | S52 | 0.000553 | 0.79 | Excellent |
| 13 | S21 | 3.78E-06 | 0.9 | Excellent | 29 | S54 | 1.53E-46 | 0.69 | Disposed |
| 14 | S22 | 0.013325 | 0.69 | Disposed | 30 | S56 | 0.000553 | 0.79 | Excellent |
| 15 | S23 | 3.78E-06 | 0.9 | Excellent | 31 | S60 | 0.000553 | 0.79 | Excellent |
| 16 | S24 | 0.000553 | 0.79 | Excellent |
Table text extracted from the original PDF; superscript letters are shown inline. The original table image is below.
View original table image
| Sl. No. | Items | Relevancy count | I-CVI | Interpretation | Sl. No. | Items | Relevancy count | I-CVI | Interpretation |
|---|---|---|---|---|---|---|---|---|---|
| 1 | S1 | 54 | 0.9 | Appropriate | 28 | S30 | 36 | 0.6 | Disposed |
| 2 | S2 | 54 | 0.9 | Appropriate | 29 | S31 | 54 | 0.9 | Appropriate |
| 3 | S3 | 12 | 0.2 | Disposed | 30 | S32 | 41 | 0.68 | Disposed |
| 4 | S4 | 36 | 0.6 | Disposed | 31 | S33 | 48 | 0.8 | Appropriate |
| 5 | S5 | 48 | 0.8 | Appropriate | 32 | S34 | 40 | 0.67 | Disposed |
| 6 | S6 | 48 | 0.8 | Appropriate | 33 | S35 | 43 | 0.72 | Modified |
| 7 | S7 | 36 | 0.6 | Disposed | 34 | S36 | 39 | 0.65 | Disposed |
| 8 | S8 | 36 | 0.6 | Disposed | 35 | S37 | 54 | 0.9 | Appropriate |
| 9 | S10 | 24 | 0.4 | Disposed | 36 | S38 | 54 | 0.9 | Appropriate |
| 10 | S11 | 30 | 0.5 | Disposed | 37 | S39 | 36 | 0.6 | Disposed |
| 11 | S12 | 48 | 0.8 | Appropriate | 38 | S40 | 37 | 0.62 | Disposed |
| 12 | S13 | 48 | 0.8 | Appropriate | 39 | S41 | 48 | 0.8 | Appropriate |
| 13 | S14 | 42 | 0.7 | Modified | 40 | S43 | 40 | 0.67 | Disposed |
| 14 | S15 | 54 | 0.9 | Appropriate | 41 | S44 | 54 | 0.9 | Appropriate |
| 15 | S16 | 54 | 0.9 | Appropriate | 42 | S46 | 32 | 0.53 | Disposed |
| 16 | S17 | 32 | 0.53 | Disposed | 43 | S47 | 54 | 0.9 | Appropriate |
| 17 | S18 | 48 | 0.8 | Appropriate | 44 | S48 | 39 | 0.65 | Disposed |
| 18 | S19 | 48 | 0.8 | Appropriate | 45 | S49 | 46 | 0.77 | Modified |
| 19 | S20 | 48 | 0.8 | Appropriate | 46 | S50 | 37 | 0.62 | Disposed |
| 20 | S21 | 54 | 0.9 | Appropriate | 47 | S52 | 48 | 0.8 | Appropriate |
| 21 | S22 | 42 | 0.7 | Modified | 48 | S53 | 39 | 0.65 | Disposed |
| 22 | S23 | 54 | 0.9 | Appropriate | 49 | S54 | 47 | 0.78 | Modified |
| 23 | S24 | 48 | 0.8 | Appropriate | 50 | S55 | 41 | 0.68 | Disposed |
| 24 | S25 | 36 | 0.6 | Disposed | 51 | S56 | 48 | 0.8 | Appropriate |
| 25 | S26 | 30 | 0.5 | Disposed | 52 | S58 | 32 | 0.53 | Disposed |
| 26 | S27 | 48 | 0.8 | Appropriate | 53 | S59 | 37 | 0.62 | Disposed |
| 27 | S28 | 48 | 0.8 | Appropriate | 54 | S60 | 48 | 0.8 | Appropriate |
| S-CVI/Ave = 0.903 |
Table text extracted from the original PDF; superscript letters are shown inline. The original table image is below.
View original table image
Administration of the test and final scoring
To compute individual scores in the scale-product method the Likert scale value and the scale value derived from Thurstone's approach were multiplied together for each item. The resulting scores for the total items quantitatively reflect an individual's attitude based on the responses of the respondents to the scale.
Based on the scores obtained by the respondents, they were categorized into three categories.
Conclusion
The meticulous development and standardization of the attitude scale for agricultural scientists have resulted in a robust and reliable instrument for assessing their perspectives towards their profession. The scale's successful validation and reliability made it a valuable tool for future research endeavors, offering researchers and practitioners a means to gain deeper insights into the nuanced perspectives of individuals within the agricultural science domain. As we move forward, this developed attitude scale stands as a valuable contribution to the field, providing a reliable framework for understanding and evaluating the attitude of agricultural scientists.
Acknowledgement
AcknowledgementsThe first author is a doctoral research scholar who has produced this article as a result of her doctoral research conducted at Kerala Agricultural University. The research has been financially supported by the university. Nevertheless, the author bears full responsibility for the accuracy of the facts, the expression of opinions, and the formulation of conclusions presented in the article. The comprehensive study carried out by her under the auspices of Kerala Agricultural University delves into the intricate aspects of the subject matter.
Figures and tables from the paper
| I-CVI | Interpretation |
|---|---|
| <0.70 | Item to be disposed |
| 0.70 – 0.79 | Item needs revision |
| >0.79 | Item is appropriate |
Table text extracted from the original PDF; superscript letters are shown inline. The original table image is below.
View original table image
| Kappa statistics value | Interpretation |
|---|---|
| 0.40 – 0.59 | Fair |
| 0.60 – 0.74 | Good |
| >0.74 | Excellent |
Table text extracted from the original PDF; superscript letters are shown inline. The original table image is below.
View original table image
| Value of Cronbach’s alpha | Internal consistency |
|---|---|
| <0.5 | Unacceptable |
| 0.5 - 0.6 | Poor |
| 0.6 - 0.7 | Questionable |
| 0.7 - 0.8 | Acceptable |
| 0.8 – 0.9 | Good |
| ≥0.9 | Excellent |
Table text extracted from the original PDF; superscript letters are shown inline. The original table image is below.
View original table image
| Category | Score range |
|---|---|
| Low | ≤ Mean – SD |
| Medium | Mean ± SD |
| High | ≥ Mean + SD |
Table text extracted from the original PDF; superscript letters are shown inline. The original table image is below.
View original table image
References
10 in the original paper- Sarnoff I. Psychoanalytic theory and social attitudes. Public Opin Q. 1960;24:251-279.
- Eysenck HJ, Crown S. An experimental study in opinion attitude methodology. Int J Opinion-Attitude Res. 1949;3:47-86.
- Meenambigai J, Lokeshwaran D, Durairaj S. Attitude scale construction methodology in extension education research. In: Recent Trends in Agricultural Extension Research. 2023;1st ed. Chapter 8:66-79.
- Wang KA. Suggested criteria for writing attitude statements. J Soc Psychol. 1932;3:367-373.
- Likert RA. A Technique for the measurement of www.extensionjournal.com attitude. Arch Psychol. 1932;22(140):44-53.
- Edwards AL, Kilpatrick FP. A technique for construction of attitude scale. J Appl Psychol. 1948;32:374-384.
- Abdollahpour E, Nejat S, Nourozian M, Majdzadeh R. The process of content validity in instrument development. Iranian Epidemiol. 2010;6(4):66-74.
- Wynd CA, Schmidt B, Schaefer MA. Two quantitative approaches for estimating content validity. West J Nurs Res. 2003;25(5):508-518.
- Cicchetti DV, Sparrow SA. Developing criteria for establishing interrater reliability of specific items: applications to assessment of adaptive behavior. Am J Ment Defic. 1981;86(2):127-137.
- Cronbach LJ. Coefficient alpha and the internal structure of tests. Psychometrika. 1951;16:297-334.