
Research article · 2024 · Full text
International Journal of Advanced Biochemistry ResearchDetermination of minimum inhibitory concentration for chitosan extracted from freshwater prawn, Macrobrachium dayanum (Henderson, 1893) against Gram negative bacteria
Volume 8(2S) · Pages 194–200 · DOI: 10.33545/26174693.2024.v8.i2sc.537 ↗
Research areasAquatic life and conservation
Abstract
Author-writtenRecently, antibacterial resistance is the one of the major problems faced by the people. The need of the hour is to obtain natural biopolymer with antibacterial efficacy. In the current study, chitosan was extracted from the shell of freshwater prawn, M. dayanum. M. dayanum are edible prawns, found in ponds and rivers of Jharkhand. The extracted chitosan was structurally characterized and degree of deacetylation was calculated through FT-IR spectroscopy. Further the antibacterial activity of chitosan was assayed by Minimum Inhibitory Concentration (MIC). The result of the present study showed that FT-IR spectrum of extracted chitosan contains peak at 898,1033,1419,1554,1651, 2881 and 3263 cm-1. The degree of deacetylation of the extracted chitosan was calculated as 79.37±0.58%. The result revealed that in case of E. coli (ATCC 8739), MIC of chitosan was 0.15 mg/ml and percentage of bacterial growth was 75.86% and percentage of minimum bacterial growth inhibition was 24.14%. In case of P. aeruginosa (ATCC 10145) MIC of chitosan was 0.15 mg/ml and percentage of bacterial growth was 95.68% and percentage of minimum bacterial growth inhibition was 4.32%. Statistical analysis showed that the MIC value of chitosan concentration of 0.15 mg/ml obtained from M. dayanum against E. coli (ATCC 8739) was significantly more susceptible than against P. aeruginosa (ATCC 10145) with MIC value of 0.15 mg/ml (p<0.001) based on the O.D observed. The assay showed that chitosan has concentration dependent antibacterial activity against human pathogenic bacterial strains which designates its probable use as effective antibacterial agent.
Summary
Source-checkedPlain-language reading of the full paper, prepared with AI and checked against the text. Each point links to the authors' own words.
Why it matters
- The rise of antibacterial resistance has created an urgent need for natural biopolymers that possess antibacterial properties. View evidence ↗
- Pathogenic E. coli can cause a range of human diseases, including watery diarrhea, urinary tract infections, neonatal meningitis, and sepsis. View evidence ↗
- Pseudomonas aeruginosa poses a significant clinical risk primarily to immunocompromised patients, such as those with cancer, AIDS, or severe burns. View evidence ↗
The question
- The study aimed to extract chitosan from the freshwater prawn Macrobrachium dayanum, characterize its structure and deacetylation degree, and determine its minimum inhibitory concentration (MIC) against E. coli and P. aeruginosa. View evidence ↗
What they did
- Chitosan was extracted from the shells of M. dayanum prawns collected from Jharkhand using a process of demineralization, deproteinization, and deacetylation. View evidence ↗
- The antibacterial activity was measured using a two-fold serial dilution method with chitosan concentrations ranging from 0.03 mg/ml to 5 mg/ml. View evidence ↗
- Bacterial growth was monitored by recording optical density (OD) values at 600 nm using a UV spectrophotometer. View evidence ↗
What they found
- The extraction process yielded chitosan at a rate of 11.62±1.07% from the shell powder and 86.66±1.23% from the chitin. View evidence ↗
- The degree of deacetylation for the chitosan extracted from M. dayanum was calculated to be 79.37±0.58%. View evidence ↗
- For E. coli (ATCC 8739), the minimum inhibitory concentration (MIC) of the chitosan was 0.15 mg/ml, resulting in 24.14% growth inhibition. View evidence ↗
- For P. aeruginosa (ATCC 10145), the MIC was also 0.15 mg/ml, though the growth inhibition was lower at 4.32%. View evidence ↗
- Statistical analysis indicated that E. coli was significantly more susceptible to the 0.15 mg/ml chitosan concentration than P. aeruginosa (p<0.001). View evidence ↗
- The antibacterial activity of the chitosan was concentration-dependent, with increasing concentrations (from 0.15 to 5 mg/ml) leading to decreased bacterial growth. View evidence ↗
What it means
- The authors conclude that chitosan from M. dayanum exhibits concentration-dependent antibacterial activity, suggesting its potential as a potent antibacterial agent. View evidence ↗
- The study recommends M. dayanum shells as a promising natural substrate for producing chitosan using standard extraction methods. View evidence ↗
Visual summary
3 visualsIllustrations explain the paper; charts are replotted from the paper's own table values.
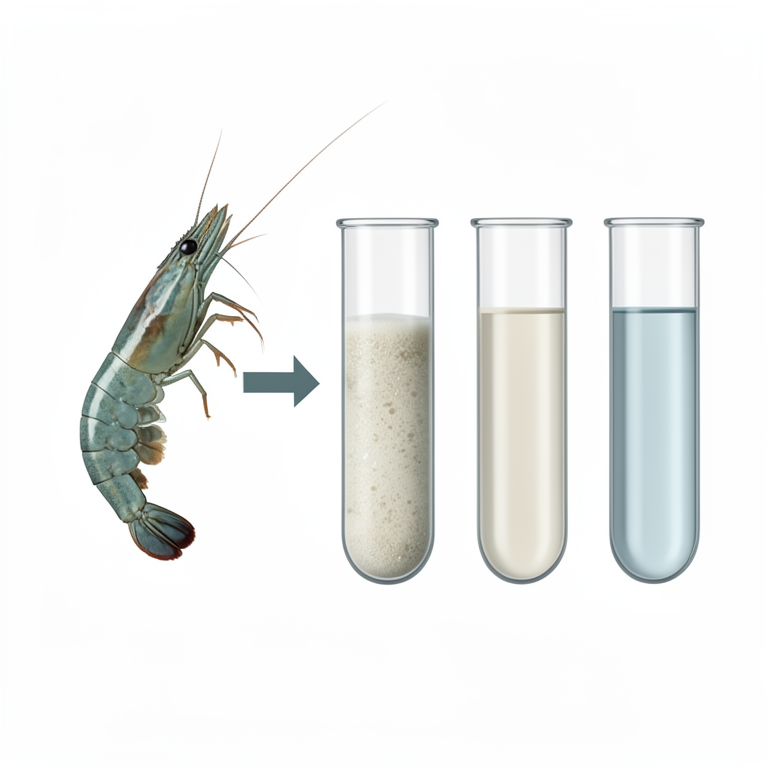
Concentration-Dependent Inhibition
AI-generated conceptual illustration (Macrobrachium dayanum prawn shells and Gram-negative bacteria in test tubes). It explains the idea and does not show study data.
View source evidence ↗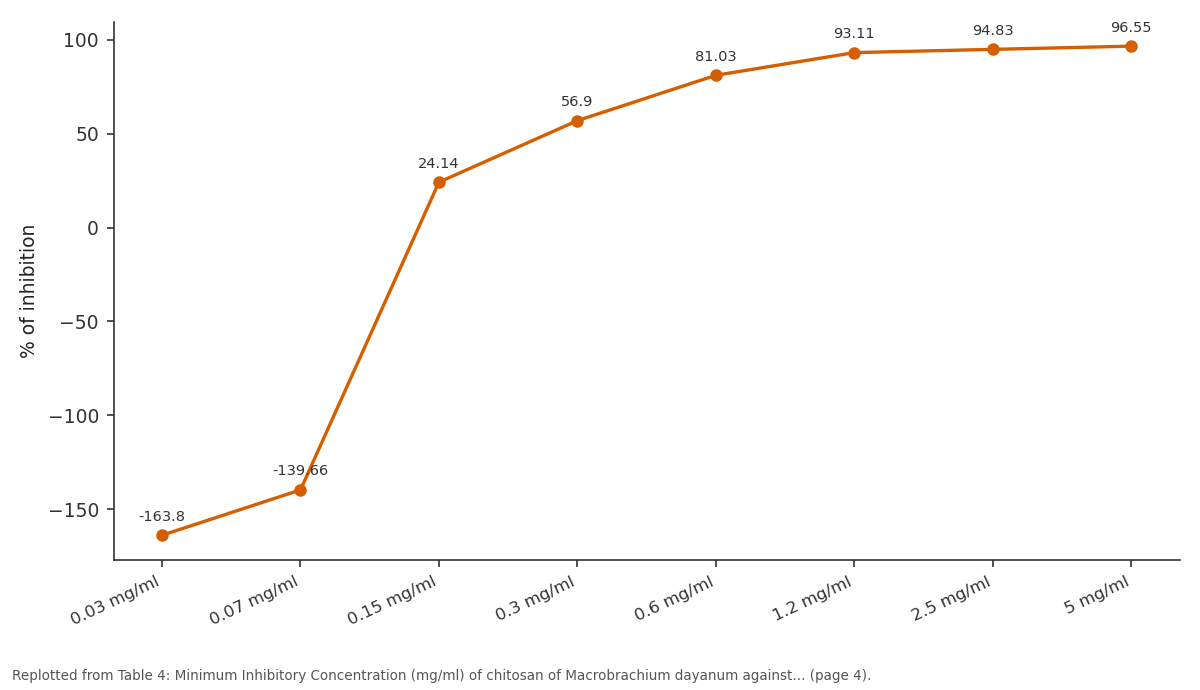
% of inhibition: 0.03 mg/ml vs 0.07 mg/ml vs 0.15 mg/ml vs 0.3 mg/ml vs 0.6 mg/ml
Replotted from Table 4 (page 4) of the original paper. Every bar is the paper's own table value.
View source evidence ↗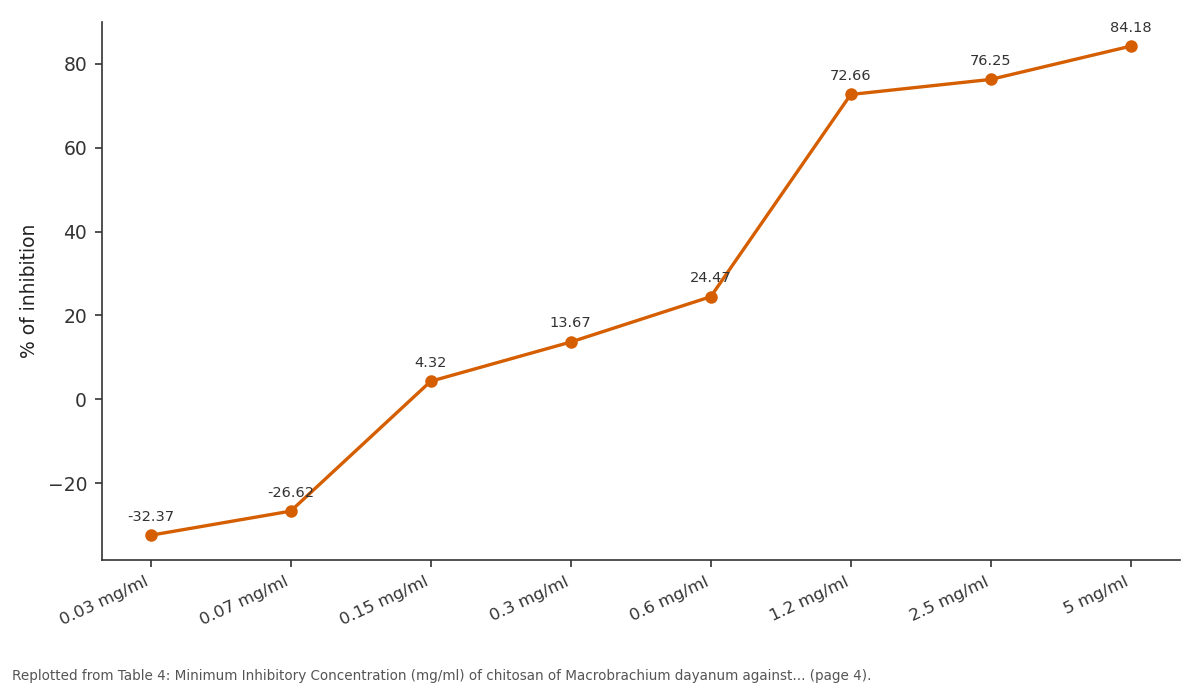
% of inhibition: 0.03 mg/ml vs 0.07 mg/ml vs 0.15 mg/ml vs 0.3 mg/ml vs 0.6 mg/ml
Replotted from Table 4 (page 4) of the original paper. Every bar is the paper's own table value.
View source evidence ↗Figures & tables
From the original paper Table 1
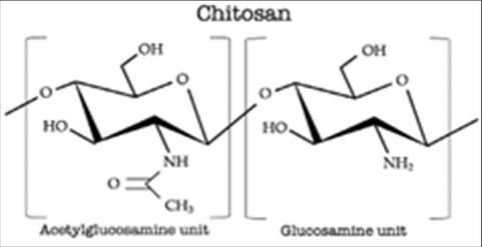 Figure 1
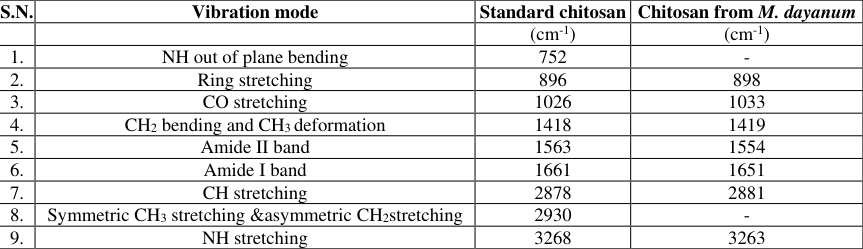 Table 2
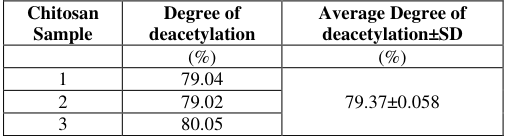 Table 3
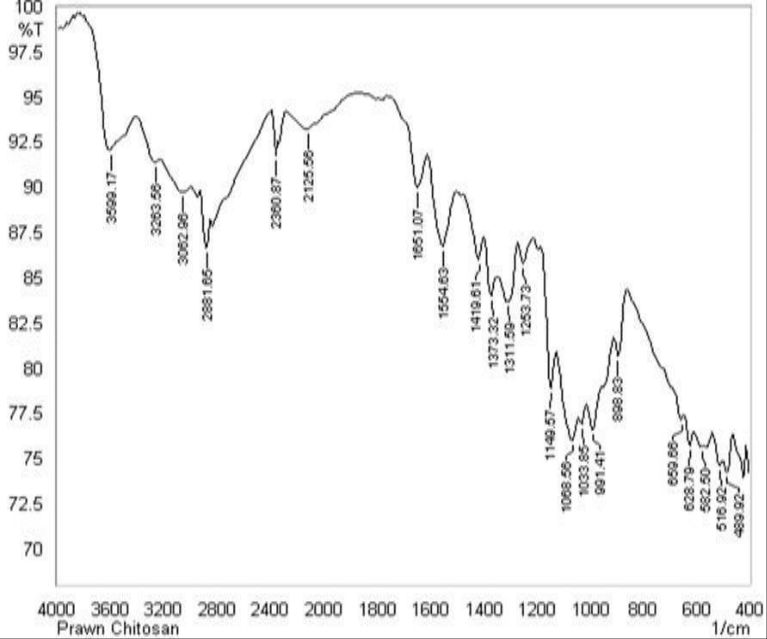 Figure 2
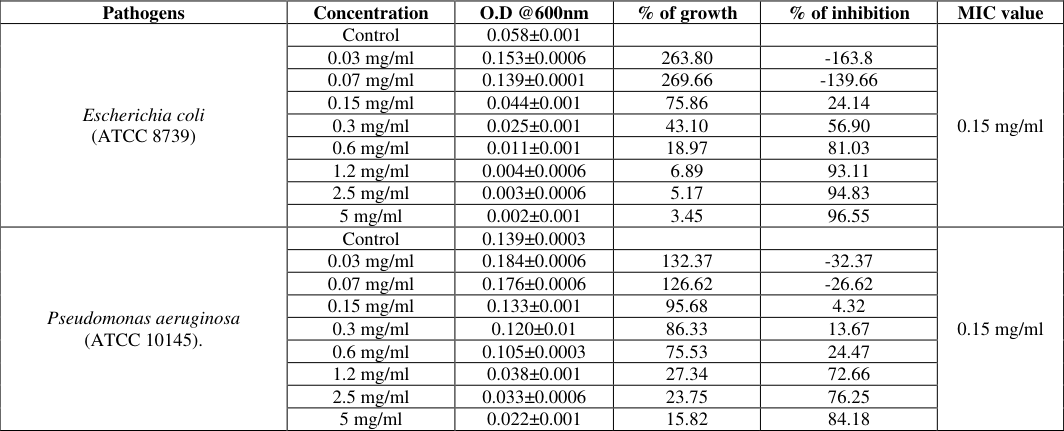 Table 4
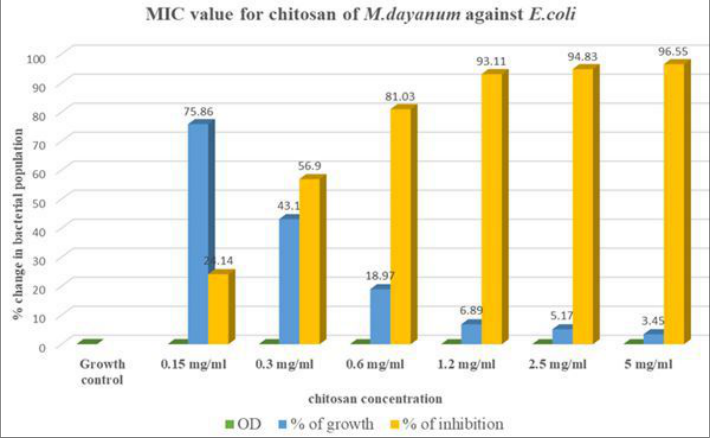 Figure 3
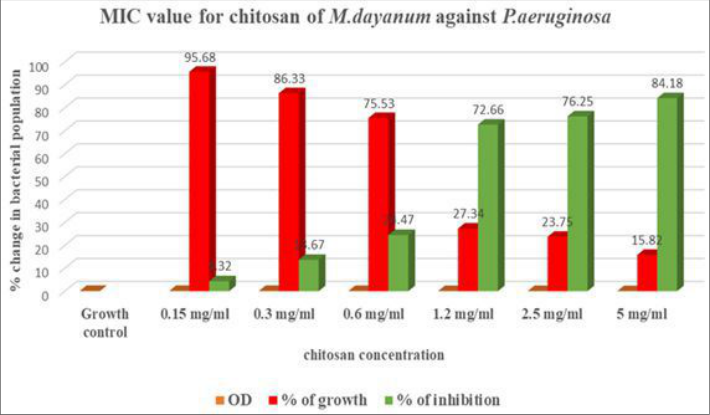 Figure 4
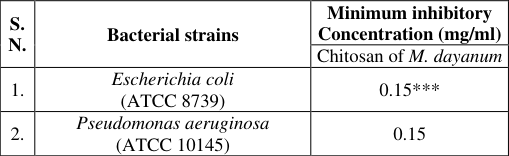 Table 5
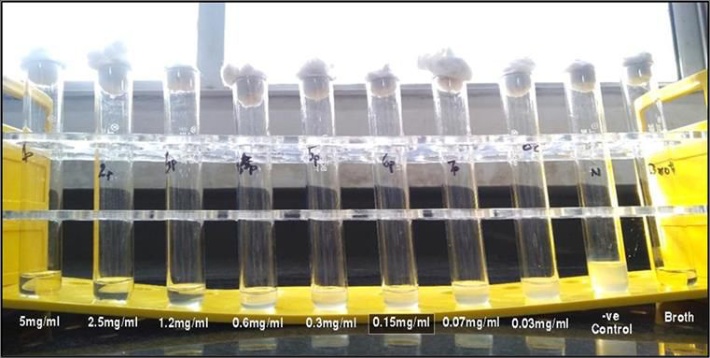 Figure 5
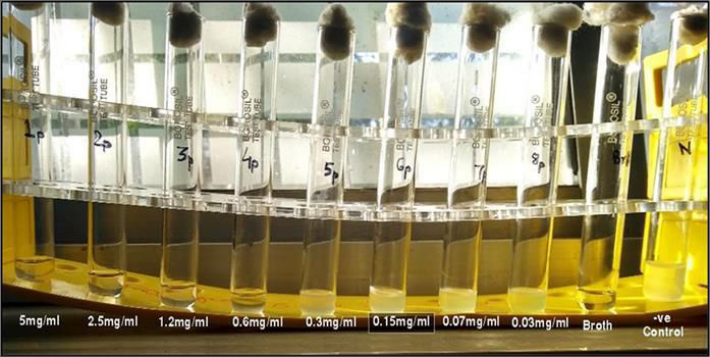 Figure 6
Introduction
In the recent era there is an upsurge of antibacterial resistance against the synthetic antibiotics. Since there are several microorganisms that are directly or indirectly associated with human infections and diseases. This has led the researchers to procure natural biopolymer with antibacterial efficacy. Some common bacterial diseases are pathogenicity caused by E. coli such as, intestinal E. coli pathotypes and Shiga toxin producing E. coli may induce a watery diarrhea leading to dehydration. Extraintestinal E. coli which are pathogenic cause diseases such as urinary tract infection, neonatal meningitis, sepsis and infections in other body parts [1] . Another common gram-negative bacteria is Pseudomonas aeruginosa. Clinically, the primary risk of pathogenicity caused by P. aeruginosa is for patients with compromised immune systems including those with Cystic Fibrosis (CF), cancer, AIDS, indwelling medical devices, burn and eye injuries and non-healing diabetic wounds. The synthetic antibiotics effectively control the bacterial growth but at the same time can have side effects on its administration. Thus, from the past few years studies about antibiotic materials have been focussed on natural materials such as chitosan. Chitosan, is a derivative of chitin, most abundantly found biopolymer polysaccharide found in crustacean's shell. Chitosan is a copolymer composed of glucosamine and N-acetyl-glucosamine linked through β 1-4 glycosidic bonds and obtained by deacetylation of chitin. (Fig. 1) [2] reported that Adi tribe from Arunachal Pradesh give Penaeus indicus is in old age and diabetic people. For curing several diseases like cold, cough, genito-urinary disorder, renal disorders and body weakness [3] , prawns like Penaeus monodon are being used.
Objective of the research
The present research investigation includes preparation of chitosan, structural characterization and degree of deacetylation of chitosan using FTIR spectroscopy and determine minimum inhibitory concentration of chitosan at different concentration extracted from freshwater prawn, Macrobrachium dayanum against gram negative bacteria, E. coli (ATCC 8739) and P. aeruginosa (ATCC 10145).
Materials and Methods
Materials and Methods
Preparation of Chitosan from crustacean shells
The prawns were collected from the local market in Jharkhand. The shells were removed from the flesh and washed thoroughly with water then the shells were dried and crushed using mortar and pestle. Chitosan was extracted by demineralization, deproteinization and deacetylation [4,5] . Extracted chitosan was dissolved in 0.2% acetic acid for antibacterial assay.
Antibacterial Assay
Bacterial strains namely Escherichia coli (ATCC 8739) and Pseudomonas aeruginosa (ATCC 10145) were obtained from Yugantar Bharti Analytical and Environmental Engineering Laboratory, Sidroul, Namkom, Ranchi (Jharkhand) were maintained at 4 ºC on Nutrient agar media. Each of the microorganisms were freshly cultured before the susceptibility testing by transferring them into a separate sterile test tube containing nutrient broth and then it was incubated overnight at 37 ºC. A microbial loop was used to remove a colony of each bacterium from pure culture and transfer it into nutrient broth.
Preparation of inoculum: Each organism was recovered for testing by sub culturing on fresh media. A loopful inoculum of each test bacterium was taken and suspended in 2 ml of Nutrient Broth and Luria-Bertani Broth for 4 hrs at 37 ºC. Antibacterial assay by Minimum Inhibitory concentration method: Minimum Inhibitory concentration assay was carried out by using Serialdilution Method [6] . The culture was emulsified in normal saline and turbidity was matched with 0.5 McFarland Standard. The inoculums were prepared to obtain approximately 150 million/ml bacterial concentration. Prior to the gradation of chitosan solution, 1.2 mg of antibiotic, Ciprofloxacin was dissolved in 250 ml of distilled water to obtain concentration of 5µg/ml of Ciprofloxacin, used here as positive control. In this method, 10 test tubes were prepared by dispensing 1ml of chitosan solution with the highest concentrations into first test tube. Then, the two-fold serial dilutions of chitosan solutions were made by drawing up 1ml of chitosan solution in first test tube into second test tube and then move on to next test tube to achieve various concentrations, 5, 2.5, 1.2, 0.6,0.3, 0.15, 0.07, 0.03 mg/ml, each containing 1ml of nutrient broth. 50 µl of each bacterial suspension were inoculated into each test tubes. The last two test tubes were positive and negative controls, respectively. The positive control was inoculated with bacterial suspension only, while the negative was left blank without inoculation. In addition, 1ml of Ciprofloxacin (5 µg/ml) was transferred into sterile test tube as, Antibiotic control, containing 1ml of nutrient broth, inoculated with bacterial suspension for 24 hours. The tubes were then studied for visible signs of growth or turbidity, by recording OD values under UV spectrophotometer at 600 nm, after the period of incubation. The lowest concentration that inhibited the growth of bacterial was considered as the (MIC) Minimum Inhibitory Concentration.
Calculation of Concentration
Percentage of Inhibition = 100 -% of Growth Statistical Analysis of collected Data: Results were expressed as mean ±SD. The recorded data was subjected to statistical analysis by using student's t -test to determine the level of significance.
Results
Table Table-4 showed result of Minimum Inhibitory Concentration (mg/ml) of chitosan of prawn's shell by two fold serial dilution method. Minimum Inhibitory Concentration (MIC) is defined as the lowest concentration of an antimicrobial agent that is bacteriostatic (prevents the visible growth of bacteria). In the present study, MIC was used to evaluate the antimicrobial efficacy of chitosan by measuring the effect of decreasing concentrations of chitosan over a defined period in terms of inhibition of bacterial population growth.
In case of E. coli, (ATCC 8739) different concentrations of chitosan (0.03 mg/ml to 5 mg/ml) from M. dayanum were inoculated with cultured bacteria and results were measured using two-fold serial dilution method to determine at what level the MIC endpoint was established (Fig. -3). At chitosan concentration of 0.15 mg/ml, % of bacterial growth was 75.86% and% of minimum bacterial growth inhibition was 24.14%. The lowest concentration of chitosan that inhibited the visible growth of E. coli (ATCC 8739) was 0.15 mg/ml and was recorded as MIC value of chitosan extracted from M. dayanum. At chitosan concentration of 0.07 mg/ml, % of bacterial growth was 239.66% and% of bacterial growth inhibition was a negative value of -139.66%. Chitosan concentration at 0.15 mg/ml, 0.3 mg/ml, 0.6 mg/ml,1.2 mg/ml, 2.5 mg/ml, 5 mg/ml gave a decreasing pattern of absorbance values which showed the fact that there was decrease in bacterial growth activity and increase in bacteriostatic activity due to rise in the concentration of the chitosan (Fig. -5).
In case of P. aeruginosa (ATCC 10145), different concentrations of chitosan (0.03 mg/ml to 5 mg/ml) of M. dayanum were inoculated with cultured bacteria and results were measured using two fold serial dilution method to determine at what level the MIC endpoint was established. (Fig. -4). At chitosan concentration of 0.15 mg/ml,% of bacterial growth was 95.68% and% of minimum bacterial growth inhibition was 4.32%. The lowest concentration of chitosan that inhibited the visible growth of P. aeruginosa (ATCC 10145) was 0.15 mg/ml and was recorded as MIC value of chitosan extracted from M. dayanum. At chitosan concentration of 0.07 mg/ml,% of bacterial growth was 126.62% and% of bacterial growth inhibition was a negative value of -26.62%. Chitosan concentration at 0.15 mg/ml, 0.3 mg/ml, 0.6 mg/ml, 1.2 mg/ml, 2.5 mg/ml, 5 mg/ml gave a decreasing pattern of absorbance values which showed the fact that there was decrease in bacterial growth activity and increase in bacteriostatic activity due to rise in the concentration of the chitosan. (Fig. -6).
Discussion
In the process of extraction of chitosan from M. dayanum shells, 30 g of shell powder was demineralized. Average weight of demineralized powder, chitin and chitosan obtained was 10.34±0.96 g, 4.03±0.42g and 3.49±0.32 g respectively (Table -2). Krithiga et.al. (2014) [7] made study on extraction, characterization as well as antibacterial activity of chitosan from shrimp exoskeleton collected from local market of Madhurai, Tamil Nadu. They reported that from 30 g of shell powder, chitin and chitosan obtained was 15 g and 6.00 g respectively. On comparing with the present study, yield of chitin and chitosan was higher from M. dayanum shells. In the present study Degree of deacetylation of prawn, M. dayanum (79.37±0.58%) is similar with the work of Hossain & Iqbal (2014) [8] who reported 79.57% of degree of deacetylation. Benhabiles et al. (2013) [9] also reported that the degree of deacetylation of chitosan was 79% extracted from shrimp shell, Parapenaeus longirostris. Deacetylation degree of extracted chitosan was analysed via absorption peaks of FTIR while FTIR analysis also confirms the structure of the prepared chitosan. The chitosan sample of Macrobrachium dayanum showed the absorption bands for free amino group between 1033.85 and 1253.73 cm -1 . These absorption bands obtained in this study were similar to previous report by Hongpattarakere et al.
(2008) [10] with bands between 1026.33 and 1259.94 cm -1 in Penaeus monodon. The presence of primary alcoholic group peak was found in Macrobrachium dayanum chitosan at 1373.32 cm -1 (Fig. -2) was close to the absorption peak found in chitosan of Penaeus monodon chitosan reported by Hongpattarakere et al. (2008) [10] . Yuan et al. (2020) [17] studied on antibacterial efficacy of chitosan from white shrimp and giant river prawn and reported MIC value of 0.125 mg/ml and 0.0625 mg/ml respectively. In the present study MIC value of chitosan extracted from M. dayanum (0.15 mg/ml) had similar MIC value with chitosan from white shrimp but higher MIC value or lower antibacterial efficacy than chitosan from giant river prawn. Sugiyanti et al. (2018) [12] made study on minimum inhibitory concentration percentage of chitosan and LWCS (Low Molecular Weight Chitosan) extracted from shrimp shell waste against E. coli. They showed MIC of 0.16 mg/ml in both LWCS and chitosan which was similar to the MIC value (0.15 mg/ml) of M. dayanum chitosan. Sugiyanti et al. (2018) [12] study on biological activity of native and Low molecular weight chitosan obtained by steam explosion process. He reported MIC of shrimp chitosan was 2.5 mg/ml and MIC of Low Molecular Weight Chitosan (LMWC) was 0.16 mg/ml against P. aeruginosa. The above result corroborates with the study of present observation where MIC of M. dayanum chitosan was 0.15 mg/ml against P. aeruginosa indicating similar antibacterial efficacy with the Low molecular weight shrimp chitosan. The present results is in agreement with the findings of Prabhu & Natarajan (2012) [13] where chitosan exhibited concentration dependent antibacterial activity. A lower MIC value shows that less chitosan was required for inhibiting growth or for bacteriostatic effect on the bacterial strains. Bacteriostatic effect of chitosan can be defined as the effect which prevents bacterial growth and reproduction but does not certainly kill them. Chitosan treatment inhibited growth of bacteria by downregulating the genes which participate in growth and metabolism. It also decreases synthesis of amino acid, nucleotide, protein, carbohydrate, RNA and lipid [14] . Moreover, studies on genetic profiles have reported that chitosan lessens the consumption of oxygen and preferred anaerobic respiration [14] . A similar result was observed in bacteria, Bacillus cereus when treated with chitosan, inhibited nitrogen, amino acid and gluconeogenesis metabolism [15] .
Conclusion
• M. dayanum shells can be used as a promising naturally occurring substrate for the chitosan production using the standard methods • 0.2% acetic acid used as a solvent in the present study proves to be a suitable solvent as it showed no inhibitory effect but acts as a good medium for dissolution of chitosan to give an effective antibacterial activity of chitosan.
• From the present study it can be concluded that chitosan has concentration dependent antibacterial activity against human pathogenic bacteria strains which indicates their possible use as potent antibacterial agent.
• The higher degree of deacetylation of chitosan extracted from M. dayanum, showed higher antimicrobial activity against bacterial strains due to the electrostatic interaction between positively charged protonated amino NH 3+ groups of chitosan and negatively charged cell wall of bacteria.
• The modes of antimicrobial action of chitosan can be due to disruption of cell membrane /cell wall of microbe, interaction with microbial DNA and chelation of metal and nutrients by chitosan in gram negative bacteria, E. coli and P. aeruginosa [16] .
Figures and tables from the paper
| Batch | Weight of Dry shell powder | Weight of Demineralized powder | Weight of chitin | Weight of Chitosan | Weight of Chitosan from shell powder | Weight of chitosan from chitin |
|---|---|---|---|---|---|---|
| (g) | (g) | (g) | (g) | (%) | (%) | |
| 1 | 30 | 11.70 | 4.69 | 4.00 | 13.33 | 85.28 |
| 2 | 30 | 9.37 | 3.74 | 3.27 | 10.9 | 87.43 |
| 3 | 30 | 10.42 | 4.00 | 3.45 | 11.5 | 86.25 |
| 4 | 30 | 11.55 | 4.54 | 3.85 | 12.83 | 84.80 |
| 5 | 30 | 11.62 | 4.61 | 3.92 | 13 | 85.03 |
| 6 | 30 | 9.15 | 3.52 | 3.05 | 10.16 | 87.14 |
Table text extracted from the original PDF; superscript letters are shown inline. The original table image is below.
View original table image
| S.N. | Vibration mode | Standard chitosan | Chitosan from M. dayanum |
|---|---|---|---|
| (cm-1) | (cm-1) | ||
| 1. | NH out of plane bending | 752 | - |
| 2. | Ring stretching | 896 | 898 |
| 3. | CO stretching | 1026 | 1033 |
| 4. | CH2 bending and CH3 deformation | 1418 | 1419 |
| 5. | Amide II band | 1563 | 1554 |
| 6. | Amide I band | 1661 | 1651 |
| 7. | CH stretching | 2878 | 2881 |
| 8. | Symmetric CH3 stretching &asymmetric CH2stretching | 2930 | - |
| 9. | NH stretching | 3268 | 3263 |
Table text extracted from the original PDF; superscript letters are shown inline. The original table image is below.
View original table image
| Chitosan Sample | Degree of deacetylation | Average Degree of deacetylation±SD |
|---|---|---|
| (%) | (%) | |
| 1 | 79.04 | 79.37±0.058 |
| 2 | 79.02 | |
| 3 | 80.05 |
Table text extracted from the original PDF; superscript letters are shown inline. The original table image is below.
View original table image
| Pathogens | Concentration | O.D @600nm | % of growth | % of inhibition | MIC value |
|---|---|---|---|---|---|
| Escherichia coli (ATCC 8739) | Control | 0.058±0.001 | 0.15 mg/ml | ||
| 0.03 mg/ml | 0.153±0.0006 | 263.80 | -163.8 | ||
| 0.07 mg/ml | 0.139±0.0001 | 269.66 | -139.66 | ||
| 0.15 mg/ml | 0.044±0.001 | 75.86 | 24.14 | ||
| 0.3 mg/ml | 0.025±0.001 | 43.10 | 56.90 | ||
| 0.6 mg/ml | 0.011±0.001 | 18.97 | 81.03 | ||
| 1.2 mg/ml | 0.004±0.0006 | 6.89 | 93.11 | ||
| 2.5 mg/ml | 0.003±0.0006 | 5.17 | 94.83 | ||
| 5 mg/ml | 0.002±0.001 | 3.45 | 96.55 | ||
| Pseudomonas aeruginosa (ATCC 10145). | Control | 0.139±0.0003 | 0.15 mg/ml | ||
| 0.03 mg/ml | 0.184±0.0006 | 132.37 | -32.37 | ||
| 0.07 mg/ml | 0.176±0.0006 | 126.62 | -26.62 | ||
| 0.15 mg/ml | 0.133±0.001 | 95.68 | 4.32 | ||
| 0.3 mg/ml | 0.120±0.01 | 86.33 | 13.67 | ||
| 0.6 mg/ml | 0.105±0.0003 | 75.53 | 24.47 | ||
| 1.2 mg/ml | 0.038±0.001 | 27.34 | 72.66 | ||
| 2.5 mg/ml | 0.033±0.0006 | 23.75 | 76.25 | ||
| 5 mg/ml | 0.022±0.001 | 15.82 | 84.18 |
Table text extracted from the original PDF; superscript letters are shown inline. The original table image is below.
View original table image
| S. N. | Bacterial strains | Minimum inhibitory Concentration (mg/ml) |
|---|---|---|
| Chitosan of M. dayanum | ||
| 1. | Escherichia coli (ATCC 8739) | 0.15*** |
| 2. | Pseudomonas aeruginosa (ATCC 10145) | 0.15 |
Table text extracted from the original PDF; superscript letters are shown inline. The original table image is below.
View original table image
References
14 in the original paper- Chinlampianga M, Singh RK, Shukla AC. Ethnozoological diversity of Northeast India: Empirical learning with traditional knowledge holders of Mizoram and Arunachal Pradesh. Indian Journal of Traditional Knowledge. 2013;12(1):18-30.
- Mazumder SC, Dey A. Studies on some ethnomedicinal crustaceans, fishes, reptiles, birds and mammals in relation to their usage as drugs among the tribals of Sundarbans, West Bengal, India. Rec. Zool. Surv. India, Occ. Paper No. 274. 2007:1-51.
- Pradeep P, Suneetha V. Minimum Inhibitory Concentration (MIC) of various synthetic and natural antimicrobial agents using E. coli screened from VII sewage treatments plant. International Journal of Chem. Tech Research. 2015;8(11):287-291.
- Krithiga N, Rajalakshmi A, Jayachitra A. Extraction, Characterisation and Antibacterial activity of chitosan from shrimp exoskeleton. International Research Journal of Humanities, Engineering and Pharmaceutical Science. 2014;02(8):56-63.
- Hossain MS, Iqbal A. Production and characterization of chitosan from shrimp waste. Journal of the Bangladesh Agricultural University. 2014;12(1):153160.
- Benhabiles MS, Drouiche N, Lounici H, Pauss A, Mameri N. Effect of shrimp chitosan coatings as affected by chitosan extraction processes on postharvest quality of strawberry. Journal of Food Measurement and Characterization. 2013;7(4):215-221.
- Hongpattarakere T, Riyaphan O. Effect of deacetylation conditions on antimicrobial activity of chitosans prepared from carapace of black tiger shrimp (Penaeus monodon). Songklanakarin Journal of Science and Technology. 2008;30(1):1-9.
- Gangbé L, Dessouassi E, Houndonougbo PK, Brahim AA, Djimènou D, Agadjihouedé H, et al. Trophic regime of the giant freshwater shrimp Macrobrachium vollenhoveni (Herklots, 1857) in the lower Oueme valley in Southern Benin. Int. J Biol. Sci. 2022;4(1):3745. DOI: 10.33545/26649926.2022.v4.i1a.52
- Sugiyanti D, Darmadji P, Santoso U, Pranoto Y, Anwar C, Anggrahini S. Biological Activity of Native and Low Molecular Weight Chitosan obtained by Steam Explosion Process. Pakistan Journal of Biological Sciences: PJBS. 2018;21(9):441-447.
- Prabu K, Natarajan E. In vitro antimicrobial and antioxidant activity of chitosan isolated from Podophthalmus vigil. Journal of Applied Pharmaceutical Science. 2012;2(9):75.
- Raafat D, Von Bargen K, Haas A, Sahl H-G. Insights into the mode of action of chitosan as an antibacterial compound. Appl Environ Microbiol. 2008;74:37643773.
- Mellegard H, From C, Christensen BE, Granum PE. Inhibition of Bacillus cereus spore outgrowth and multiplication by chitosan. International Journal of Food Microbiology. 2011;149(3):218-225. https://doi.org/10.1016/j.ijfoodmicro.2011.06.013.
- Goy RC, De Britto D, Odilio BG. A review of the antimicrobial activity of chitosan polímeros: ciência e tecnologia. 2009;19(3):241-247.
- Yuan Y, Chen L, Shi W, Wang Z, Zhang H. Insight into physicochemical, rheological, and antibacterial properties of chitosan extracted from Antarctic krill: A comparative study. Molecules. 2020;25(18):4074.