
Research article · 2024 · Full text
International Journal of Research in AgronomyYield estimation of winter rice using sentinel-1 SAR data
Volume 7(1S) · Pages 189–195 · DOI: 10.33545/2618060x.2024.v7.i1sc.281 ↗
Research areasRice Cultivation and Yield ImprovementSynthetic Aperture Radar (SAR) Applications and Techniques
Abstract
Author-writtenFor food security, accurate mapping of paddy distribution and yield forecasting are vital for rice, a staple food for billions of people worldwide. Remote sensing techniques have proven important for agricultural system management and monitoring during the past thirty years. This study utilized SAR data from Sentinel-1A sensors to map paddy yields in the Ribhoi district of Meghalaya during the 2022 monsoon season. Employing a univariate spectral statistical model, the research predicted/estimated crop yield by leveraging the correlation between backscatter SAR data (VH and VV polarization) and rice yield from different rice fields. VH+VV backscatter exhibited a positive relationship with yield. The robustness of the relationship between rice yield and VH+VV backscatter, the derived equation was used to estimate rice yield for different rice yield as well as to generate the productivity or yield map of Ribhoi district. The yield estimation model was then validated with the observed yield. The observed yield ranges between 800 to 2000 kg/ha, whereas the estimated yield ranges from 655 to 2000 kg/ha. The yield estimation model demonstrated a reasonable level of accuracy, yielding an RMSE of approximately 262 kg/ha, with an R2 of 0.64.
Summary
Source-checkedPlain-language reading of the full paper, prepared with AI and checked against the text. Each point links to the authors' own words.
Why it matters
- Accurate mapping of paddy distribution and yield forecasting are essential for global food security because rice is a staple food for billions of people. View evidence ↗
- Smallholder farmers manage about 85% of the world's farms and face risks from pests, diseases, extreme weather, and market disruptions. View evidence ↗
- In India, rice yields are heavily impacted by monsoon variability, which is further influenced by climate change in the vulnerable tropics. View evidence ↗
The question
- The study aims to demonstrate a methodology for estimating rice yield at the district level using a statistical model based on Synthetic Aperture Radar (SAR) data. View evidence ↗
What they did
- The research was conducted in the Ribhoi district of Meghalaya, covering an area of 2,448 square kilometers. View evidence ↗
- The study used Sentinel-1A SAR data acquired from June to November for the 2021-22 winter rice season. View evidence ↗
- The researchers examined the correlation between rice yield and SAR backscatter intensity values for VH, VV, and combined (VH+VV) polarizations. View evidence ↗
- A regression model was developed using multi-temporal SAR images to predict rice yield based on the backscatter intensity of the different polarizations. View evidence ↗
What they found
- Individual univariate models for VH and VV polarizations performed poorly, showing very low and moderately low R2 values, respectively. View evidence ↗
- A positive relationship was found between the combined VH+VV backscatter and rice yield. View evidence ↗
- The yield estimation model achieved an R2 of 0.64 and a Root Mean Square Error (RMSE) of approximately 262 kg/ha. View evidence ↗
- Observed yields ranged from 800 to 2,000 kg/ha, while the model's estimated yields ranged from 655 to 2,000 kg/ha. View evidence ↗
- The derived regression equation for estimating yield is: Rice yield = 1240.4 * (VH+VV) - 1103.2. View evidence ↗
What it means
- The authors conclude that the univariate spectral statistical model provides a reasonable degree of accuracy for predicting crop yield. View evidence ↗
- The study provides a foundation for improving agricultural decision support systems through estimated yield insights. View evidence ↗
- The authors suggest that the poor correlation in some models may be due to the high heterogeneity of rice varieties grown by farmers, which vary in yield and biomass potential. View evidence ↗
Visual summary
2 visualsIllustrations explain the paper; charts are replotted from the paper's own table values.
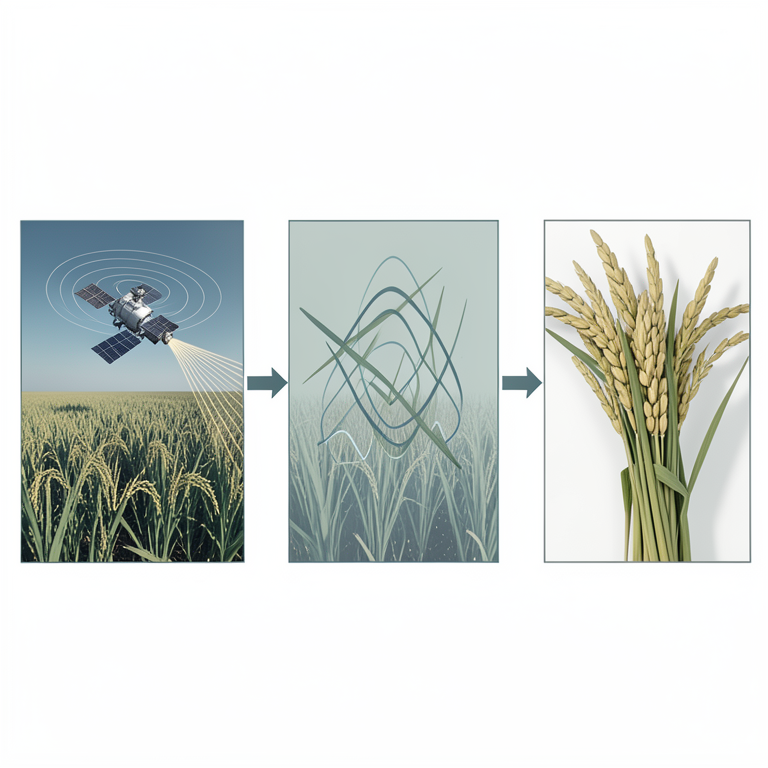
SAR Yield Estimation Workflow
AI-generated conceptual illustration (Winter rice plants and a Sentinel-1 satellite). It explains the idea and does not show study data.
View source evidence ↗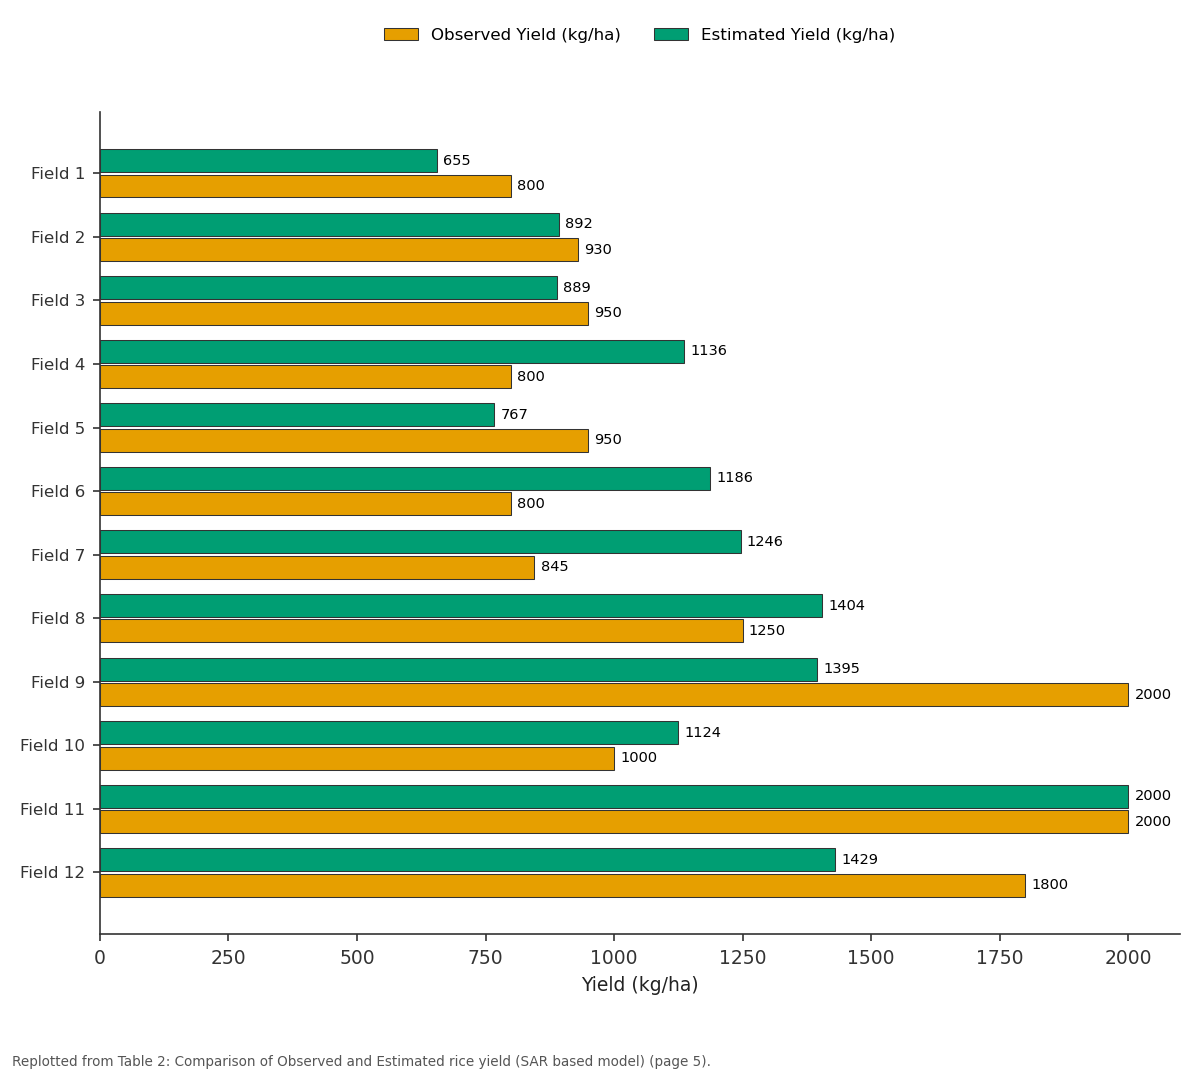
Observed Yield (kg/ha) and Estimated Yield (kg/ha): Field 1 vs Field 2 vs Field 3 vs Field 4 vs Field 5
Replotted from Table 2 (page 5) of the original paper. Every bar is the paper's own table value.
View source evidence ↗Figures & tables
From the original paper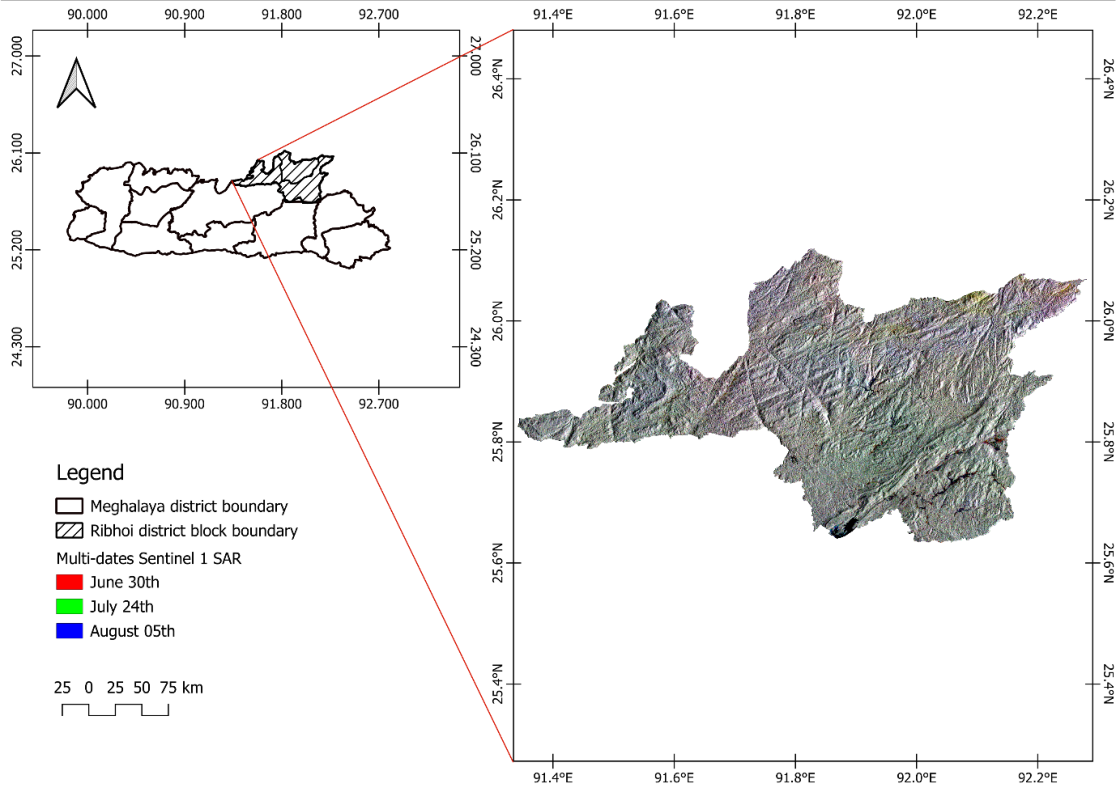 Figure 1
 Table 1
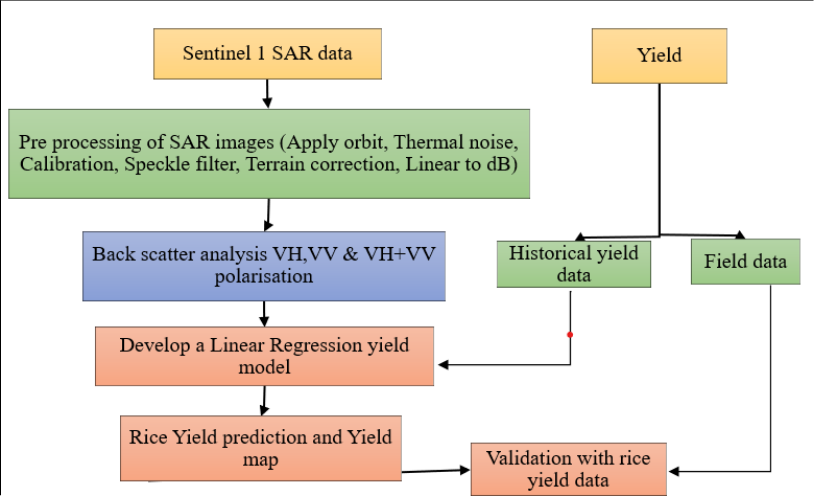 Figure 2
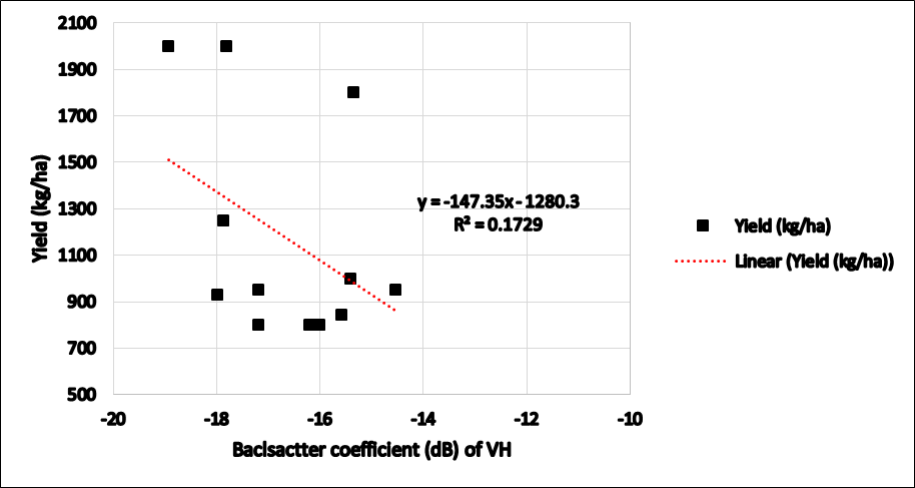 Figure 3
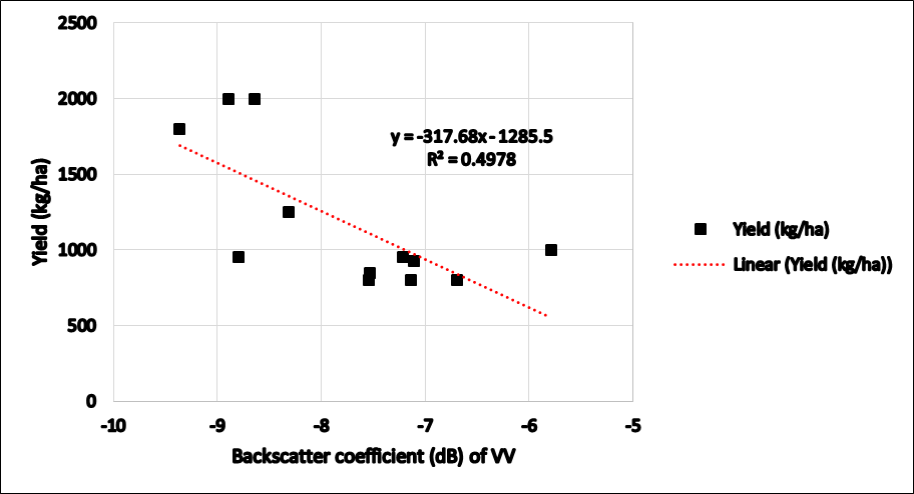 Figure 4
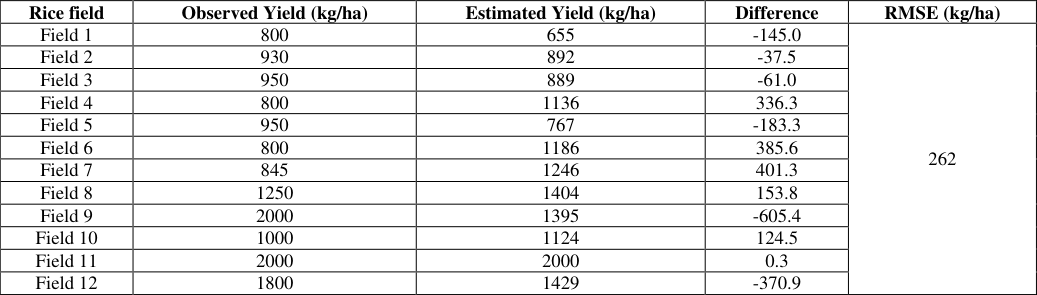 Table 2
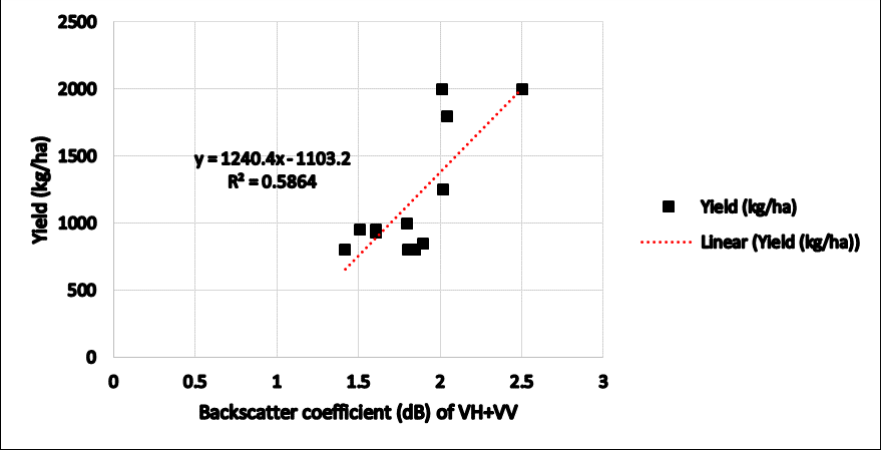 Figure 5
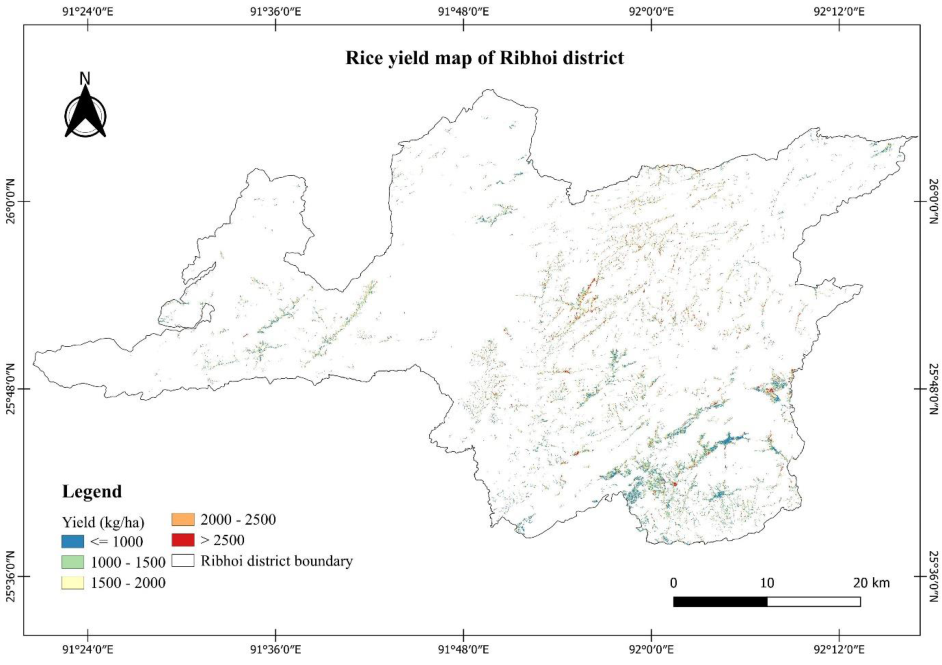 Figure 6
Introduction
Rice cultivation is a crucial element of worldwide farming and contributes significantly to guaranteeing food stability for millions of individuals globally. Rice serves as a key source of nutrition, particularly in Asia, where it is a staple food for a large portion of the population. Approximately 85% of the world's farms are managed by smallholder farmers, confront multiple challenges to their agricultural output due to outbreaks of pests and diseases, extreme weather events, and market disruptions. These factors jeopardize the food and income security of their households (Setiyono et al., 2018; O'Brien et al., 2004) [10,8] . Nevertheless, the rice yield in India is significantly influenced by the variability of the monsoon, which is affected by climate change in the tropics a region considered to be the most vulnerable in the world. (Liu et al., 2022; Gupta et al., 2019) [5,3] . The rice production process encompasses various stages, beginning with land preparation and culminating in harvesting. In the face of climate change, the task of enhancing crop yield to meet the growing demand of the population and adapt to climate variations presents a formidable challenge. Hence, the timely, precise, and dependable prediction of rice yield in India holds significant importance for food security, health concerns, and strategic marketing planning at local, national, and global scales. (Liu et al., 2022; Gupta et al., 2019; Zabel et al., 2021) [5,3,11] . The use of a biophysical modeling approach to provide crop yield data is preferable due to its unbiased and replicable nature. This can be achieved by leveraging remote-sensing data, incorporating rainfall data within a statistical framework (Setiyono et al., 2018; Löw et al., 2017) [10,6] , employing a crop growth model (Lansigan et al., 1993) [4] , or integrating remote-sensing data with a crop growth model (Fang et al., 2008) [2] . The latter method shows greater promise compared to the empirical approach of directly translating remotely sensed vegetation indices into crop yield and production values (Zhang et al., 2016) [12] . This is because the integration approach capitalizes on the synergies between: (i) the strengths of remote-sensing technology in capturing spatial and temporal variations related to agro-practices (such as crop establishment dates) and seasonal crop development (phenology and vegetation status (like leaf area index); and (ii) the strengths of the process-based crop growth model in reliably simulating yield by considering biophysical growth drivers (microclimate, water, and nutrients) once key parameters are appropriately assigned (Maki et al., 2017) [7] . This study showcases a methodology for estimating rice yield at the district level through the use of SAR based statistical model. The performance of this approach is assessed within a particular geographical context, namely the Ribhoi district of Meghalaya through out the growing season of winter rice. For the successful execution of this task, obtaining historical information on spatial variability in yield over a reasonably extended period, such as 10 years, is essential (Carter et al., 2007) [1] .
Materials and Methods
Materials and Methods
Study area
The study area, located in the Ribhoi district of Meghalaya (Fig. 1), covers an area of 2448 sq. km. Situated between E 91°20'30" to E 92°17'00" Longitude and N 25°40' to N 26°20' Latitude, it has a population of 258,840 (as of 2011). The rugged terrain consists of hill ranges sloping northward, merging with the Brahmaputra Valley. The climate varies from tropical to temperate, with hot and humid summers in areas bordering Assam. Average rainfall is 2900 mm annually, and temperatures range from 10 °C to 30 °C in December and January. The soil includes black loamy soil and lime silt, supporting both local and improved crop varieties.
Crop yield data
Information regarding the area, production, and yield of rice in the Ribhoi district was sourced from the Department of the District Statistical Office, Ri-Bhoi. This data was utilized to compare the satellite-derived data with the actual area and yield figures.
Processing of Sentinel-1A SAR data
The pre-processing of Sentinel-1 SAR data was conducted using open-source tools available in the Sentinel Application Platform (SNAP) software. Firstly, satellite positioning errors were corrected by applying the orbit file. Subsequently, calibrated noise profiles were employed to effectively eliminate thermal noise, thus enhancing image quality. The digital pixel values within the SAR images were then accurately converted into radar backscatter intensity (σ0) using SNAP's default radiometric calibration feature. Additionally, a speckle filter using a Lee filter with a 5x5 window was applied to reduce the presence of SAR salt and pepper noise, resulting in clearer and more interpretable images. To rectify topographical disparities and sensor tilt, the SAR images underwent Range Doppler terrain correction utilizing the SRTM DEM product at 1 arcsecond resolution (30 m), this correction ensured precise representation of terrain characteristics within the images. And the final step was converting the backscatter values from a linear scale to a decibel (dB) scale. The pre-processed SAR images was then converted to geotiff format for further analysis using ArcGIS in order to map the spatial dynamics of rice yield in the study area.
Methodology
Rice yield data for each district block was obtained from the District Statistic Office and integrated with GPS locations. Subsequently, this geo-referenced yield information was imported into ArcGIS to generate a point layer. The correlation between the rice yield and Sentinel-1A SAR data, specifically backscatter intensity values in σ 0 VH, σ 0 VV, and (σ 0 VH+σ 0 VV) polarizations, was examined. Scatter plots were constructed to visualize and assess the relationships between yield and backscatter values.
To further analyze these connections, a regression model was established utilizing multi-temporal SAR images, incorporating backscatter intensity values for σ0VH, σ0VV, and (σ 0 VH+σ 0 VV) polarizations. This regression model was then employed to predict rice yield. The derived regression equation, treating yield as the dependent variable and backscatter coefficients as independent variables, was applied to SAR images, resulting in the creation of a yield map for the entire district. This process allowed for the estimation of rice yield across the district based on the backscatter characteristics derived from SAR imagery.
Results and Discussion
The main objective of rice monitoring is to predict rice yield, and the observed yield, obtained from the Department of Statistical Office, was linked to backscatter coefficients of σ 0 VH and σ 0 VV polarizations from Sentinel-1A satellite data. These values were utilized to create a statistical yield model for forecasting rice production. Subsequently, a rice yield map was generated based on the backscatter coefficient and observed yield. This allowed for the calculation of average rice productivity in the Ribhoi district on a pixel-by-pixel basis using the yield map.
Initially, three univariate models were developed, one for each σ 0 VH and σ 0 VV polarization, and the best fit was chosen to predict pixel-wise rice yield in the Ribhoi district. The observed yield from various rice fields was correlated with the backscatter coefficients of σ 0 VH and σ 0 VV polarizations. Scatter plots were created for σ 0 VH and σ 0 VV polarizations against winter rice yield 2021-22. The relationship between backscatter coefficient and rice yield exhibited relatively poor performance, with the coefficient of determination (R2) achieving very low values for σ 0 VH polarization and moderately low for σ 0 VV polarizations, as illustrated in Figures 3 and4.
The lower R2 values could be attributed to the cultivation of different rice varieties by farmers. Varieties grown in farmers' fields have varying potentials for yield, biomass, and harvest index. Consequently, two different rice varieties with similar management practices and equal biomass may yield different results. While remote sensing techniques, whether optical or active, primarily sense the biomass in the field and relate it to crop yield, this assumption works well when a common variety is cultivated over a larger region. However, when there is a high degree of heterogeneity in terms of variety selection, the assumption may fail to achieve desired results. Another potential reason for the poor correlation could be that VV polarization is more sensitive to built-up areas rather than vegetative areas. This discrepancy might explain why the correlation of VV with yield is weaker compared to VH polarization. The scatter plots and coefficients of determination illustrating the relationship between rice yield and SAR scatter coefficients of VV and VH polarized radiation are depicted in Fig. 3 and4, respectively. Considering the robustness of the relationship between rice yield and VH+VV backscatter (Fig. 5), the derived equation (Eq. 1) was used to estimate rice yield for different rice yield as well as to generate the productivity or yield map of Ribhoi district.
Rice yield = 1240.4*(VH+VV) -1103.2
The yield map of the Ribhoi district has been generated using Sentinel-1A based on the backscatter coefficient of VH+VV.
The yield map was prepared using SAR images by taking only the rice area in the district. The comparison of the observed yield and the estimated yield seem to have a good agreement.
From the table 3 we can say that the differences were low in all the field. Estimated yield gives higher yield values as compared to observed yield in all the rice fields except in field 1, field 2, field 3, field 5, field 9 and field 12 where it gives lower yield values than the observed yield. The RMSE derived between observed and predicted yield was 262 kg/ha and R 2 of 0.64 (Table 2). [9] , involved yield prediction using both optical (Sentinel-2B) and SAR (Sentinel-1A) sensor data for mapping paddy acreage in the Sahibganj district, Jharkhand, during the monsoon season in 2017. The study employed a straightforward linear regression yield model, resulting in a predicted paddy yield of 1.60 tonnes/hectare. In a study by Liu et al. (2022) [5] , yield prediction was conducted using the Informer, a transformer-based model, over the Indian Indo-Gangetic Plains. The integration of time-series satellite data, environmental variables, and rice yield records spanning from 2001 to 2016 was employed. The findings revealed that the Informer model exhibited superior performance, achieving an R 2 of 0.81 and an RMSE of 0.41 t/ha.
| Rice field | Observed Yield (kg/ha) | Estimated Yield (kg/ha) | Difference | RMSE (kg/ha) |
|---|---|---|---|---|
| Field 1 | 800 | 655 | -145.0 | 262 |
| Field 2 | 930 | 892 | -37.5 | |
| Field 3 | 950 | 889 | -61.0 | |
| Field 4 | 800 | 1136 | 336.3 | |
| Field 5 | 950 | 767 | -183.3 | |
| Field 6 | 800 | 1186 | 385.6 | |
| Field 7 | 845 | 1246 | 401.3 | |
| Field 8 | 1250 | 1404 | 153.8 | |
| Field 9 | 2000 | 1395 | -605.4 | |
| Field 10 | 1000 | 1124 | 124.5 | |
| Field 11 | 2000 | 2000 | 0.3 | |
| Field 12 | 1800 | 1429 | -370.9 |
Table text extracted from the original PDF; superscript letters are shown inline. The original table image is below.
View original table image
Acknowledgement
AcknowledgementI wish to express my heartfelt appreciation to Professor (Dr.) A. S. Nain, my advisor, and Dr. Jonali, my co-advisor, for their invaluable guidance and steadfast support throughout my academic journey. Additionally, I extend my gratitude to the Department of Remote Sensing & GIS in Agriculture at Northeastern Space Application Centre, Umiam, Meghalaya, the Department of Agrometeorology at G.B. Pant University of Agriculture & Technology, and the Department of Statistical Office, Ribhoi, for providing data and technical assistance. A special thank you goes to the European Space Agency (ESA) for generously providing open-source data from the Sentinel-1A satellite SAR.
Figures and tables from the paper
| S. No. | Acquisition dates | Polarisation | Pass | Modes |
|---|---|---|---|---|
| 1. | 29th July, 2021 | VV & VH | Descending | IW |
| 2. | 20th August, 2021 | VV & VH | Descending | IW |
| 3. | 27th September, 2021 | VV & VH | Descending | IW |
| 4. | 21st October, 2021 | VV & VH | Descending | IW |
| 5. | 14th November, 2021 | VV & VH | Descending | IW |
Table text extracted from the original PDF; superscript letters are shown inline. The original table image is below.
View original table image
References
11 in the original paper- Fang H, Liang S, Hoogenboom G, Teasdale J, Cavigelli M. Corn-yield estimation through assimilation of remotely sensed data into the CSM-CERES-Maize model. Int. J Remote Sens. 2008;29:3011-3032.
- Gupta R, Mishra A. Climate change induced impact and uncertainty of rice yield of agro-ecological zones of India. Agric. Syst. 2019;173:1-11.
- Lansigan F. Evaluating the effects of anticipated climate change on rice production in the Philippines. J Agric. Met. 1993;48:779-782.
- Liu Y, Wang S, Chen J, Chen B, Wang X, Hao D, et al. Rice Yield Prediction and Model Interpretation Based on Satellite and Climatic Indicators Using a Transformer Method. Remote Sens. 2022, 14, 5045. https://doi.org/ 10.3390/rs14195045
- Löw F, Biradar C, Fliemann E, Lamers JPA, Conrad C. Assessing gaps in irrigated agricultural productivity through satellite earth observations-A case study of the Fergana Valley, Central Asia. Int. J Appl. Earth Obs. Geoinf. 2017;57:118-134.
- Maki M, Sekiguchi K, Homma K, Hirooka Y, Oki K. Estimation of rice yield by SIMRIW-RS, a model that integrates remote sensing data into a crop growth model. J Agric. Met. 2017;73:2-8.
- O'Brien K, Leichenko R, Kelkar U, Venema H, Aandahl G, Tompkins H, et al. Mapping vulnerability to multiple stressors: Climate change and globalization in India. Glob. Environ. Chang. 2004;14:303-313.
- Ranjan AK, Parida BR. Paddy acreage mapping and yield prediction using sentinel-based optical and SAR data in Sahibganj district, Jharkhand (India). Spatial Information Research. 2019;27(4):399-410.
- Setiyono, et al. Spatial Rice Yield Estimation Based on MODIS and Sentinel-1 SAR Data and ORYZA Crop Growth Model. Remote Sensing. 2018;10(2):293. https://doi.org/10.3390/rs10020293
- Zabel F, Muller C, Elliott J, Minoli S, Jagermeyr J, Schneider JM, et al. Large potential for crop production adaptation depends on available future varieties. Glob. Chang. Biol. 2021;27:3870-3882.
- Zhang X, Zhang Q. Monitoring interannual variation in global crop yield using long-term AVHRR and MODIS observations. ISPRS J Photogramm. Remote Sens. 2016;114:191-205.
Cited by 1
From OpenAlex, OpenCitations and reference lists read by Scinovex
- Integrating ChloroNet and XAI for accurate SPAD prediction in rice ↗
Mahzabin Abbasi, Wenzhong Shi, Min Zhang · Remote Sensing Applications Society and Environment · 2026
Remote sensing technology in precision agriculture enables extensive monitoring of crop health and environmental conditions. Sentinel-1 SAR imagery is highly effective for vegetation monitoring due to its ability to penetrate cloud cover and function under diverse meteorological circumstances. This research introduces ChloroNet, a novel Artificial neural network (ANN) model that utilizes Sentinel-1 SAR-derived indices and field data to predict rice…
❝ 0PDF