
Research article · 2024 · Full text
International Journal of Research in AgronomyAnalysis of phenophasic development, growth parameters, and physiological efficiency in diverse oat cultivars
Volume 7(2S) · Pages 05–12 · DOI: 10.33545/2618060x.2024.v7.i2sa.285 ↗
Research areasCrop Yield and Soil FertilityGenetics and Plant BreedingWheat and Barley Genetics and Pathology
Abstract
Author-writtenDuring the Rabi season of 2020-21, field experiment was conducted as part of the All India Coordinated Research Project (AICRP) on Fodder Research and Physiology at the College of Agriculture, JNKVV, and Jabalpur (MP) to evaluate 16 oat genotypes using a Randomized Block Design with three replications. This study examines the developmental traits and physiological parameters of various oat genotypes, focusing on how these traits vary between genotypes. The results reveal significant differences in Phenophasic development, with IVTSC-3 displaying more extended periods for boot initiation, flower initiation, 50 per cent flowering, grain development, physiological maturity, and harvestable maturity compared to IVTSC-8, which had the shortest durations. Physiological assessments show that IVTSC-3 has the highest leaf area index, leaf area duration at 60 and 90 days, crop growth rate, and relative growth rate, while IVTSC-8 has the lowest values for all physiological observations. These findings underscore the importance of considering genotype-specific responses in oat growth dynamics, providing vital insights for oat breeding programs and agronomic practices that aim to enhance crop productivity and resilience.
Summary
Source-checkedPlain-language reading of the full paper, prepared with AI and checked against the text. Each point links to the authors' own words.
Why it matters
- Oats are the sixth most important cereal crop in the world. View evidence ↗
- Oats are highly valued for both human consumption and as a source of livestock feed. View evidence ↗
- Selecting superior oat varieties is necessary to meet the nutritional needs of animals and achieve high crop yields. View evidence ↗
The question
- The study aims to analyze the phenophasic development, growth parameters, and physiological efficiency of various oat cultivars. View evidence ↗
What they did
- The experiment evaluated 16 oat genotypes using a Randomized Block Design with three replications during the 2020-21 Rabi season in Jabalpur, India. View evidence ↗
- The study used a seed rate of 100 kg ha⁻¹ and a fertilizer application of 80:40:30 (N: P₂O₅:K₂O) kg ha⁻¹. View evidence ↗
- Dry matter production and leaf area were measured every 15 days until the crops reached maturity. View evidence ↗
What they found
- Genotype IVT SC-3 took the longest to emerge (11.11 days), while IVT SC-8 emerged the fastest (7.27 days). View evidence ↗
- IVT SC-3 had the longest duration for flower initiation (97.36 days) and 50% flowering (99.83 days), whereas IVT SC-8 had the shortest (88.32 and 90.33 days, respectively). View evidence ↗
- IVT SC-3 reached physiological and harvestable maturity the slowest (130.84 and 141.07 days), while IVT SC-8 reached them the fastest (111.15 and 121.38 days). View evidence ↗
- At 120 days, the highest Leaf Area Index (LAI) was found in IVT SC-3 (3.21) and the lowest in IVT SC-8 (2.71). View evidence ↗
- IVT SC-3 showed the maximum Leaf Area Duration (LAD) at 60 and 90 days (15003.00 and 29993.00 cm² days), while IVT SC-8 showed the minimum (10503.00 and 25493.00 cm² days). View evidence ↗
- The highest Net Assimilation Rate (NAR) was recorded for IVT SC-3 (0.461). View evidence ↗
- IVT SC-3 had the highest Specific Leaf Area (0.67) and Specific Leaf Weight (1.94), while IVT SC-8 had the lowest (0.40 and 1.67, respectively). View evidence ↗
What it means
- The authors conclude that early flowering is linked to higher productivity, suggesting that timely phenological management is key to optimizing oat yields. View evidence ↗
- The study highlights that understanding genotype-specific growth responses is vital for improving oat breeding and agronomic practices to increase productivity. View evidence ↗
Visual summary
3 visualsIllustrations explain the paper; charts are replotted from the paper's own table values.
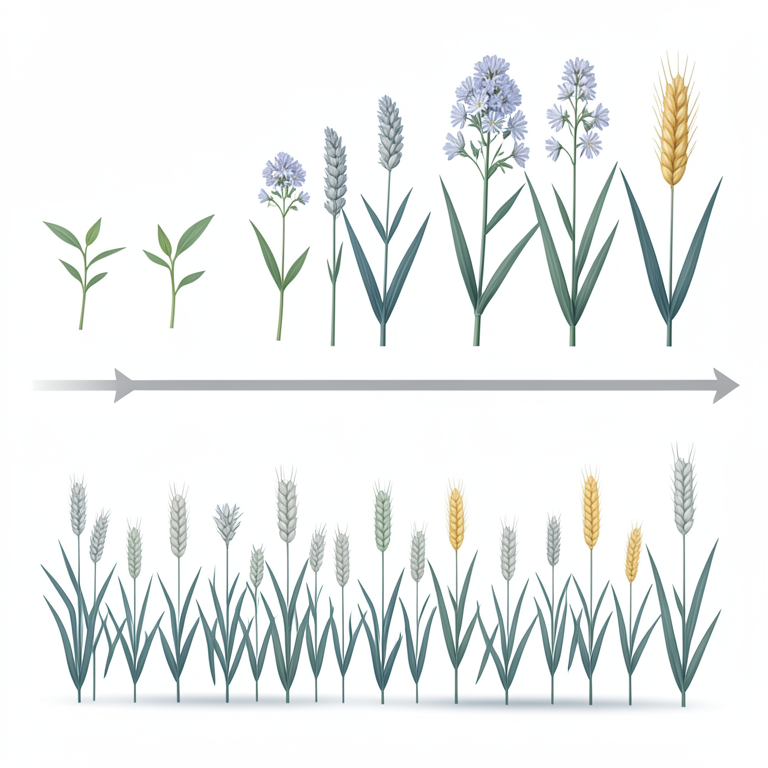
Phenophasic Timeline Comparison
AI-generated conceptual illustration (oat plants (Avena sativa)). It explains the idea and does not show study data.
View source evidence ↗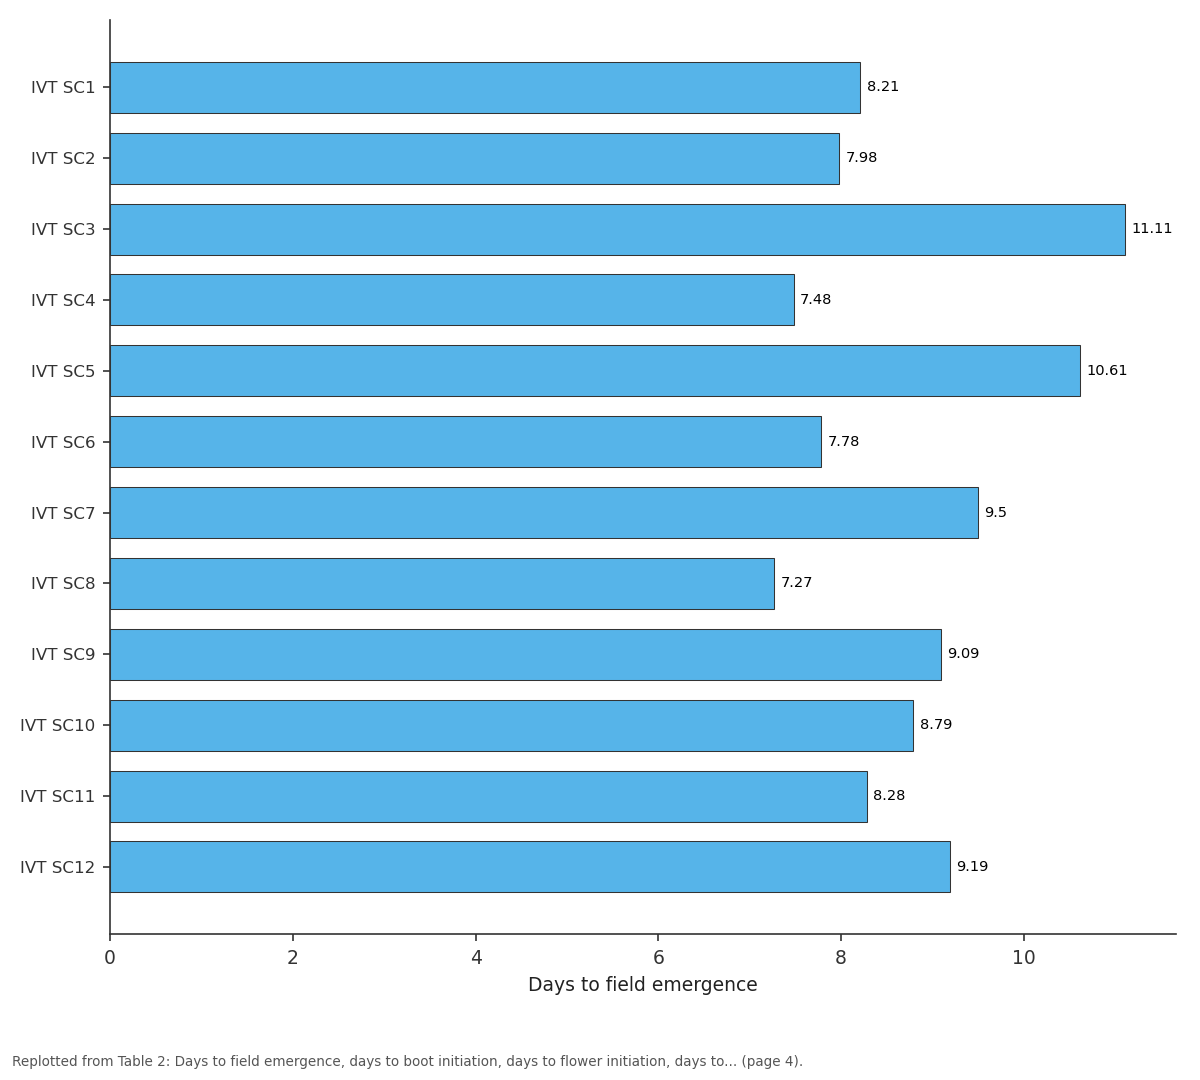
Days to field emergence: IVT SC1 vs IVT SC2 vs IVT SC3 vs IVT SC4 vs IVT SC5
Replotted from Table 2 (page 4) of the original paper. Every bar is the paper's own table value.
View source evidence ↗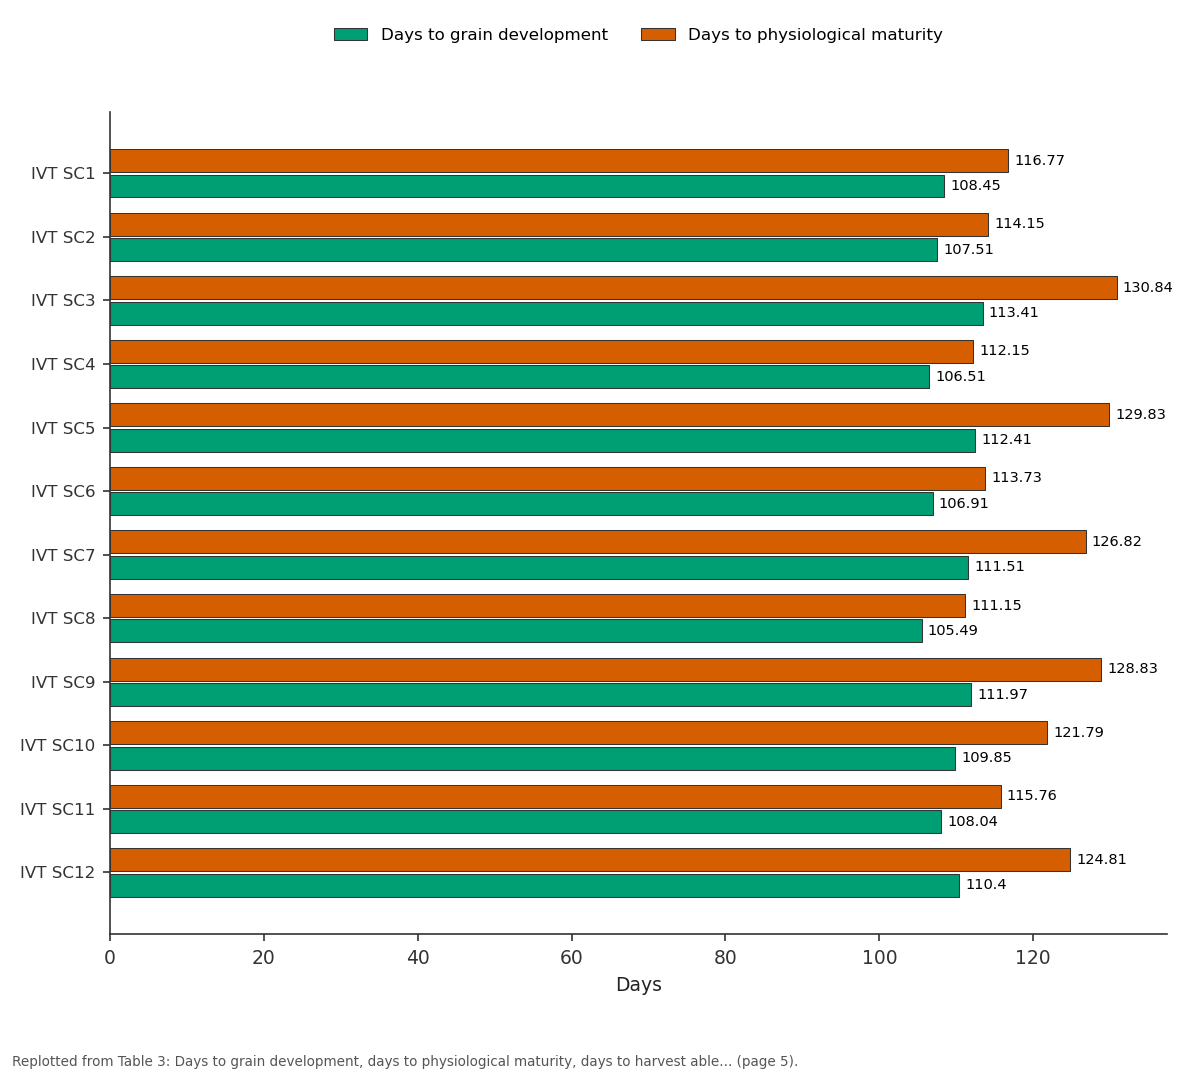
Days to grain development and Days to physiological maturity: IVT SC1 vs IVT SC2 vs IVT SC3 vs IVT SC4 vs IVT SC5
Replotted from Table 3 (page 5) of the original paper. Every bar is the paper's own table value.
View source evidence ↗Figures & tables
From the original paper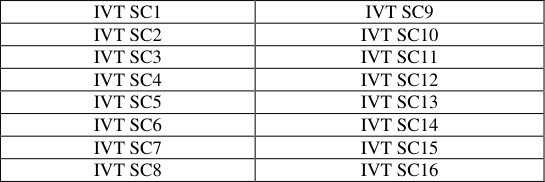 Table 1
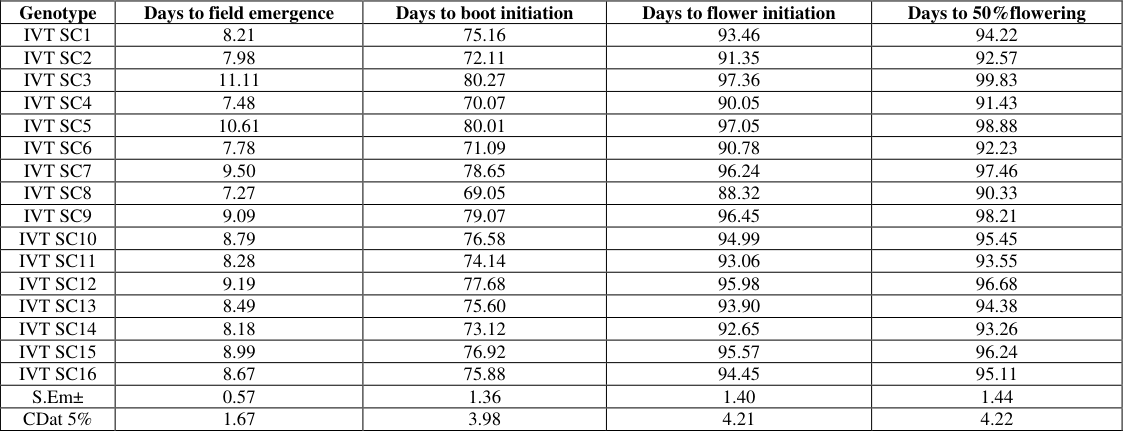 Table 2
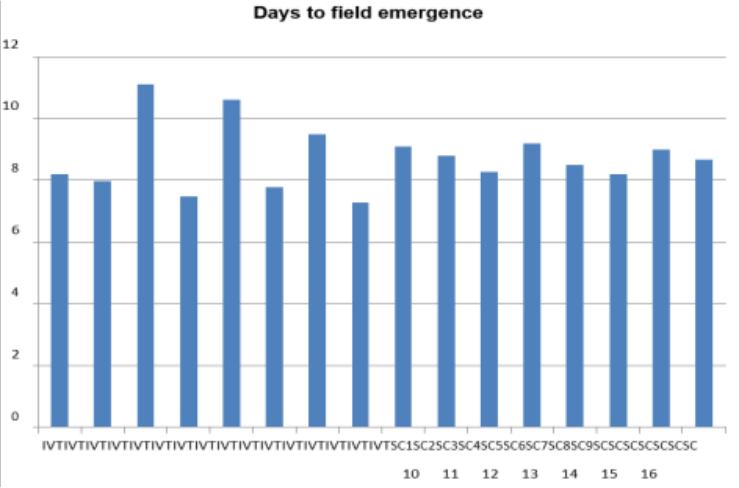 Figure 1
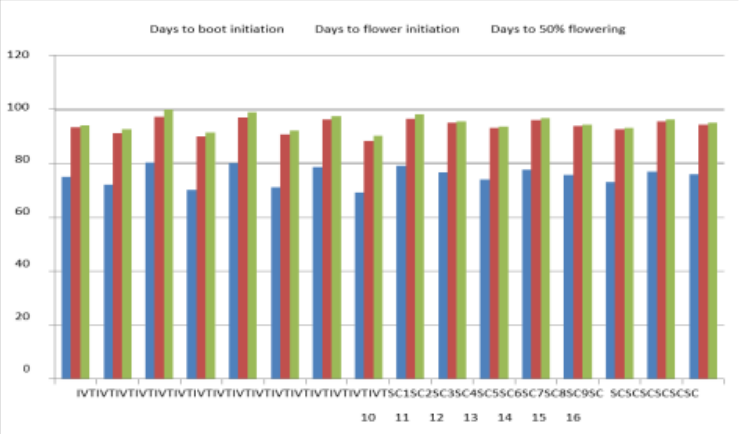 Figure 2
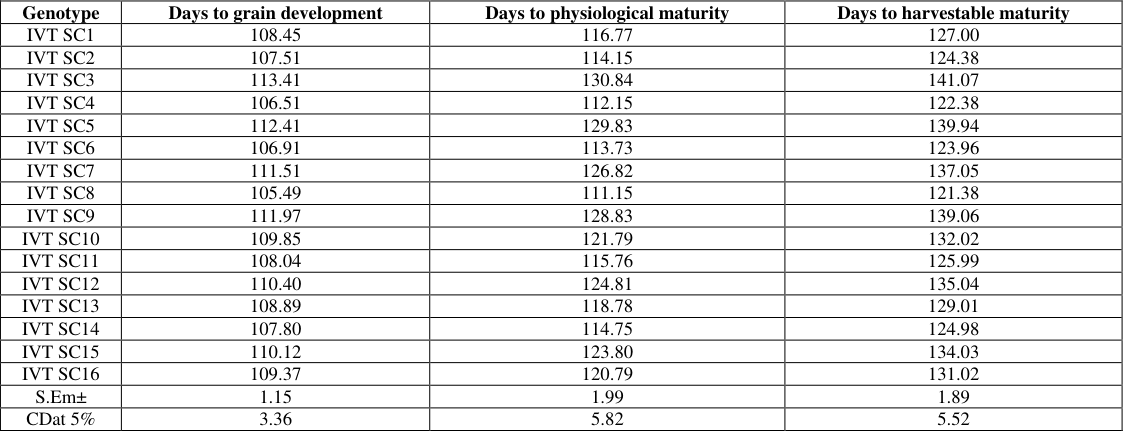 Table 3
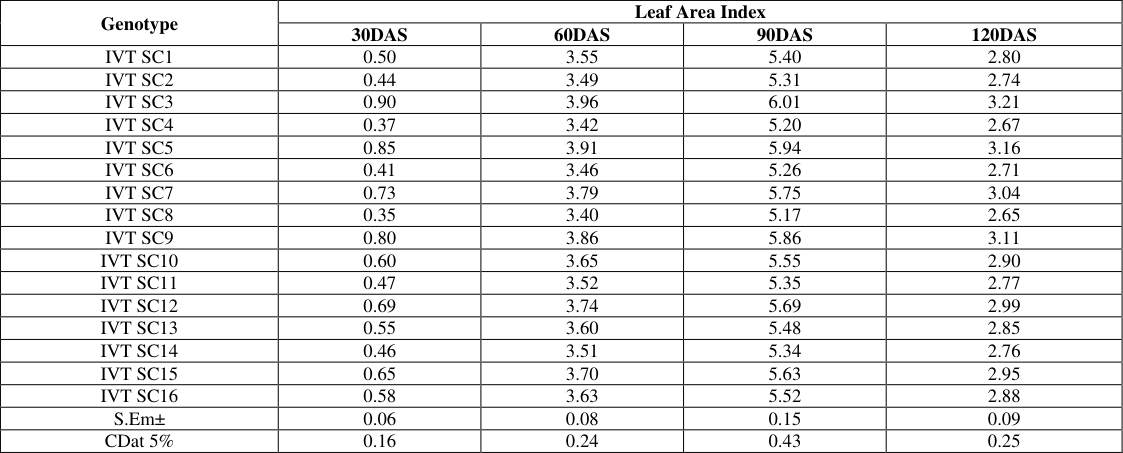 Table 4
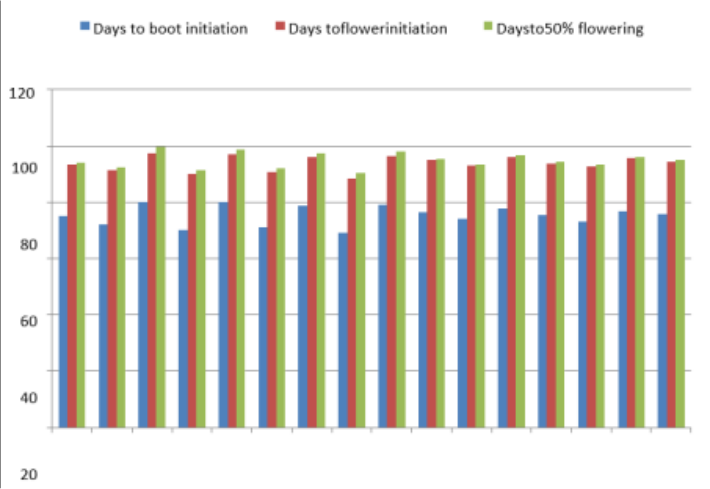 Figure 3
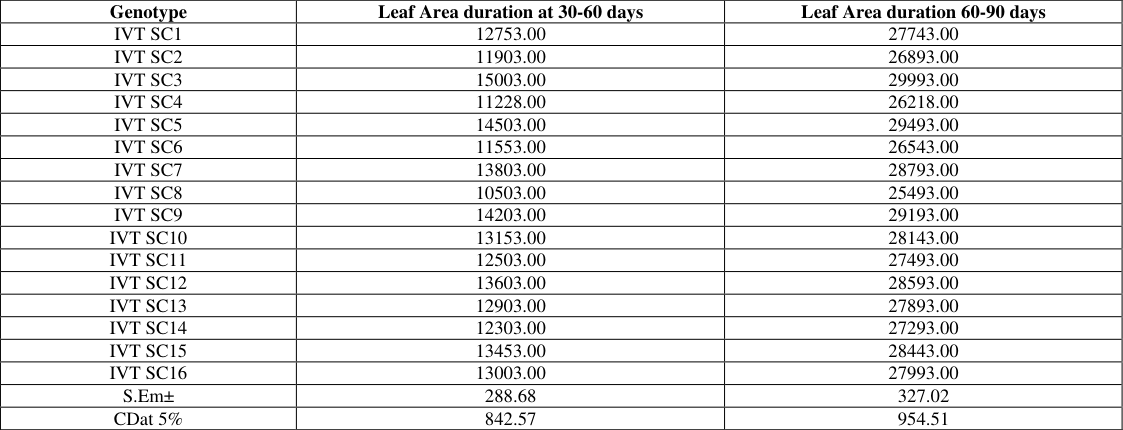 Table 5
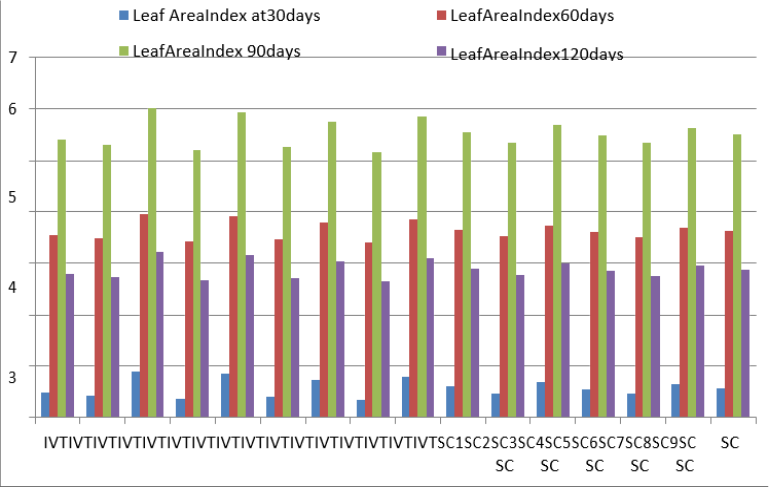 Figure 4
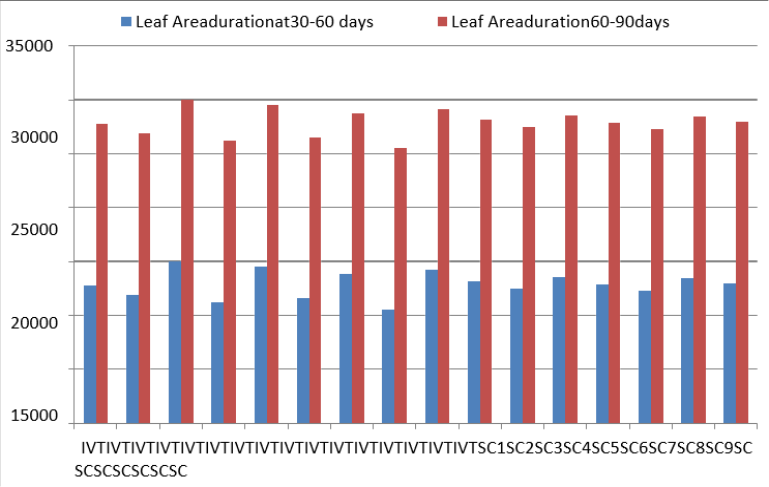 Figure 5
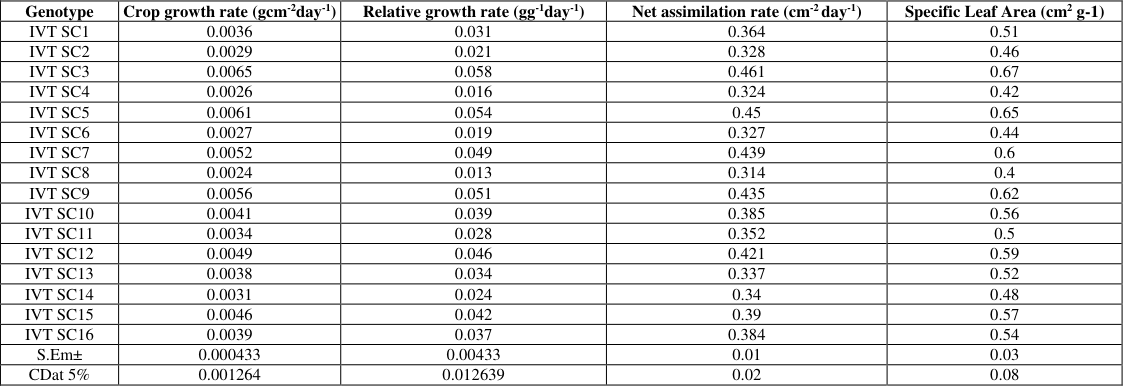 Table 6
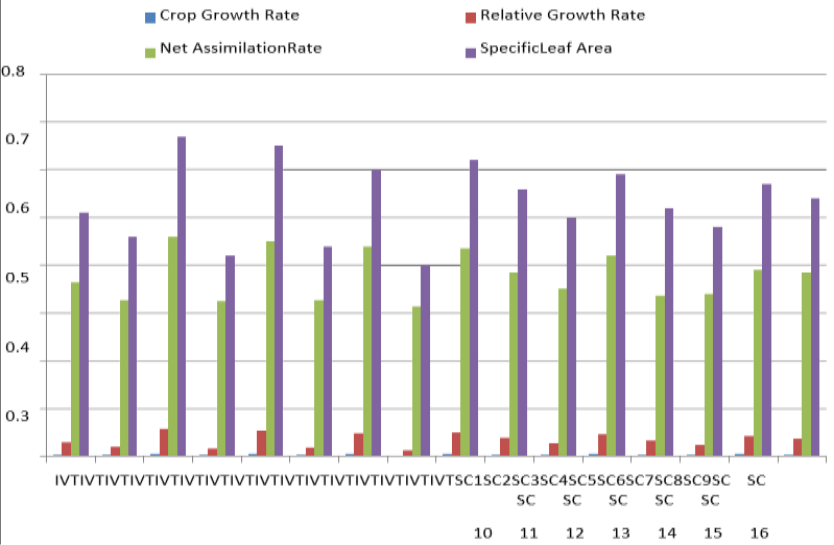 Figure 6
Introduction
Oat (Avena sativa L.), a member of the Poaceae family, stands as the sixth-largest cereal crop globally, trailing wheat, maize, rice, barley, and sorghum [1] . With a 2019 global production of 23 million tonnes, Russia and Canada took the lead, contributing approximately 20% each to the world total, followed by significant producers such as Poland, Finland, Australia, and the United Kingdom. In India, states like Punjab, Haryana, Uttar Pradesh, Madhya Pradesh, Orissa, Bihar, and West Bengal are recognized as critical oat-growing regions. Oats, primarily known for human consumption as oatmeal and rolled oats, are gaining prominence as a superfood due to their rich content of health-promoting substances. Notably, oats are celebrated for their high dietary fiber content, with starch and protein as predominant components, constituting 60% and 11-15%, respectively [6] . While appreciated for human consumption, oats also play a crucial role as livestock feed. Winter-hardy and adaptable as a catch crop, oats are particularly well-suited for cultivation in marginal environments with cool-wet climates and low-fertility soils [6] Commonly used for green fodder, hay, silage, and seed/grain purposes, oats contribute significantly to livestock nutrition, with oat straw being a valuable feed source post-seed production. However, ensuring a steady supply of high-quality oat seeds poses a constraint for farmers, who often harvest crops before seed set, hindering seed production [13] . Meeting the increasing nutritional demands for optimal animal performance necessitates the selection of superior oat varieties and the implementation of effective management practices to achieve high yields and desirable quality characteristics [10] . This research aims to provide valuable insights into diverse oat cultivar's Phenophasic development, growth parameters, and physiological efficiency. The study endeavors to unravel the intricate physiological mechanisms underlying genetic improvements in grain yield, focusing on critical traits such as Leaf Area Index, leaf area duration, crop growth rate, and their significant contributions to grain yield expression. Through a comprehensive analysis, we aim to facilitate the selection of oat varieties optimized for cultivation in varying local agro-climatic conditions, thus addressing the critical need for improved seed yield in oat production.
Materials and Methods
The current study was conducted within the Department of Plant Physiology, and the subsequent field experiment was established as part of the All India Coordinated Research Project (AICRP) on Fodder Research and Physiology at the College of Agriculture, JNKVV, and Jabalpur (MP). Situated within the "Kymore plateau and Satpura hills" agro climatic area of Madhya Pradesh, Jabalpur is positioned at 23.90˚ North latitude, 79.58˚ East longitudes, and at an altitude of 411.78 m above mean sea level. Characterized by a subtropical, semi-arid climate, the region experiences hot and dry summers and cold winters with occasional rainfall. The average annual rainfall ranges between 1200-1400 mm, with nearly 90% occurring from June to September. The soil in the Jabalpur region is identified as vertisol based on U.S. classification standards, featuring medium depth, black colour, clay loam texture, and effective drainage. During the Rabi season of 2020-21, a field experiment was conducted to evaluate 16 oat genotypes using a Randomized Block Design with three replications, The seed rate employed was 100 kg ha⁻¹, and fertilizer doses were applied at 80:40:30 (N: P₂O₅:K₂O) kg ha⁻¹. This systematic layout and application of standardized practices aimed to provide a robust foundation for assessing the performance of oat genotypes in the specified agro-climatic conditions, ensuring reliable and representative results. The observations were recorded on five randomly selected plants from each plant and replication for the following parameters and per plant data was obtained by averaging the values.
B. Physiological observations
Observations were made to study the dry matter production and physiological growth parameters of various oat genotypes. Leaf area and dry matter production were measured at 15-day intervals until maturity. Leaf area (measured in cm²) was determined using a leaf area meter, and the corresponding dry matter production (measured in grams per plant) was recorded. Crop Growth Rate (CGR) is the rate of gain in dry matter production per unit of land over time. It is calculated using the formula by [15] , considering dry weights at two consecutive sampling points (t₁ and t₂). Relative Growth Rate (RGR) is the rate of increase in dry matter per unit of existing dry matter. It was coined by [16] and is calculated as the natural logarithm of the ratio of dry weights at two consecutive intervals (t₁ and t₂).
Leaf Area Duration (LAD) reflects the persistence of leaf area during crop growth. It was computed as the sum of leaf area over two successive intervals (t₁ and t₂). Leaf Area Index (LAI) is the ratio of leaf surface area to ground area. It is calculated as the average leaf area over two consecutive intervals divided by the unit ground area. Net Assimilation Rate (NAR) estimates net photosynthetic carbon assimilation. It was determined by periodically measuring dry weight and leaf area and expressing it as grams of dry weight increase per square centimetre of leaf surface per day. Specific Leaf Area (SLA) is a measure of leaf density and is calculated as the ratio of leaf area to total leaf dry weight. Specific Leaf Weight (SLW) is the reverse of SLA and is determined as the total leaf dry weight ratio to leaf area. Leaf Area Ratio (LAR) indicates the proportion of the plant engaged in photosynthesis. It is calculated as the ratio of leaf area to total plant dry weight. Biomass Duration (BMD) is analogous to LAD and is computed as the area under the time curve for biomass production based on dry matter per plant at successive harvests.
Result and Discussion
Result and Discussion
Phenophasic developments
Days to field emergence: The visual appearance of seedlings through the earth's surface is known as field emergence or germination. In emergence condition, the plumules grow towards the surface of the soil and come out from the soil. The seed will germinate rapidly due to progressive increments in the soil temperature. The significant differences have been noted for days to field emergence. The field emergence varied between 7.27 and 11.11 days based on mean data. The highest number of days to field emergence was observed in oat genotype IVT SC-3 (11.11 days), which was at par with IVT SC-5 (10.61 days), and the lowest number of days was noted in IVT SC-8(7.27 days) [2] . Observed significant variability in forage yield and quality among oat varieties, which correlates with our findings, suggesting that differences in emergence timing could contribute to yield variations.
Days to boot initiation
The initiation of the boot is the first sign of the appearance of upcoming in its reproductive phase due to the swelling of the flag leaf sheath that conceals the developing inflorescence or panicle is known as boot initiation. Significant variations have been noted for days to boot initiation;
based on the mean value, the days to the start of boot initiation varied from 69.05 to 80.27 in the present experiment. The highest days to boot initiation were observed in oat genotype IVT SC-3 (80.27 days), which was at par with IVT SC-5 (80.01 days). The maximum number of days was observed in IVT SC-8 (69.05 days). The boot initiation has been noted after 60 to 65 days from the days the emergence of the field was observed in present investigations [12] . Studied barley found comparable variations in days to maturity, reflecting similar influences of phenological changes due to environmental factors.
Days to flower initiation and days to 50% flowering
Early flowering can be advantageous in oat genotypes since it can increase the time between grain formation and field maturity, ultimately leading to higher crop productivity. At the 50% flowering stage, half of the oat genotypes produce a flower and protrude entirely from the stem. Our investigation found significant variations in days to flower initiation, with oat genotype IVT SC-3 taking the longest (97.36) and IVT SC-8 taking the shortest time (88.32). Similarly, oat genotype IVT SC-3 took the most time to reach 50% flowering (99.83 days), while IVT SC-8 took the least (90.33 days). These results align with [14] and highlight the importance of early flowering for increased oat crop productivity.
Days to grain development
The first visualization of grain development would be beneficial in extending the grain-filling period of oat genotypes, which may enhance crop productivity. Significant variability was observed for days to grain development. The maximum days to grain development were noted in oat genotype IVT SC-3 (113.41 days). At the same time, the minimum days were noted in IVT SC-8 (105.49 days) in the present investigations. Our finding aligns with Singh et al., 1997 that delaying the sowing time of oat crops led to a significant reduction in fodder and grain yield. In collaboration with [4] our findings reinforce the importance of selecting appropriate sowing times to enhance grain yield in oat crops.
Days to physiological maturity and harvestable maturity
The days to physiological maturity are usually considered near 22 to 25% seed moisture. The best quality grain yields higher yields when seed moisture is below 20%, and oat grain should be harvested before the shattering or dropping of grains. The significant variability has been recorded for days to physiological maturity. Moreover, the maximum days to physiological and harvestable maturity were reported in oat genotype IVT SC-3 (130.84 days & 141.07 days). In present investigations, the minimum days were noted in oat genotype IVT SC-8 (111.15 days & 121.38 days). These findings are in collaboration with [5] .
Physiological growth parameters LAI (Leaf Area Index)
Leaf Area Index explain the ratio of leaf surface to the ground area or spacing occupied by the crop. And it is the practical means of trapping solar radiation and converting it into food material and other usable part for plant. The Leaf Area Index rapidly increased with the advancement of crop age and after 120 days it will be decrease constantly. The significant differences have been observed for leaf area index. The maximum LAI 120 days was noted in genotype IVT SC-3 (3.21) which was at par with IVT SC-5 (3.16) and minimum LAI were noted in genotype IVT SC-8 (2.71) respectively in present investigations [5,8] . Observed significant differences in LAI among oat genotypes which align with our results
Leaf area duration is a vital parameter which is determination by the Leaf Area of two consequently growth stages stated as Leaf Area Duration is total amount of leaf area present over a specific period of growth. Leaf Area Index signifies the survival period of assimilatory surface area an essential for photosynthesis to take place. The significant differences have been recorded for Leaf area duration for entire crop growing period and the maximum LAD during 60 days and 90days observed in oat genotype IVT SC-3 (15003.00 cm 2 days) & (29993.00 cm 2 days). Whereas the minimum LAD were observed in genotype IVT SC-8(10503.00 cm 2 days) & (25493.00 cm 2 days) in present investigations [7,8] . Observed intricate relationship between solar radiation, evapotranspiration, and crop growth, especially during early oat development, provide valuable insights that complement our results.
The increment of total dry weight per unit ground area of a crop per unit of time is known as crop growth rate. Crop growth rate is a estimate of the magnification in size and mass of crops over a time period. The significant differences have been observed for Crop growth rate (g cm-2 day -1 ) and the maximum CGR was noted in genotype IVT SC-3 (0.0065) which was at par with IVT SC-5(0.0061). Whereas, the minimum were observed in genotype IVTSC-8 (0.0024) in present investigations [2,11] . Collaborate with our findings on leaf area index, leaf area duration, and crop growth rates in oat genotypes.
The increase of total dry matter of plant per unit plant material per unit time per unit is known as relative growth rate. It is generally higher in early vegetative growth phases and decline with increasing in crop age. The significant variations was observed for relative growth rate (g g -1 day -1 ) and the maximum RGR was observedinoatgenotypeIVTSC-3(0.058). Whereas the minimum relative growth rate were observed in genotype IVTSC-8 (0.013) in present investigations
Net assimilation rate
The significant variability was noted in present investigations for Net Assimilation Rate (NAR). And the highest net assimilation rate was noted ingenotypeIVTSC-3 (0.461) which was at par with IVTSC-8 (0.314) respectively [2] . Investigated the impact of bio-fertilizers on physiological parameters and yield in oat varieties, providing insights that align with our own results.
Specific Leaf Area & Specific Leaf weight
The data found significant variability with respect to specific leaf area &specific leaf weight in present investigations on oat genotypes and the highestSLAwasobservedingenotypeIVTSC-3(0.67) and highest SLW was observed In IVT SC-3 (1.94). Whereas, the lowest were observed in genotypeIVTSC-8(0.40) & (1.67) respectively [11] . Similar results reported in their study.
Leaf Area Ratio & Biomass Duration
The data found significant differences with respect to Leaf Area Ratio &Biomass Duration in present investigations on oat genotypes and the highest LAR was observed in genotype IVT SC-3 (0.28) and highest Biomass Duration was observed In IVT SC-3 (17208.00). Whereas, the lowest was observed ingenotypeIVTSC-8 (0.14) & (13049.00) respectively.
Figures and tables from the paper
| IVT SC1 | IVT SC9 |
|---|---|
| IVT SC2 | IVT SC10 |
| IVT SC3 | IVT SC11 |
| IVT SC4 | IVT SC12 |
| IVT SC5 | IVT SC13 |
| IVT SC6 | IVT SC14 |
| IVT SC7 | IVT SC15 |
| IVT SC8 | IVT SC16 |
Table text extracted from the original PDF; superscript letters are shown inline. The original table image is below.
View original table image
| Genotype | Days to field emergence | Days to boot initiation | Days to flower initiation | Days to 50%flowering |
|---|---|---|---|---|
| IVT SC1 | 8.21 | 75.16 | 93.46 | 94.22 |
| IVT SC2 | 7.98 | 72.11 | 91.35 | 92.57 |
| IVT SC3 | 11.11 | 80.27 | 97.36 | 99.83 |
| IVT SC4 | 7.48 | 70.07 | 90.05 | 91.43 |
| IVT SC5 | 10.61 | 80.01 | 97.05 | 98.88 |
| IVT SC6 | 7.78 | 71.09 | 90.78 | 92.23 |
| IVT SC7 | 9.50 | 78.65 | 96.24 | 97.46 |
| IVT SC8 | 7.27 | 69.05 | 88.32 | 90.33 |
| IVT SC9 | 9.09 | 79.07 | 96.45 | 98.21 |
| IVT SC10 | 8.79 | 76.58 | 94.99 | 95.45 |
| IVT SC11 | 8.28 | 74.14 | 93.06 | 93.55 |
| IVT SC12 | 9.19 | 77.68 | 95.98 | 96.68 |
| IVT SC13 | 8.49 | 75.60 | 93.90 | 94.38 |
| IVT SC14 | 8.18 | 73.12 | 92.65 | 93.26 |
| IVT SC15 | 8.99 | 76.92 | 95.57 | 96.24 |
| IVT SC16 | 8.67 | 75.88 | 94.45 | 95.11 |
| S.Em± | 0.57 | 1.36 | 1.40 | 1.44 |
| CDat 5% | 1.67 | 3.98 | 4.21 | 4.22 |
Table text extracted from the original PDF; superscript letters are shown inline. The original table image is below.
View original table image
| Genotype | Days to grain development | Days to physiological maturity | Days to harvestable maturity |
|---|---|---|---|
| IVT SC1 | 108.45 | 116.77 | 127.00 |
| IVT SC2 | 107.51 | 114.15 | 124.38 |
| IVT SC3 | 113.41 | 130.84 | 141.07 |
| IVT SC4 | 106.51 | 112.15 | 122.38 |
| IVT SC5 | 112.41 | 129.83 | 139.94 |
| IVT SC6 | 106.91 | 113.73 | 123.96 |
| IVT SC7 | 111.51 | 126.82 | 137.05 |
| IVT SC8 | 105.49 | 111.15 | 121.38 |
| IVT SC9 | 111.97 | 128.83 | 139.06 |
| IVT SC10 | 109.85 | 121.79 | 132.02 |
| IVT SC11 | 108.04 | 115.76 | 125.99 |
| IVT SC12 | 110.40 | 124.81 | 135.04 |
| IVT SC13 | 108.89 | 118.78 | 129.01 |
| IVT SC14 | 107.80 | 114.75 | 124.98 |
| IVT SC15 | 110.12 | 123.80 | 134.03 |
| IVT SC16 | 109.37 | 120.79 | 131.02 |
| S.Em± | 1.15 | 1.99 | 1.89 |
| CDat 5% | 3.36 | 5.82 | 5.52 |
Table text extracted from the original PDF; superscript letters are shown inline. The original table image is below.
View original table image
| Genotype | Leaf Area Index | — | — | — |
|---|---|---|---|---|
| 30DAS | 60DAS | 90DAS | 120DAS | |
| IVT SC1 | 0.50 | 3.55 | 5.40 | 2.80 |
| IVT SC2 | 0.44 | 3.49 | 5.31 | 2.74 |
| IVT SC3 | 0.90 | 3.96 | 6.01 | 3.21 |
| IVT SC4 | 0.37 | 3.42 | 5.20 | 2.67 |
| IVT SC5 | 0.85 | 3.91 | 5.94 | 3.16 |
| IVT SC6 | 0.41 | 3.46 | 5.26 | 2.71 |
| IVT SC7 | 0.73 | 3.79 | 5.75 | 3.04 |
| IVT SC8 | 0.35 | 3.40 | 5.17 | 2.65 |
| IVT SC9 | 0.80 | 3.86 | 5.86 | 3.11 |
| IVT SC10 | 0.60 | 3.65 | 5.55 | 2.90 |
| IVT SC11 | 0.47 | 3.52 | 5.35 | 2.77 |
| IVT SC12 | 0.69 | 3.74 | 5.69 | 2.99 |
| IVT SC13 | 0.55 | 3.60 | 5.48 | 2.85 |
| IVT SC14 | 0.46 | 3.51 | 5.34 | 2.76 |
| IVT SC15 | 0.65 | 3.70 | 5.63 | 2.95 |
| IVT SC16 | 0.58 | 3.63 | 5.52 | 2.88 |
| S.Em± | 0.06 | 0.08 | 0.15 | 0.09 |
| CDat 5% | 0.16 | 0.24 | 0.43 | 0.25 |
Table text extracted from the original PDF; superscript letters are shown inline. The original table image is below.
View original table image
| Genotype | Leaf Area duration at 30-60 days | Leaf Area duration 60-90 days |
|---|---|---|
| IVT SC1 | 12753.00 | 27743.00 |
| IVT SC2 | 11903.00 | 26893.00 |
| IVT SC3 | 15003.00 | 29993.00 |
| IVT SC4 | 11228.00 | 26218.00 |
| IVT SC5 | 14503.00 | 29493.00 |
| IVT SC6 | 11553.00 | 26543.00 |
| IVT SC7 | 13803.00 | 28793.00 |
| IVT SC8 | 10503.00 | 25493.00 |
| IVT SC9 | 14203.00 | 29193.00 |
| IVT SC10 | 13153.00 | 28143.00 |
| IVT SC11 | 12503.00 | 27493.00 |
| IVT SC12 | 13603.00 | 28593.00 |
| IVT SC13 | 12903.00 | 27893.00 |
| IVT SC14 | 12303.00 | 27293.00 |
| IVT SC15 | 13453.00 | 28443.00 |
| IVT SC16 | 13003.00 | 27993.00 |
| S.Em± | 288.68 | 327.02 |
| CDat 5% | 842.57 | 954.51 |
Table text extracted from the original PDF; superscript letters are shown inline. The original table image is below.
View original table image
| Genotype | Crop growth rate (gcm-2day-1) | Relative growth rate (gg-1day-1) | Net assimilation rate (cm-2 day-1) | Specific Leaf Area (cm2 g-1) |
|---|---|---|---|---|
| IVT SC1 | 0.0036 | 0.031 | 0.364 | 0.51 |
| IVT SC2 | 0.0029 | 0.021 | 0.328 | 0.46 |
| IVT SC3 | 0.0065 | 0.058 | 0.461 | 0.67 |
| IVT SC4 | 0.0026 | 0.016 | 0.324 | 0.42 |
| IVT SC5 | 0.0061 | 0.054 | 0.45 | 0.65 |
| IVT SC6 | 0.0027 | 0.019 | 0.327 | 0.44 |
| IVT SC7 | 0.0052 | 0.049 | 0.439 | 0.6 |
| IVT SC8 | 0.0024 | 0.013 | 0.314 | 0.4 |
| IVT SC9 | 0.0056 | 0.051 | 0.435 | 0.62 |
| IVT SC10 | 0.0041 | 0.039 | 0.385 | 0.56 |
| IVT SC11 | 0.0034 | 0.028 | 0.352 | 0.5 |
| IVT SC12 | 0.0049 | 0.046 | 0.421 | 0.59 |
| IVT SC13 | 0.0038 | 0.034 | 0.337 | 0.52 |
| IVT SC14 | 0.0031 | 0.024 | 0.34 | 0.48 |
| IVT SC15 | 0.0046 | 0.042 | 0.39 | 0.57 |
| IVT SC16 | 0.0039 | 0.037 | 0.384 | 0.54 |
| S.Em± | 0.000433 | 0.00433 | 0.01 | 0.03 |
| CDat 5% | 0.001264 | 0.012639 | 0.02 | 0.08 |
Table text extracted from the original PDF; superscript letters are shown inline. The original table image is below.
View original table image
References
16 in the original paper- Ahmad M, Jehangir IA, Rizvan R, Dar SA, Iqbal S, Wani SH, et al. Phylogenetic Relationship of Oats (Avena sativa L): A Guide to Conservation and Utilization of Genetic Resources. Int. J Curr. Microbiol. App. Sci. 2020;9(11):831-845.
- Al-Freeh LM, Alabdulla SA, Huthily KH. Effect of Mineral-Biofertilizer on Physiological Parameters and Yield of Three Varieties of Oat (Avena sativa L.). Basrah Journal of Agricultural Sciences. 2019;32:8-25.
- Ayub M, Shehzad M. Comparative study on forage yield and quality of different oat (Avena sativa L.) varieties under agroecological conditions of Faisalabad, Pakistan. African Journal of Agricultural Research. 2011;6(14):3388-3391.
- Bali AS, Shah MH, Hassan B, Bali AS, Singh KN. Influence of various nitrogen, phosphorus and seed rates on herbage yield and quality of newly released oat genotype SK-0-7 (Sabzar) in temperate Kashmir. Forage Research. 1998;24(2):67-70.
- Biswas S, Jana K, Agrawal RK, Puste AM. Effect of integrated nutrient management on growth attributing characters of crops under various oat-lathyrus intercropping system. The Pharma Innovation Journal. 2019;8(9):368-373.
- Buerstmayr H, Krenn N, Stephan U, Grausgruber H, Zechner E. Agronomic performance and quality of oat (Avena sativa L.) genotypes of worldwide origin produced under Central European growing conditions. Field Crops Research. 2007;101(3):343-351.
- Ehlers W. Leaf area and transpiration efficiency during different growth stages in oats. The Journal of Agricultural Science. 1991;116(2):183-190. DOI:10.1017/S0021859600077571
- Hisir Y, Kara R, Dokuyucu T. Evaluation of Oat (Avena sativa L.) Genotypes for Grain Yield and Physiological Traits. Zemdirbyste Agriculture. 2012;99:55-60.
- Ibrahim MS, Ahmad A, Sohail A, Asad MJ. Nutritional and functional characterization of different oat (Avena sativa L.) cultivars. International Journal of Food Properties. 2020;23(1):1373-1385.
- Kim JD, Kim SG, Abuel SJ, Kwon CH, Shin CN, Ko KH, et al. Effect of location, season, and variety on yield and quality of forage oat. Asian-Australasian Journal of Animal Sciences. 2006;19(7):970-977.
- Lakshmanakumar, Guru SK. Growth Indices of Yield Variability in Wheat (Triticum aestivum L.) Under Varying Degree of Shades. Journal of Global Biosciences. 2014;3(4):778-786.
- Saha SK, Singh SP, Kingra PK. Study on specified growth attributes, thermal unit requirement and its utilization efficiency in barley cultivars under varied microenvironment. Int. J Curr. Microbiol. App. Sci. 2018;7(10):2050-2061.
- Siloriya PN, Rathi GS, Meena VD. Relative performance of oat (Avena sativa L.) varieties for their growth and seed yield. African Journal of Agricultural Research. 2014;9(3):425-431.
- Singh KN, Bali AS, Hasan B, Shah MH, Bali AS, Khan HU, et al. Effect of seed rate and nitrogen on biomass production and quality of oat (Avena sativa L.). Indian Journal of Agronomy. 1997;42(2):310-312.
- Watson DJ. Physiological basis of variations in yield. Advance in Agronomy. 1952;4:101-145.
- Williams RF. The physiology of plant growth with special reference to the concept of net assimilation rate. Annals of Botany. 1946;10(37):41-72.