
Research article · 2024 · Full text
International Journal of Agriculture Extension and Social DevelopmentExtent of adoption of biofertilizers by turmeric growers
Volume 7(2) · Pages 85–87 · DOI: 10.33545/26180723.2024.v7.i2b.303 ↗
Research areasAgricultural Economics and Practices
Abstract
Author-writtenPresent study was conducted to know the adoption level of Biofertilizers by the turmeric growers. Study was conducted in Wasmat block of Hingoli district of Maharashtra. 120 turmeric growing farmers from 10 villages were randomly selected for study. An interview schedule with respect to socio economic characteristics of turmeric growers and their adoption level of biofertilizer use was designed for the study. Majority of turmeric growers were middle aged, educated up to higher secondary education, had medium land holding, income, social participation, extension contact and risk orientation. 87.50 percent of the turmeric grower had medium adoption level, whereas 12.50 percent and 0.00 percent of biofertilizer users were in the low and high adoption level categories, respectively.
Summary
Source-checkedPlain-language reading of the full paper, prepared with AI and checked against the text. Each point links to the authors' own words.
Why it matters
- India is the global leader in turmeric, accounting for 80% of production and 60% of exports. View evidence ↗
- The heavy use of chemical fertilizers in agriculture negatively impacts soil structure and fertility. View evidence ↗
- Biofertilizers are a cost-effective alternative to chemical fertilizers that can improve crop productivity and maintain sustainable agro-ecosystems. View evidence ↗
The question
- The study aimed to examine the socio-economic characteristics of turmeric growers and determine the extent to which they adopt biofertilizers. View evidence ↗
What they did
- The research was conducted in the Wasmat block of Hingoli district, involving 120 randomly selected farmers from 10 villages who cultivated more than 0.20 ha of turmeric. View evidence ↗
- Data was collected using an interview schedule focused on the growers' socio-economic traits and their level of biofertilizer adoption. View evidence ↗
- Adoption levels were determined by calculating an adoption score and categorizing farmers as low, medium, or high based on the mean and standard deviation. View evidence ↗
What they found
- The majority of the surveyed farmers (67.50%) were middle-aged, while 19.17% were old and 13.33% were young. View evidence ↗
- The most common education level was higher secondary education (27.50%), followed by primary education from 5th to 7th standard (23.33%). View evidence ↗
- Nearly half of the respondents (49.16%) possessed medium-sized land holdings, while 20.00% had marginal holdings. View evidence ↗
- Rhizobium was the most used biofertilizer (65.00%), followed by Azotobacter (52.50%), Phosphobacteria (30.00%), and Azospirillum (19.16%). View evidence ↗
- The vast majority of turmeric growers (87.50%) showed a medium level of biofertilizer adoption, with 12.50% showing low adoption and none showing high adoption. View evidence ↗
What it means
- The authors conclude that the typical turmeric grower in the study area is middle-aged, has a higher secondary education, medium land holdings, medium income, and medium levels of social participation, extension contact, and risk orientation. View evidence ↗
Visual summary
3 visualsIllustrations explain the paper; charts are replotted from the paper's own table values.
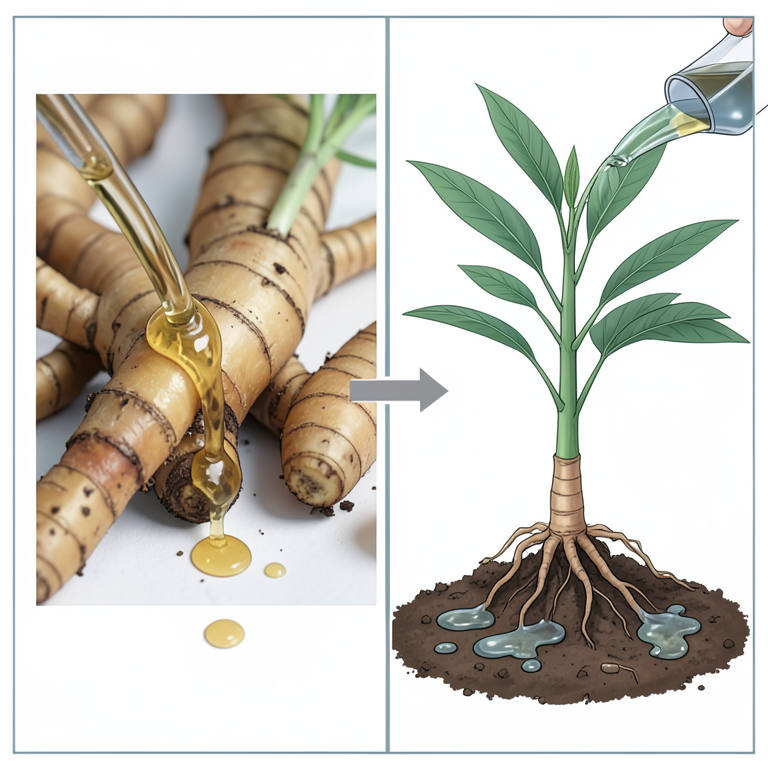
Biofertilizer Usage and Application
AI-generated conceptual illustration (turmeric plants). It explains the idea and does not show study data.
View source evidence ↗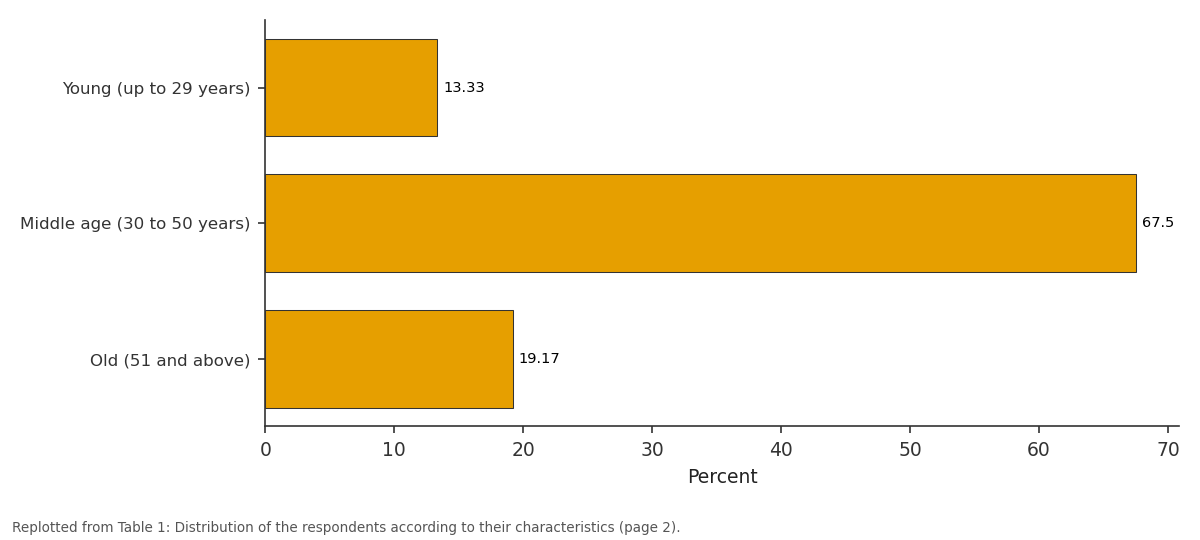
Percent: Young (up to 29 years) vs Middle age (30 to 50... vs Old (51 and above)
Replotted from Table 1 (page 2) of the original paper. Every bar is the paper's own table value.
View source evidence ↗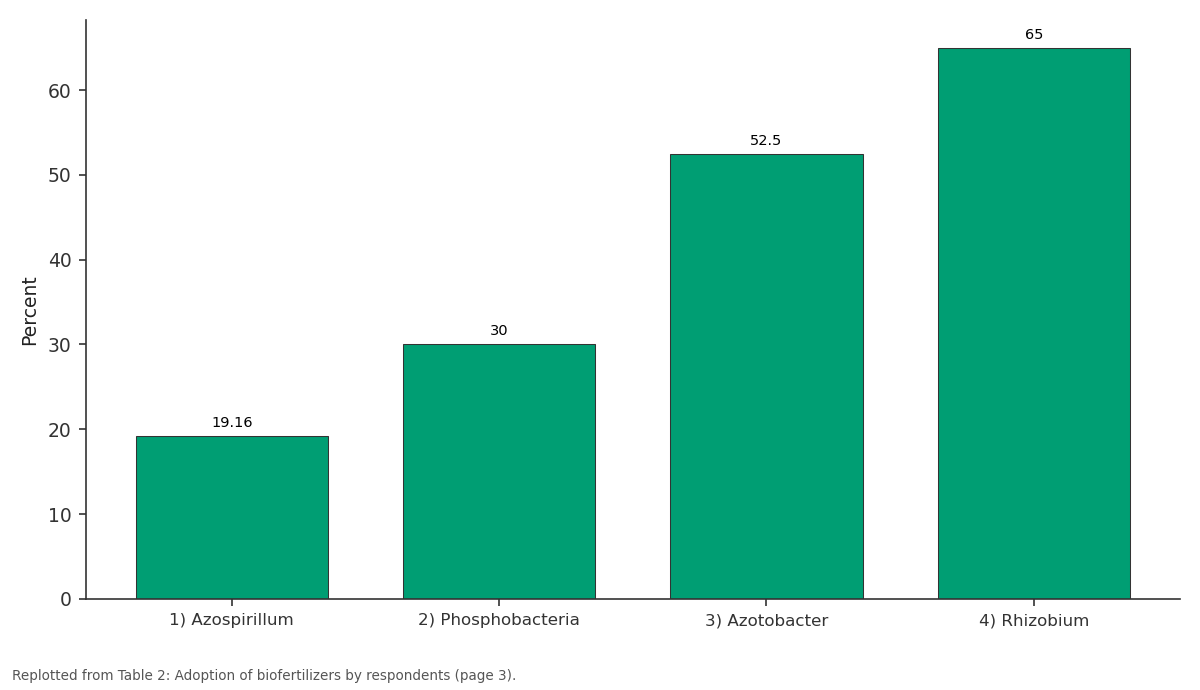
Percent: 1) Azospirillum vs 2) Phosphobacteria vs 3) Azotobacter vs 4) Rhizobium
Replotted from Table 2 (page 3) of the original paper. Every bar is the paper's own table value.
View source evidence ↗Figures & tables
From the original paper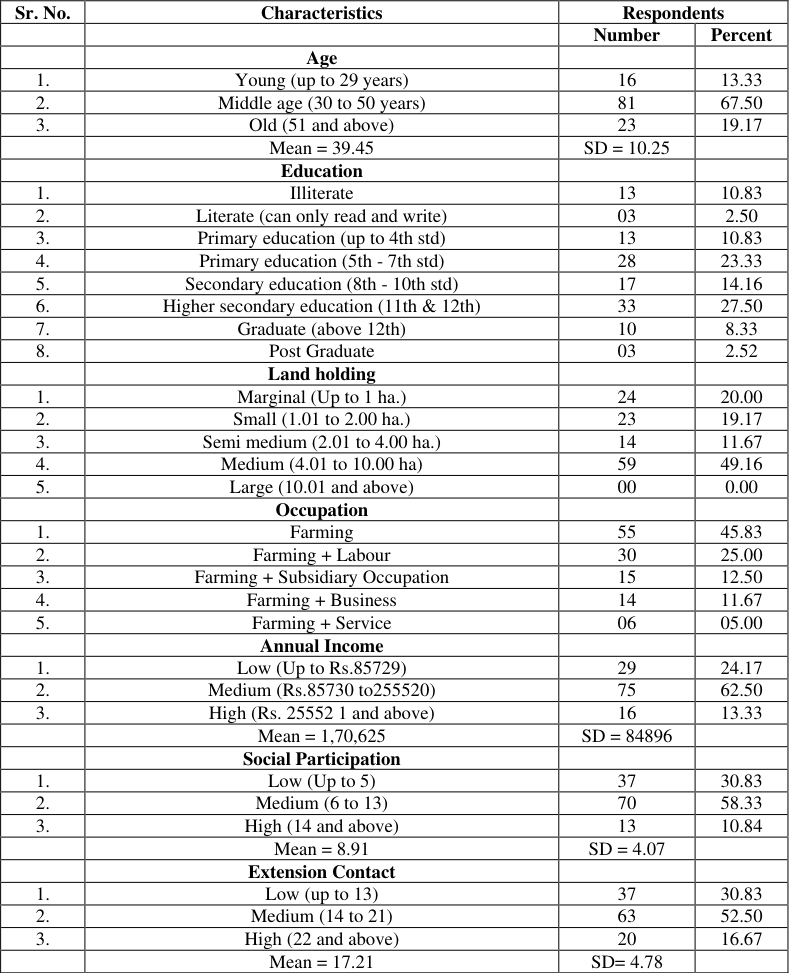 Table 1
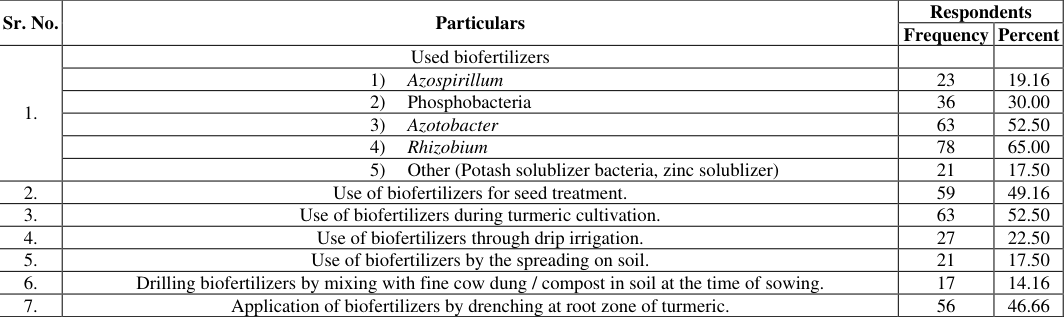 Table 2
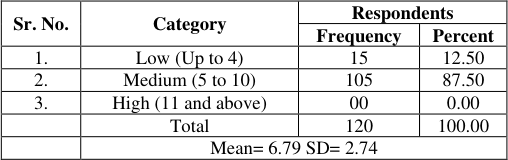 Table 3
Introduction
Turmeric (Curcuma longa L) is used widely as a spice in South Asia and Middle Eastern Cooking. India is the world's largest producer, consumer and exporter of turmeric. India produces 80 percent of global turmeric production and exports 60 percent of worlds export. Telangana is largest producer of turmeric followed by Andhra Pradesh, Tamil Nadu, Karnataka, Orissa, West Bengal and Maharashtra (Anonymous 2020) [1] . Turmeric has greater importance in Indian dishes, Hindu religious functions and medicinal and cosmetic industries. Chemical fertilizers have played an important role in increasing agricultural production. However, massive use of chemical fertilizers has adverse effect on soil fertility and soil structure. (Savic 2012) [5] . The use of chemical fertilizers should be reduced and replaced as by biofertilizers. Biofertilizers enhances soil fertility and crop productivity, maintain agro-ecosystem and sustainable agricultural production and is also cost effective as compared to use of inorganic chemical fertilizers. Biofertilizers contain microorganisms known to better germination and root expansion of crop (Chen 2006) [2] . They also consist of microbes useful for nitrogen fixation, phosphate mineralization and phytohormone production essential for plant growth. The biofertilizers production is also simple, requires less energy, capital and labour force as compared to chemical fertilizers (Raimi et al. 2017) [4] . Despite of these factors the use of biofertilizers is not satisfactory. Thus the study was undertaken with the specific objectives to study the socio-economic characteristics of the turmeric growers and to know the extent of adoption of biofertilizers by them.
Materials and Methods
Hingoli is one of the leading turmeric producer district in Marathwada region of the Maharashtra State. Present study was purposively conducted in Wasmat block of Hingoli district having major area under turmeric cultivation. 120 farmers from 10 villages were selected randomly who have cultivated turmeric crop on more than 0.20 ha. An interview schedule including relevant questions for seeking information with respect socio economic characteristics of the turmeric growers and their adoption level about biofertilizers use was designed for the study. Data were collected by contacting the selected farmers at their homes or farm. A level of adoption of biofertilizers was measured by computing adoption score. Based on total score of the respondents, they were classified into three categories low, medium and high by using mean and standard deviation. Statistical tools frequency, percentage, range, Karl Person's correlation coefficient, multiple linear regression have been used for data analysis.
Results and Discussion
Results of the table 1 with regards to profiles of the respondents revealed that 67.50 percent of the respondents were middle aged, where as 19.17 percent and 13.33 percent respondents belonged to old age group and young age group respectively. www.extensionjournal.com Regarding education 27.50 percent of the respondents were educated up to higher secondary level education followed by 23.33 percent respondents had 5 th to 7 th standard primary education, 14.16 percent had secondary education, 10.83 percent were illiterate and equal respondents had up to 4 th standard primary education. 8.33 percent respondents were graduates, 2.52 percent were post graduate and 2.50 percent could able to read and write. The data from the Table-1 also revealed that 49.16 percent of the respondents had medium size of land holding followed by 20.00 percent had marginal land holding. 19.17 percent respondents were small land holder, 11.67 percent were semi medium land holder and none of the respondent had large land holding. Majority (45.83%) of respondents were engaged in farming, whereas, 25.00 percent of respondents were engaged in farming with labour, 12.50 engaged in farming with subsidiary occupation, 11.67 percent were engaged in farming with business and 5.00 percent were engaged in farming with service. In case of annual income 62.50 percent of respondents had medium income level followed by 24.17 percent and 13.33 percent respondents had high and low annual income respectively. Majority (58.33%) of the respondents were having medium social participation followed by 30.83 percent and 10.84 percent had low social participation and high social participation, respectively. Nearly fifty percent (52.50%) respondents were having medium level of extension contact. Whereas, 30.83 percent were having low extension contact and only 16.67 percent had high level of extension contact. More than half (66.67%) respondents had medium level risk orientation, whereas, 26.67 and 6.66 percent of them had low and high level risk orientation, respectively.
| Sr. No. | Characteristics | Respondents | — |
|---|---|---|---|
| Number | Percent | ||
| Age | |||
| 1. | Young (up to 29 years) | 16 | 13.33 |
| 2. | Middle age (30 to 50 years) | 81 | 67.50 |
| 3. | Old (51 and above) | 23 | 19.17 |
| Mean = 39.45 | SD = 10.25 | ||
| Education | |||
| 1. | Illiterate | 13 | 10.83 |
| 2. | Literate (can only read and write) | 03 | 2.50 |
| 3. | Primary education (up to 4th std) | 13 | 10.83 |
| 4. | Primary education (5th - 7th std) | 28 | 23.33 |
| 5. | Secondary education (8th - 10th std) | 17 | 14.16 |
| 6. | Higher secondary education (11th & 12th) | 33 | 27.50 |
| 7. | Graduate (above 12th) | 10 | 8.33 |
| 8. | Post Graduate | 03 | 2.52 |
| Land holding | |||
| 1. | Marginal (Up to 1 ha.) | 24 | 20.00 |
| 2. | Small (1.01 to 2.00 ha.) | 23 | 19.17 |
| 3. | Semi medium (2.01 to 4.00 ha.) | 14 | 11.67 |
| 4. | Medium (4.01 to 10.00 ha) | 59 | 49.16 |
| 5. | Large (10.01 and above) | 00 | 0.00 |
| Occupation | |||
| 1. | Farming | 55 | 45.83 |
| 2. | Farming + Labour | 30 | 25.00 |
| 3. | Farming + Subsidiary Occupation | 15 | 12.50 |
| 4. | Farming + Business | 14 | 11.67 |
| 5. | Farming + Service | 06 | 05.00 |
| Annual Income | |||
| 1. | Low (Up to Rs.85729) | 29 | 24.17 |
| 2. | Medium (Rs.85730 to255520) | 75 | 62.50 |
| 3. | High (Rs. 25552 1 and above) | 16 | 13.33 |
| Mean = 1,70,625 | SD = 84896 | ||
| Social Participation | |||
| 1. | Low (Up to 5) | 37 | 30.83 |
| 2. | Medium (6 to 13) | 70 | 58.33 |
| 3. | High (14 and above) | 13 | 10.84 |
| Mean = 8.91 | SD = 4.07 | ||
| Extension Contact | |||
| 1. | Low (up to 13) | 37 | 30.83 |
| 2. | Medium (14 to 21) | 63 | 52.50 |
| 3. | High (22 and above) | 20 | 16.67 |
| Mean = 17.21 | SD= 4.78 |
Table text extracted from the original PDF; superscript letters are shown inline. The original table image is below.
View original table image
Overall adoption of biofertilizers by respondents
Result of Table-3, indicated that 87.50 percent of respondents belonged to medium level of adoption, whereas 12.50 percent and 0.00 percent of biofertilizer users were in the low and high level categories of adoption, respectively. Similar findings were reported by Rathod (2017) [3] .
Summery and Conclusions
Socio economic characteristics of the turmeric growers, it was found majority (67.50 percent) were middle aged, 27.50 percent were educated up to higher secondary education. Nearly half (49.16 percent) had medium size of land holding, majority (45.83%) were engaged in farming occupation, 62.50 percent had medium income, 58.33 percent were having medium social participation, more than half (52.50%) were having medium level of extension contact and more than half (66.67%) turmeric growers had medium level risk orientation. Majority (65.00%) of the turmeric growers used Rhizobium followed by Azotobacter (52.50%), Phosphobacteria (30.00%), Azospirillum (19.16%), and other biofertilizers like potash solublizer bacteria and/or zinc solublizer bacteria (17.50%). High majority (87.50%) of respondents belonged to medium level of adoption, whereas 12.50 percent and 0.00 percent of biofertilizer users were in the low and high level categories of adoption, respectively
Figures and tables from the paper
| Sr. No. | Particulars | Respondents | — |
|---|---|---|---|
| Frequency | Percent | ||
| 1. | Used biofertilizers | ||
| 1) Azospirillum | 23 | 19.16 | |
| 2) Phosphobacteria | 36 | 30.00 | |
| 3) Azotobacter | 63 | 52.50 | |
| 4) Rhizobium | 78 | 65.00 | |
| 5) Other (Potash solublizer bacteria, zinc solublizer) | 21 | 17.50 | |
| 2. | Use of biofertilizers for seed treatment. | 59 | 49.16 |
| 3. | Use of biofertilizers during turmeric cultivation. | 63 | 52.50 |
| 4. | Use of biofertilizers through drip irrigation. | 27 | 22.50 |
| 5. | Use of biofertilizers by the spreading on soil. | 21 | 17.50 |
| 6. | Drilling biofertilizers by mixing with fine cow dung / compost in soil at the time of sowing. | 17 | 14.16 |
| 7. | Application of biofertilizers by drenching at root zone of turmeric. | 56 | 46.66 |
Table text extracted from the original PDF; superscript letters are shown inline. The original table image is below.
View original table image
| Sr. No. | Category | Respondents | — |
|---|---|---|---|
| Frequency | Percent | ||
| 1. | Low (Up to 4) | 15 | 12.50 |
| 2. | Medium (5 to 10) | 105 | 87.50 |
| 3. | High (11 and above) | 00 | 0.00 |
| Total | 120 | 100.00 | |
| Mean= 6.79 SD= 2.74 |
Table text extracted from the original PDF; superscript letters are shown inline. The original table image is below.
View original table image
References
5 in the original paper- Anonymous. Turmeric outlook, January 2020. Retrieved from www.pjtsau.edu.in -AgriMkt; c2020.
- Chen J-H. The combined use of chemical and organic fertilizers and/or biofertilizers for crop growth and soil fertility. In: International workshop on sustained management of the soil-Rhizosphere System for efficient crop production and fertilizer use; 2006 Oct 111.
- Rathod MK, Kad SB, Koshthi NR. Adoption behavior of farmers towards biofertilizers in paddy. Int J Extension Educ. 2017;XIII:83-88.
- Raimi A, Adeleke R, Roopnarain A. Soil fertility challenges and biofertilizers as a viable alternative for increasing smallholder crop productivity in sub-Saharan Africa. Cogent Food Agric. 2017;3(1):1-26.
- Savic S. An agricultural pollutant: Chemical fertilizers. Int J Environ Sci Dev. 2012;3(1):73-80.