
Research article · 2024 · Full text
International Journal of Advanced Biochemistry ResearchThe national rural livelihood mission advantages and awareness among rural women in Udaipur district
Volume 8(1S) · Pages 986–990 · DOI: 10.33545/26174693.2024.v8.i1sm.496 ↗
Research areasAgricultural Economics and PracticesLivestock Management and Performance ImprovementGender, Education, and Development Issues
Abstract
Author-writtenThe purpose of this study was to investigate rural women's awareness of the National Rural Livelihoods Mission. The current investigation was carried out in the Udaipur district of Rajasthan in a specifically chosen Salumbar and Sarada Panchayat Samiti. One hundred women were chosen at random to make up the sample. With the aid of an interview plan that was created, data was gathered through interview technique. It was found that half of the respondents (56%) were married (81%), belonged to joint households (55%) with 5-8 people, and were in the 18-30 age range. It was discovered that half of respondents (61%) belonged to low socio-economic status whereas rest of the respondents (39%) had medium socio-economic status. It was discovered that half of the respondents (52%) knew averagely about several NRLM topics, while the remaining respondents (48%) knew very well about them.
Summary
Source-checkedPlain-language reading of the full paper, prepared with AI and checked against the text. Each point links to the authors' own words.
Why it matters
- A significant number of people in rural India continue to live below the poverty line despite the country's rapid GDP growth. View evidence ↗
- The National Rural Livelihood Mission (NRLM) was introduced by the Ministry of Rural Development to address rural poverty. View evidence ↗
- The NRLM aims to create a multidimensional positive impact on the rural poor, specifically by organizing women into grassroots institutions. View evidence ↗
The question
- The study aims to evaluate the level of knowledge that beneficiaries have regarding the National Rural Livelihood Mission. View evidence ↗
What they did
- The research was conducted in the Salumbar and Sarada panchayat samiti within the Udaipur district of Rajasthan. View evidence ↗
- The study sample consisted of 100 randomly selected women. View evidence ↗
- Data collection was performed personally using an interview schedule. View evidence ↗
- The researchers used frequency and percentage to analyze respondent characteristics, their knowledge of NRLM, and the constraints they faced. View evidence ↗
What they found
- The majority of the respondents (56%) were between 18 and 30 years old. View evidence ↗
- Most of the women surveyed (81%) were married. View evidence ↗
- The majority of respondents (61%) had a low socio-economic status, while 39% had a medium status. View evidence ↗
- Programme personnel were the primary source of information for 72% of the respondents. View evidence ↗
- The primary motivation for participating in the NRLM was to earn money, as reported by 87% of the respondents. View evidence ↗
- Between 31% and 44% of respondents attended various program trainings, including SHG management, book keeping, and skill development. View evidence ↗
- No respondents received information about the NRLM from mass media sources like television, radio, or newspapers. View evidence ↗
What it means
- The authors conclude that while rural women are aware of the NRLM, they lack necessary information regarding its procedural aspects. View evidence ↗
- The authors recommend generating more awareness among beneficiaries to help them understand the program's significance and improve their socio-economic profiles. View evidence ↗
Visual summary
2 visualsIllustrations explain the paper; charts are replotted from the paper's own table values.
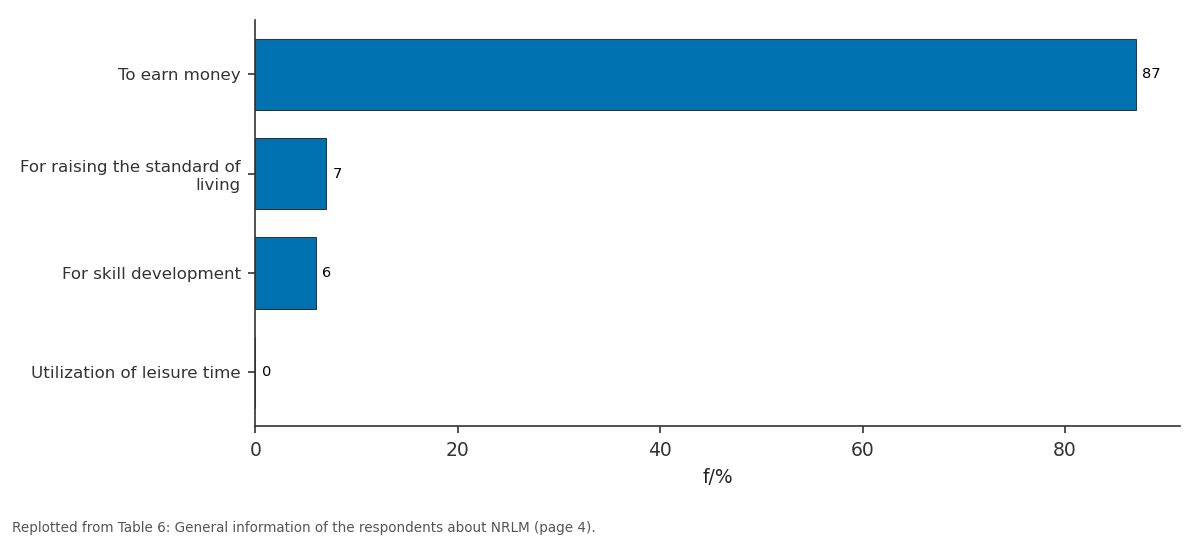
f/%: To earn money vs For raising the... vs For skill development vs Utilization of leisure...
Replotted from Table 6 (page 4) of the original paper. Every bar is the paper's own table value.
View source evidence ↗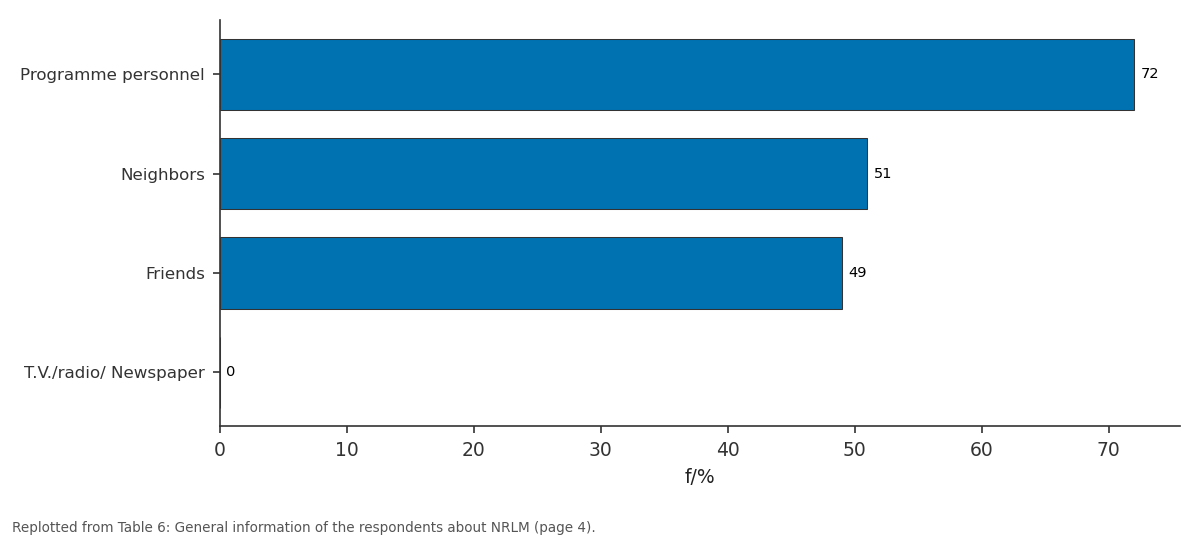
f/%: Programme personnel vs Neighbors vs Friends vs T.V./radio/ Newspaper
Replotted from Table 6 (page 4) of the original paper. Every bar is the paper's own table value.
View source evidence ↗Figures & tables
From the original paper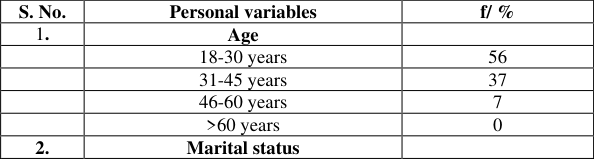 Table 1
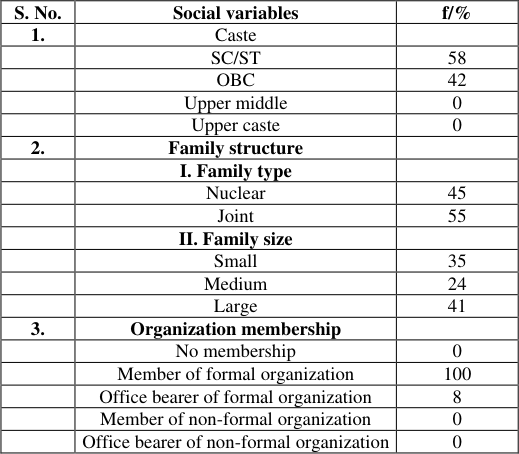 Table 2
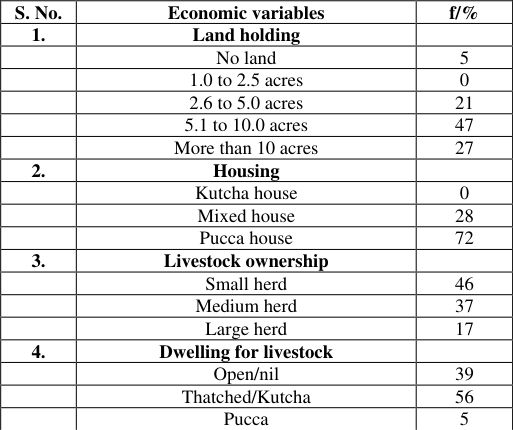 Table 3
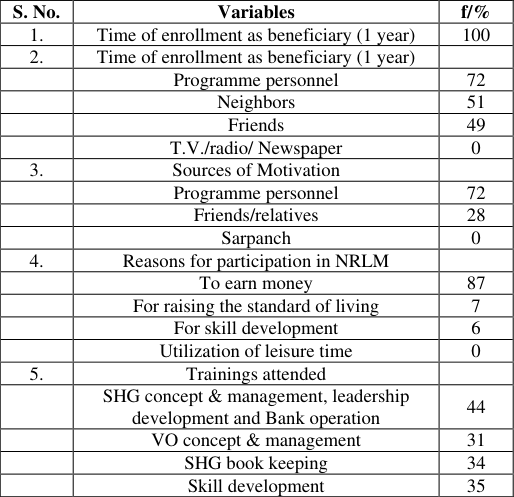 Table 6
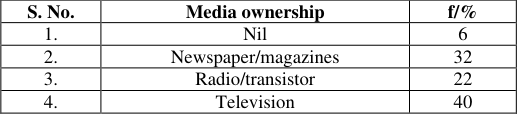 Table 4
 Table 5
Introduction
Despite India's GDP growing at a rapid pace, a sizable portion of the rural populace remains below the poverty line (BPL). The rate of rural poverty was calculated in many researches at various levels (Rajpoot et al., 2023) [20] . Rural poverty is a significant concern for government at all levels, despite a lot of efforts in 2010; the Ministry of Rural Development introduced a programme National Rural Livelihood Mission (NRLM), to combat the issue of rural poverty, with effect from March 29, 2016, NRLM was renamed as DAY-NRLM (Deendayal Antyodaya Yojana -National Rural Livelihood Mission). It aims to make a multidimensional impact on the lives of India's rural poor by mobilizing them, particularly the women, into robust grassroots institutions of their own where, with the strength of the group behind them, they will be able to exert voice and accountability over providers of educational, health, nutritional and financial services. This is expected to have a transformational social and economic impact, supporting India's efforts to achieve the Millennium Development Goals on nutrition, gender and poverty. This scheme was launched in 12 states that account for 85% of the rural poor in India. The scheme has been partly funded by the World Bank which has contributed $1 billion and the central government has invested $5.1 billion (Gautam, 2012) [7] . Recommendation of the Planning Commission working group on NRLM highlighted the problem in going with the BPL list as it has large exclusion errors. NRLM has adopted identification of poor by a participatory process at the level of the community. The participatory process aims at covering the vulnerable groups such as tribal groups, SC and ST groups, women headed households, persons with disabilities and destitute Diwan et al., 2022 [3] . NRLM works on three pillars -enhancing and expanding existing livelihood options of the poor; building skills for the job market outside; and nurturing self-employed and entrepreneurs (for micro-enterprises). India's rural areas, where 69% of the country's population lives, are key to realizing the aim of sustainable development. Acknowledging the importance of rural development, India has implemented a range of inventive tactics and methods to guarantee the fundamental rights of the rural populace (Diwan et al., 2017) [4] . In this regard, the Government has implemented National Rural Livelihoods Mission (NRLM) to support rural people living below poverty line. This scheme was launched in 2011 and is one of the flagship programmes of Ministry of Rural Development. This is one of the world's largest initiatives to improve the livelihood of poor. It aims to make a multidimensional impact on the lives of India's rural poor by mobilizing them, particularly the women, into robust grassroots institutions of their own where, with the strength of the group behind them, they will be able to exert voice and accountability over providers of educational, health, nutritional and financial services. This is expected to have a transformational social and economic impact, supporting India's efforts to achieve the Millennium Development Goals on Nutrition, Gender, and Poverty. The fundamental tenet of National Rural Livelihoods Mission is that impoverished people possess intrinsic potential and a strong want to escape poverty. Unleashing their potential to create fulfilling livelihoods and help them escape poverty is the task. Success of any development effort depends on the effective participation of both men and women in the development programmes (Rajpoot et al., 2023) [20] . One of the most crucial reasons for lack of participation is lack of knowledge about the programmes, their functioning and benefits. Women are too much preoccupied with domestic chores that they are starkly ignorant about the outside world. If the women are aware about the benefits of all the developmental/welfare schemes running for them, it automatically increases their active participation in programmes which not only improves the socio-economic profile of women but also places them in the mainstream of development (Kemparaju and Khan 2015) [11] . The present paper attempts to assess the knowledge of the beneficiaries about National Rural Livelihood Mission.
Methodology
The present investigation was undertaken in Salumbar and Sarada panchayat samiti in Udaipur district of Rajasthan. Four villages namely Amarpura, Veerpura, Sarada and Chavand were selected purposively from this panchayat samiti. For the selection of sample, a list of SHGs which have completed at least one year, along with name of the members was prepared. From this list, 100 women were randomly selected to form the sample of the study. The data were collected personally with the help of an interview schedule.
Statistical analysis
After collecting data, it is necessary to analyze them with the help of statistical tools to arrive at proper and adequate conclusion. Following statistical measures were used to analyze the data.
Frequency and percentage: Frequency and percentage
were used to analyze the data about the personal and socio economic characteristics of respondents, their knowledge about NRLM and constraints faced by them. 2. Mean percent score: Mean percent scores were calculated to analyze data regarding constraints. Mean percent scores were obtained by dividing total scores of the respondents by the maximum obtainable score and multiplying by 100 under each constraint. The formula is as under.
Paired 't' test:
In order to find out the significance of difference in income generated before and after getting the benefits of NRLM, paired t test was applied using following formula.
Result and Discussion
Result and Discussion
Basis of Personal Variables
This section deals with the general information of the respondents like age, education, marital status, occupation, caste, family size and type, organizational membership, land holding, housing, livestock ownership, dwelling, media ownership and their socio-economic status. More than half of the respondents (56%) belonged to the age group of 18-30 years while one third of the respondents (37%) were in the age group of 31-45 years and 7% respondents were in the age group of 46-60 years. None of the respondents were more than 60 years of age. Marital status of portrays that majority of the respondents (81%) were married while 11% were widow and 8% respondents were unmarried. Less than half of the respondents (45%) had farming as their occupation, 28% were farm laborer and 20% were nonwage earners. Few respondents (7%) were in the service sector.
Education
Education plays vital role in human resource development. It brings about desirable change in the behavior of an individual. Table 1 reveals that more than one fourth respondents (29%) were illiterate, less than one fourth of the respondents (24%) were middle school educated, 16% could read and write and 15% respondents were primary educated. Few respondents were educated up to high school (7%) and senior secondary (9%). Priyakumari and Karthik (2017) [7] revealed that majority 32.00 percent of the respondents belong to the age group of 18-30 years. Sunitha, et al. (2019) [21] results explored that majority 53.33% of the farm women fall under young age groups 18-35 years followed by 38.33% middle age i.e. 36-50 whereas only few 8.33 percent farm women are in the age group of above 50 years. The results are in accordance with Gwary et al., (2011) [9] , Diwan et al., 2022 [3] where majority of youth fell under age group of 27-32 years.
| S. No. | Personal variables | f/ % |
|---|---|---|
| 1. | Age | |
| 18-30 years | 56 | |
| 31-45 years | 37 | |
| 46-60 years | 7 | |
| >60 years | 0 | |
| 2. | Marital status |
Table text extracted from the original PDF; superscript letters are shown inline. The original table image is below.
View original table image
Organizational membership
Data presented show that all the respondents (100%) were member of formal organization and 8% were office bearer of formal organization i.e. self-help group. They were not member of any other organization except SHGs. The results are in accordance to results of Prosper et al., (2015) [18] and Mbah et al., (2016) [15] , Diwan et al., 2017 [4] and Diwan et al., 2022 [3] where majority of the respondents in the study area were men.
Economic variables -Land and Housing holding
Perusal of data in Table 3 show that less than half of the respondents (47%) had 5.1 to 10.0 acres of land, more than one fourth respondents (27%) had more than 10 acres of land, 21% respondents had 2.6 to 5.0 acres of land and few respondents (5%) had no land. Looking into the housing of the respondents, majority of the respondents (72%) had pucca houses whereas 28% had mixed houses.
| S. No. | Economic variables | f/% |
|---|---|---|
| 1. | Land holding | |
| No land | 5 | |
| 1.0 to 2.5 acres | 0 | |
| 2.6 to 5.0 acres | 21 | |
| 5.1 to 10.0 acres | 47 | |
| More than 10 acres | 27 | |
| 2. | Housing | |
| Kutcha house | 0 | |
| Mixed house | 28 | |
| Pucca house | 72 | |
| 3. | Livestock ownership | |
| Small herd | 46 | |
| Medium herd | 37 | |
| Large herd | 17 | |
| 4. | Dwelling for livestock | |
| Open/nil | 39 | |
| Thatched/Kutcha | 56 | |
| Pucca | 5 |
Table text extracted from the original PDF; superscript letters are shown inline. The original table image is below.
View original table image
Livestock ownership
It is evident from Table 3 that less than half of the respondents (46%) had small herd size while 37 and 17% of the respondents owned medium and large size herd respectively. The probable reason could be due to the prominence of nuclear families in the study. The results were in accordance to Laishram (2012) [14] where majority of youth had medium family size.
Dwelling
From Table 3, it was clearly revealed that the more than half of the respondents (56%) had kutcha dwelling for their livestock, whereas more than one third of the respondents (39%) had open dwelling and only 5% respondents had pucca dwelling for their livestock.
Media ownership
Data in Table 4 reveal that 40% of the respondents had television, less than one third of the respondents (32%) had
| S. No. | Media ownership | f/% |
|---|---|---|
| 1. | Nil | 6 |
| 2. | Newspaper/magazines | 32 |
| 3. | Radio/transistor | 22 |
| 4. | Television | 40 |
Table text extracted from the original PDF; superscript letters are shown inline. The original table image is below.
View original table image
subscribed newspaper/magazines and less than one fourth of the respondents (22%) had radio/transistor and few respondents (6%) had no media ownership. The possible reason for medium to low level of media innovativeness may be their educational level and medium to low-risk preference.
The result was supported by the findings of Khan (2007) [13] .
The above findings are supported by the findings of Dhavale et al. (2022) [2] .
Socio economic status
On the basis of scores obtained by the respondents in the different aspects of socio-economic status scale, the respondents were categorized as having high, medium and low socio-economic status. Data in Table 5 point out that majority of the respondents (61%) were from low socioeconomic status whereas 39% of the respondents had medium socio-economic status. None of the respondents had high socio economic status as the beneficiaries of NRLM are below poverty line. Dropouts after middle school and illiterates observed might be due to poor socioeconomic condition, to support their family, help their parents in agriculture and dairying. The research findings are in concurrence with that of Laishram (2012) [14] , where majority youth in dairy farming received high school education. The possible reason for medium to low-risk preference due to their medium socio-economic status, marginal land holding etc. These above findings are supported by findings of Pradhan et al. (2021) [16] . High 0
| S. No. | Socio Economic Status | f/% |
|---|---|---|
| 1. | Low | 61 |
| 2. | Medium | 39 |
| 3. | High | 0 |
Table text extracted from the original PDF; superscript letters are shown inline. The original table image is below.
View original table image
General information about NRLM programme
This section deals with the general information regarding different aspects related to NRLM i.e. time of enrollment in the programme, sources of information and motivation, reasons for participation in the programme and trainings received. In the study area, the NRLM started in beginning of the year 2016. Data in Table 6 reveal that all the respondents (100%) were enrolled as beneficiary of the programme only one year back. Table reveals that majority of the respondents reported programme personnel as the source of information while nearly half of the respondents also mentioned that they got information regarding NRLM through neighbours (51%) and friends (49%). None of the respondents got the information from T.V., radio and newspaper. These above findings are supported by findings of Raghav et al., (2021) [19] and Diwan et al. (2022) [3] . Moringa oleifera can be eaten fresh, cooked, and stored as a dried powder use for many months without any major loss of its nutritional value of women's Dautaniya et al. (2022) [1] . Regarding sources of motivation to participate in the programme, the table depicts that majority of the respondents (72%) were motivated by personnel of the programme while 28% respondents were motivated by friends and relatives and none of the respondents were motivated by Sarpanch. Table 6 reveals that the major reason reported by the respondents for participation in NRLM was to earn money (87%) while 6-7% respondents participated for skill development and raising the standard of living and none of the respondents mentioned utilization of leisure time as the reason for their participation. Data in the Table 6 depicts that 31-44% respondents attended the trainings under this programme i.e. on SHG concept and management, leadership development and bank operation, VO concept and management, SHG book keeping and skill development Jagadeeswari (2015) [10] . Goswami et al. (2021) [8] found that there is 40.00% of social empowerment of the women as compared to 36.20% before joining. Psychologically they were empowered 35.00%, before joining of the DAY-NRLM they were only 32.75% empowered Dreze and Khare (2009) [5] . Garg (2008) [6] economically they showed a rise of 25.00% in respect to 19.00% after joining the scheme.
| S. No. | Variables | f/% |
|---|---|---|
| 1. | Time of enrollment as beneficiary (1 year) | 100 |
| 2. | Time of enrollment as beneficiary (1 year) | |
| Programme personnel | 72 | |
| Neighbors | 51 | |
| Friends | 49 | |
| T.V./radio/ Newspaper | 0 | |
| 3. | Sources of Motivation | |
| Programme personnel | 72 | |
| Friends/relatives | 28 | |
| Sarpanch | 0 | |
| 4. | Reasons for participation in NRLM | |
| To earn money | 87 | |
| For raising the standard of living | 7 | |
| For skill development | 6 | |
| Utilization of leisure time | 0 | |
| 5. | Trainings attended | |
| SHG concept & management, leadership development and Bank operation | 44 | |
| VO concept & management | 31 | |
| SHG book keeping | 34 | |
| Skill development | 35 |
Table text extracted from the original PDF; superscript letters are shown inline. The original table image is below.
View original table image
Conclusion
It can be concluded that the rural women were aware of the programme but lacked information about the procedural aspects. Therefore, awareness should be generated among rural women beneficiaries to understand the significance of the programme viz. Personal Variables, Social Variables, Economic Variables, Media Ownership, Socio-Economic Status and SHG which in turn result in effective participation in the programme, improvement in their socio-economic profile, and bring them in the mainstream of NRLM development.
Figures and tables from the paper
| S. No. | Social variables | f/% |
|---|---|---|
| 1. | Caste | |
| SC/ST | 58 | |
| OBC | 42 | |
| Upper middle | 0 | |
| Upper caste | 0 | |
| 2. | Family structure | |
| I. Family type | ||
| Nuclear | 45 | |
| Joint | 55 | |
| II. Family size | ||
| Small | 35 | |
| Medium | 24 | |
| Large | 41 | |
| 3. | Organization membership | |
| No membership | 0 | |
| Member of formal organization | 100 | |
| Office bearer of formal organization | 8 | |
| Member of non-formal organization | 0 | |
| Office bearer of non-formal organization | 0 |
Table text extracted from the original PDF; superscript letters are shown inline. The original table image is below.
View original table image
References
13 in the original paper- Dhavale ND, Kapse PS, Lad AS. Awareness of farmers towards integrated farming system. The Pharma Innovation Journal. 2022;11(8):897-901.
- Diwan P, Upadhyay R, Maheshwari S. Knowledge of national rural livelihood mission among rural women of Udaipur district. International Journal of Home Science. 2017;3(2):631-634.
- Dreze J, Khare R. The Battle for Employment Guarantee. Frontline. 2009;26:4-26.
- Goswami P, Rajan P, Jaiswal DK. Effectiveness of Deendayal Antyodaya Yojana -National rural livelihoods mission on empowerment of women in Sagar District of Madhya Pradesh. Indian Journal of Extension Education. 2021;57(2):162-165.
- Gwary MM, Kwaghe PV, Jaafar-Furo MR, Dennis A. Analysis of entrepreneurial agricultural activities of youths in Michika Local Government Area of Adamawa State, Nigeria. Journal of Development and Agricultural Economics. 2011;3(3):91-97.
- Jagadeeswari BY. Empowerment of SHGs women members in Cuddalore district through Aajeevika - NRLM. International Journal of Business and Administration Research Review. 2015;2:15-21.
- Kemparaju BK, Khan RY. Impact of SGSY scheme on Rural Development in Uttara Kannada district of Karnataka state. International Journal of Research in Economics and Social Sciences. 2015;5:63-70.
- Mbah EN, Ezeano C, Odiaka EC. Analysis of rural youth's participation in family farming in Benue State, Nigeria: Implications for policy. Current Research in Agricultural Sciences. 2016;3(3):46-56.
- Pradhan S, Naberia S, Harikrishna YV, Jallaraph V. Socio-Economic correlates of livelihood security of small farmers in Jabalpur District of Madhya Pradesh. Indian Journal of Extension Education. 2021;57(3):57-59.
- Priyakumari SV, Karthik S. Impact of self-help group on economic empowerment of rural women -A study. Journal of Advanced Research in Dynamical & Control Systems. 2017;7(1):409-414.
- Prosper JK, Nathaniel NT, Benson HM. Determinants of rural youth's participation in agricultural activities. International Journal of Economics, Commerce and 2015;3:2348-2386.
- Rajpoot AS, Rajan P, Raut A, Srivastava A, Singh RB. Profile of National Rural Livelihood Mission (NRLM) beneficiaries in Madhya Pradesh. Asian Journal of Agricultural Extension, Economics & Sociology. 2023;41(11):249-257.
- Sunitha N, Sarah KT, Rani RN. Profile characteristics of farm women with reference to knowledge groups in Maheshwaram Mandal of Rangareddy District, India. International Journal of Current Microbiology and Applied Sciences. 2019;8(07):1597-1605.