
Research article · 2024 · Full text
International Journal of Advanced Chemistry ResearchEstimation of thyroid hormone and adipocytokine levels in men with obesity and type 2 diabetes in Thi-Qar Governorate
Volume 6(1) · Pages 05–14 · DOI: 10.33545/26646781.2024.v6.i1a.162 ↗
Research areasHuman Health and DiseaseLiver Disease Diagnosis and TreatmentDiet, Metabolism, and Disease
Abstract
Author-writtenBackground: Obesity is a common disease around the world and is considered a risk factor for developing type 2 diabetes, which is characterized by the body’s lack of response to the insulin produced, which leads to high blood sugar levels. Thyroid hormones also affect metabolic processes in the body and may play a role in causing obesity. This study is concerned with knowing the levels of thyroid hormones and adipocytokine levels and the relationship between them, to find out the causes of obesity and diabetes, or to identify risk factors for the purpose of developing solutions for them and eliminating complications and future problems caused by both diabetes and obesity. Aims of the study: The relationship between thyroid hormones and adipocytokine levels and their effect on obesity and diabetes in men. Methodology: A study using a case-control design. The study comprised a sample of 100 men who were obese and diagnosed with type 2 diabetes, alongside a control group of 50 men who were in good health. From October 10, 2023 to October 1, 2024, data was gathered from patients at Al-Habbobi Teaching Hospital, including their age, weight, and height. Fasting blood sugar was quantified using a spectrophotometer, HbA1c levels were measured using the AVIAS-6 device, and adipocytokines were assessed using the enzyme-linked immunosorbent assay. The levels of C-peptide and thyroid hormones were measured using COBAS. Results: The results showed that there is no statistical significance in age between the two groups. There is also a statistical significance in the body mass index between the two groups. The results showed that the levels of Leptin, Resistin, and Adiponectin showed a significant decrease in the obese group compared to the control group. FT4 levels also showed a significant decrease in the patient group compared to the control group. The levels of TSH and Free T3 were significantly increased in the obese group. Regarding cholesterol, HDL, and LDL, there are no statistical differences between the two groups. As for triglyceride-VLDL, HbA1c, fasting blood sugar, and C-peptide, the results showed a significant increase in the obese group compared to the control group. Conclusion: Adipocytokine levels showed a significant decrease in the obese diabetic group, and this indicates its role in controlling sugar levels and insulin sensitivity. As for thyroid hormones, the results showed a significant decrease in thyroxine levels. This indicates the effect of adipocytokines on thyroxine levels and that the relationship between them has an effective role in controlling obesity and diabetes.
Summary
Source-checkedPlain-language reading of the full paper, prepared with AI and checked against the text. Each point links to the authors' own words.
Why it matters
- Obesity is a global health issue and a known risk factor for type 2 diabetes, a condition where the body does not respond properly to insulin, resulting in elevated blood sugar. View evidence ↗
- Thyroid hormones are important because they influence metabolic processes and may contribute to the development of obesity. View evidence ↗
- Understanding the relationship between thyroid hormones and adipocytokines may help identify the causes and risk factors of obesity and diabetes to develop better solutions and prevent complications. View evidence ↗
The question
- The study aimed to investigate the relationship between thyroid hormones and adipocytokine levels and how they affect obesity and diabetes in men. View evidence ↗
What they did
- The researchers used a case-control design involving 100 obese men with type 2 diabetes and a control group of 50 healthy men. View evidence ↗
- Data including age, weight, and height were collected from patients at Al-Habbobi Teaching Hospital between October 10, 2023, and October 1, 2024. View evidence ↗
- The study measured fasting blood sugar via spectrophotometer, HbA1c using AVIAS-6, adipocytokines via ELISA, and C-peptide and thyroid hormones using the COBAS method. View evidence ↗
What they found
- The obese diabetic group had a significantly higher mean BMI (34.12±6.85 kg/m²) compared to the control group (23.78±0.95 kg/m², p<0.001). View evidence ↗
- Levels of leptin (109.73±20.76 vs 198.66±29.13 pg/ml), resistin (0.13±0.05 vs 0.21±0.07 ng/ml), and adiponectin (0.94±0.18 vs 1.53±0.21 ng/ml) were all significantly lower in the obese diabetic group than in the control group (p<0.001). View evidence ↗
- Obese diabetic patients showed significantly increased levels of FT3 (5.09±0.22 vs 3.12±0.19 pmol/L) and TSH (2.33±0.09 vs 1.27±0.42 μIU/mL) compared to controls (p<0.001). View evidence ↗
- FT4 levels were significantly lower in the obese diabetic group (13.64±0.41 pmol/L) compared to the control group (17.86±0.33 pmol/L, p<0.001). View evidence ↗
- Triglyceride (171.42±51.87 vs 110.73±13.65 mg/dl) and VLDL (33.75±10.52 vs 20.54±2.66 mg/dl) levels were significantly higher in the obese diabetic group (p<0.001). View evidence ↗
- Fasting blood sugar (183.65±31.75 vs 90.65±7.44 mg/dl), HbA1c (8.91±0.81 vs 5.44±0.66), and C-peptide (2.94±0.65 vs 0.86±0.42 ng/ml) were significantly increased in the obese diabetic group (p<0.001). View evidence ↗
What it means
- The authors conclude that decreased adipocytokine levels in obese diabetic patients indicate their role in insulin sensitivity and sugar control, and that the interaction between adipocytokines and thyroxine levels is effective in controlling obesity and diabetes. View evidence ↗
Visual summary
3 visualsIllustrations explain the paper; charts are replotted from the paper's own table values.
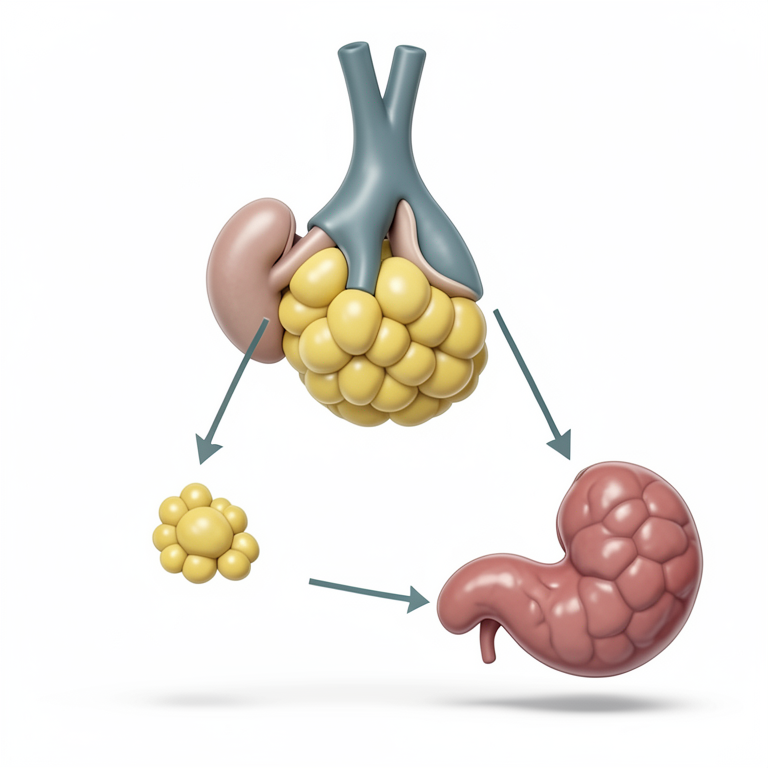
Interplay of Hormones in Obesity and Diabetes
AI-generated conceptual illustration (Human thyroid gland, adipose tissue, and pancreas). It explains the idea and does not show study data.
View source evidence ↗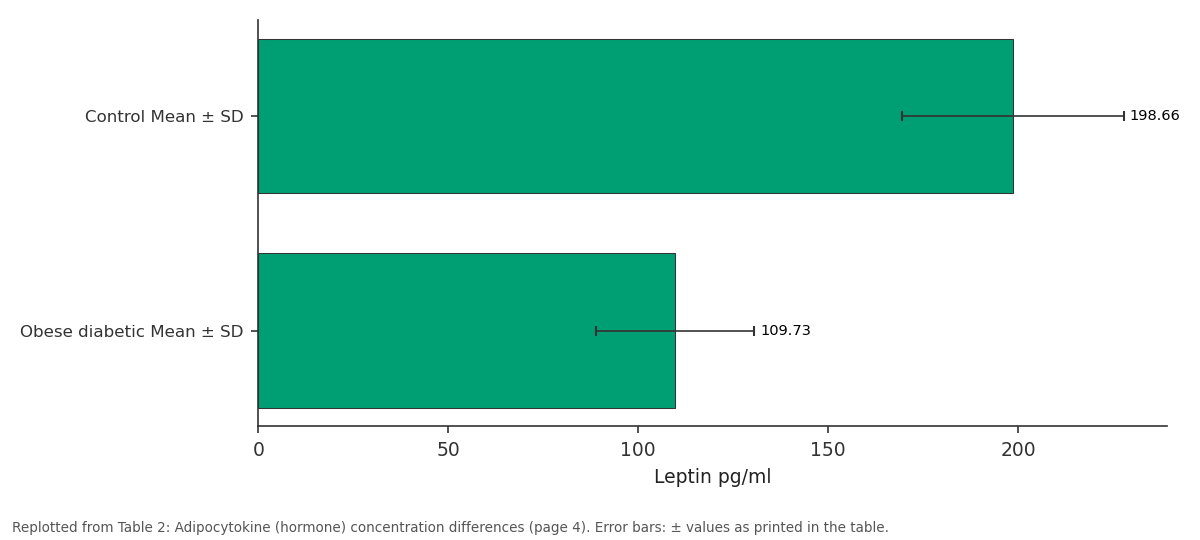
Leptin pg/ml: Control Mean ± SD vs Obese diabetic Mean ± SD
Replotted from Table 2 (page 4) of the original paper. Every bar is the paper's own table value.
View source evidence ↗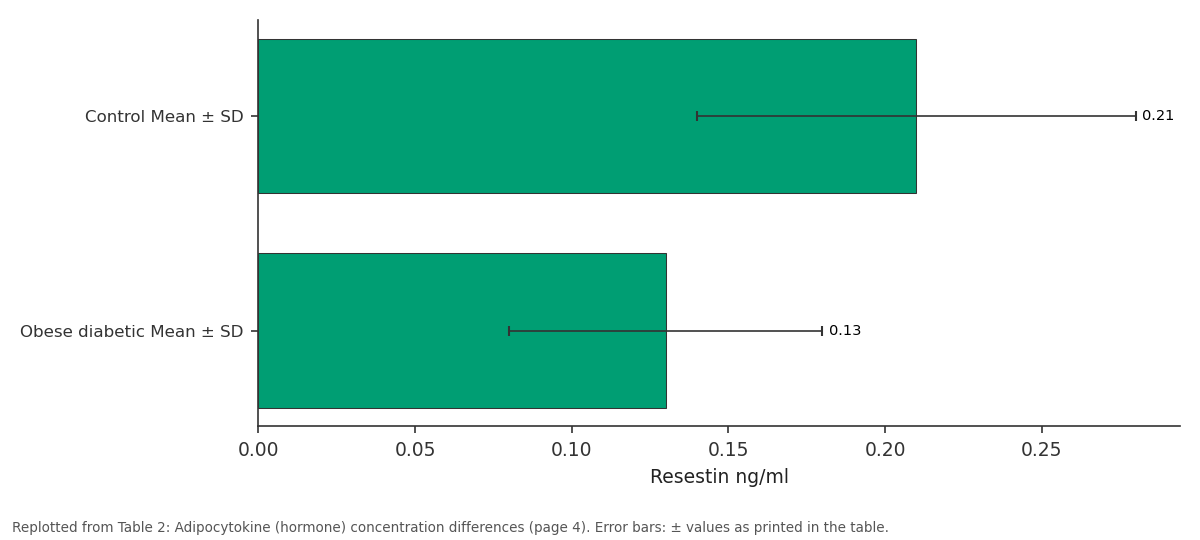
Resestin ng/ml: Control Mean ± SD vs Obese diabetic Mean ± SD
Replotted from Table 2 (page 4) of the original paper. Every bar is the paper's own table value.
View source evidence ↗Figures & tables
From the original paper Table 1
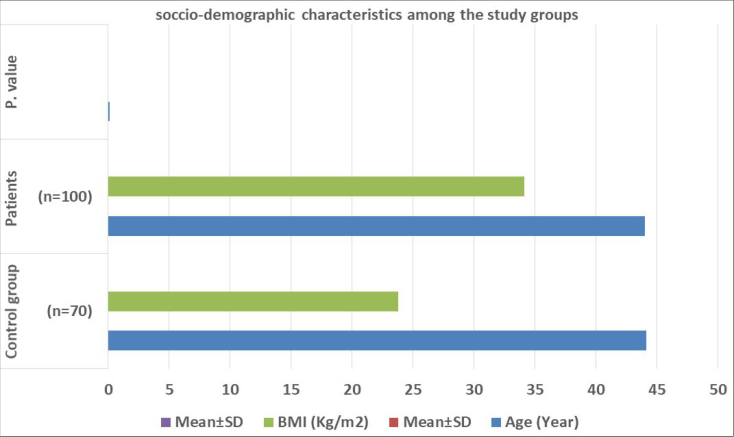 Figure 1
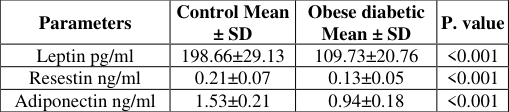 Table 2
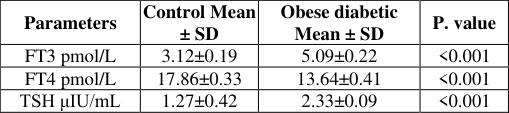 Table 3
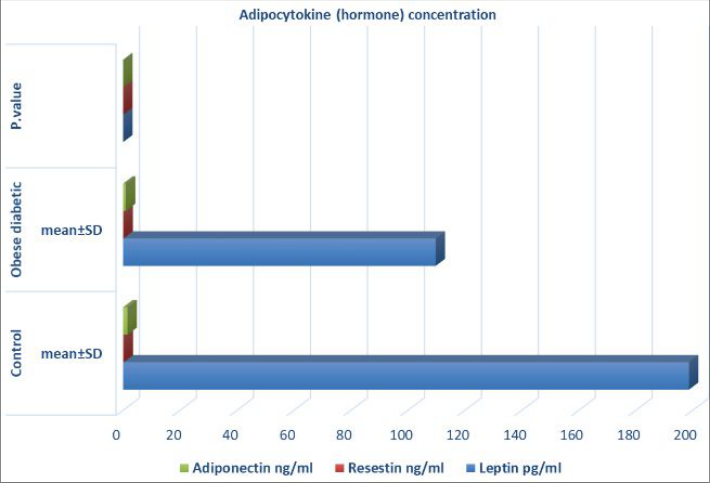 Figure 2
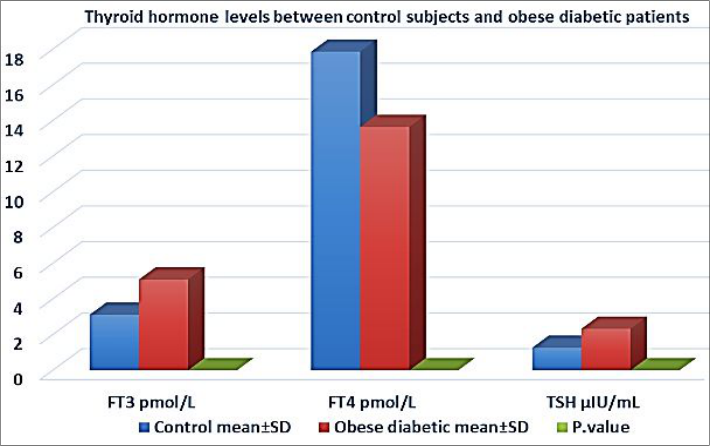 Figure 3
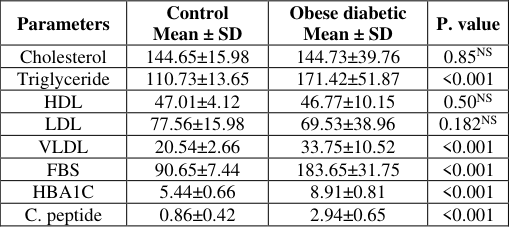 Table 4
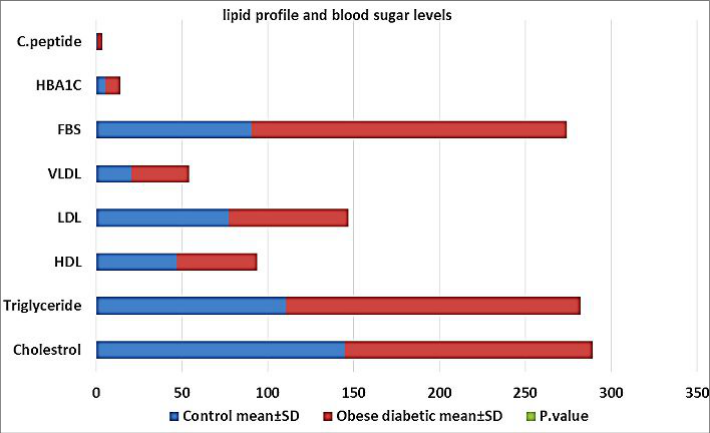 Figure 4
Introduction
A lot of people who have Type 2 Diabetes Mellitus (T2DM) are also overweight or obese. The American Diabetes Association and the American Obesity Association have set guidelines for how to treat obesity in people with type 2 diabetes. This includes making changes to your lifestyle, using medicine to help, and, if needed, looking into surgical options. Global leaders got together at the Second Diabetes Surgery Summit in 2016 to make a plan for how to treat people with diabetes and obesity who are having metabolic and bariatric surgery [1] . Less than 18.5 kg/m and more than 35 kg/m increases men's lifetime risk of diabetes from 7% to 70%. Using the same BMI values, females' lifetime diabetes risk rises from 12% to 74%. Thus, obese patients should be screened for diabetes. Type 2 Diabetes Mellitus prevention and treatment require obesity management. Diabetes rates drop significantly in atrisk populations after weight loss. One study found that losing 5-10% of starting weight and exercising 150 minutes per week reduced diabetes by more than 50% [2,3] . Insulin, synthesized by β cells in the islets of Langerhans, controls the metabolic processes of carbohydrates, proteins, and lipids. This is achieved by enhancing the absorption of molecules such as glucose from the blood into adipose tissue, skeletal muscle cells, and the liver. Insulin resistance, which hampers the metabolic functions of insulin, is mainly caused by a decrease in insulin signalling, particularly in the Insulin Receptor Substrate (IRS)/phosphoinositide-3-kinase (PI-3K)/Protein Kinase B (PKB) pathway. The numerical value is two. Obesity is commonly associated with insulin resistance, which increases the likelihood of developing type 2 diabetes mellitus [4,5] .
Obesity is defined as a significant increase in adipose tissue caused by a high nutrient intake and low energy expenditure. Diabetes mellitus, on the other hand, is a complex and long-term disease characterized by elevated blood glucose levels (hyperglycemia) caused by insufficient insulin secretion, function, or both. Obesity may cause persistent and mild inflammation throughout the body, leading to insulin resistance and diabetes mellitus. However, the precise mechanism underlying this relationship is not yet completely understood [6] . Moreover, insulin resistance and hyperinsulinemia play an active role in the onset and advancement of obesity. The purpose of this review is to explain the mechanisms through which obesity-related insulin resistance develops in type 2 diabetes mellitus. These mechanisms include the activation of inflammation, dysfunction of adipocytes, oxidative stress, endoplasmic reticulum stress (ER stress), ageing, hypoxia, and changes in genetic composition. Investigating the malfunction of insulin signalling, which is linked to diabetes caused by obesity, holds promise for developing more effective pharmacological strategies to manage and prevent obesity and type 2 diabetes [7] .
There is a strong relationship between body composition and thyroid hormones. Thyroid hormones regulate the fundamental rate of metabolism, heat production, lipid and glucose processing, food consumption, and fat breakdown. Thyroid dysfunction is associated with changes in body weight and composition, body temperature, and total energy expenditure, both at rest and during physical activity [8] . Hypothyroidism has been linked to decreased thermogenesis and metabolic rate, as well as a positive correlation with higher BMI and obesity prevalence [9] . Clinical evidence shows that even minor thyroid dysfunction, specifically subclinical hypothyroidism, is associated with significant changes in body weight and is a risk factor for overweight and obesity. Nonetheless, this issue remains unclear. Even minor changes in serum TSH levels caused by minor adjustments in L-T4 dosage during replacement therapy have been shown to have a significant impact on Resting Energy Expenditure (REE) in hypothyroidism. Nonetheless, there is a lack of data on the precise magnitude of weight gain and loss associated with L-T4 treatment in hypothyroidism patients [10] . The Obese (ob) gene produces leptin, a peptide hormone released by fat cells. Leptin is best known for regulating appetite, neuroendocrine function, and energy balance.
Nonetheless, it appears to affect a variety of other physiological processes. These functions include metabolism, endocrine regulation, and immune function, among others, and may not be fully comprehended. Leptin irregularities are linked to a variety of metabolic disorders, including obesity. The physiology of leptin has helped us understand how energy balance is regulated. This research is likely to play an important role in developing a successful treatment and solution to the growing obesity problem. The total Body fat Mass Index (BMI), metabolic hormones, and gender are the primary influences on circulating plasma leptin concentrations. Women have higher levels of circulating leptin compared to men [11] . Resistin, which is also called "insulin resistance," was first found in mice in 2001. It got its name from the fact that it can stop insulin from working. At first, it was thought that there might be a link between obesity and diabetes. There are other names for resistin, such as inflammatory zone 3 and adipocyte-secreted factor [12] . It is a member of the Resistin-Like Molecule (RLM) family, which has distinct expression patterns and biological effects.
Resistin is expressed by several cell types, including adipocytes, intestinal epithelium, skeletal muscle cells, and possibly astrocytes [13] . White adipose tissue is where mouse resistin comes from. The resistin protein from mice is an 11 kDa polypeptide that is high in cysteine. The gene on chromosome 8 that makes this protein is located there. A precursor made up of 114 Amino Acids (AA) is needed to make this substance. It has a 20-aa signal sequence and a 94-aa mature segment. It has five disulfide bonds inside the molecule and many β-turns [14] . Through disulfide and non-disulfide bonds, resistin can form homodimers or multimers of different sizes. But it's possible that the formation of these dimers or multimers is not needed for it to work biologically. 72% of the amino acids in the mature segments of mice and rats are the same.
Resistin stops skeletal muscle in rats from taking in glucose when insulin is present [15] . ApN is a protein found in the adipose tissues. It is made up of 247 amino acids and has a molecular weight of 30 kDa in mice. It is made up of 244 amino acids and has a molecular weight of 28 kDa. ApN protein has four parts: an NH2terminal signal region, a species-specific variable region, a collagenous domain, and a COOH-terminal globular domain [16] . Multiple studies have found a clear inverse relationship between circulating ApN levels and insulin resistance in conditions associated with a high risk of cardiovascular disease, including obesity, metabolic syndrome, and Type 2 Diabetes Mellitus (T2DM) [17] . The question concerns understanding the significance of this interaction. Mice lacking the ApN gene exhibit insulin resistance in the liver but not elsewhere in the body. This leads to a 65% increase in glucose production, specifically in the liver. Individuals who consume a high-saturated-fat diet develop carbohydrate intolerance. However, this can be corrected by promptly administering recombinant ApN, which has no effect on muscle glucose uptake. The expression of gluconeogenesis enzymes, specifically phosphoenol-carboxykinase and glucose-6-phosphatase, increases in the liver following this administration. However, there is no change in insulinemia, indicating improved insulin sensitivity [18] . Furthermore, the discovery of elevated ApN levels in people with severe insulin resistance lends credence to the theory that ApN has an insulin-sensitizing effect [19] .
Thyroid dysfunction and diabetes are the two most common endocrine disorders that have a significant impact on cardiovascular health. Diabetes is a major global epidemic. Diabetes has become more common worldwide as obesity rates have risen and lifestyle patterns have changed. In 2017, a staggering 425 million people worldwide were diagnosed with diabetes mellitus. Diabetes is currently on the rise worldwide, with a projected 366 million cases by 2030, affecting 44% of people of all ages. In the United States and Europe, however, thyroid dysfunction affects 6.6% of adults. This rate tends to rise with age and is more common in women than men [20] . Thyroid disorders are much more common in people with Type 2 Diabetes Mellitus (T2DM), with rates ranging from 9.9% to 48%. Furthermore, research has shown that thyroid dysfunction affects 13.4% of people with diabetes, with females having a higher prevalence (31.4%) than males [21] .
There is much evidence indicating a relationship between thyroid hormones and type 2 diabetes. Some studies have shown that thyroid hormone plays an important role in glucose metabolism and pancreatic function. While diabetes can impair thyroid function, a study found that in diabetics, the "TSH response to thyrotropin-releasing hormone" is reduced, leading to lower T 3 levels and the development of hypothyroidism [22] . Low T 3 levels in diabetics may reduce the conversion of T 3 from T 4 . This is based on observations of a reversible decrease in hepatic parathyroid hormone concentration and deiodinase activity induced by hyperglycemia. Additional research has shown that high T 3 levels, even for a short time, can cause insulin resistance, which contributes to the development of Type 2 Diabetes Mellitus (T2DM) [23] .
Methodology
Case-control study. This study included 100 samples from men who suffered from obesity and type 2 diabetes and 50 samples from healthy men who did not suffer from any disease and were in good health. The samples were agematched. Samples were collected from patients who visited Al-Habbobi Teaching Hospital for the period between 10/10/2023 and 10/1/2024, and complete information was taken from the patients, including age, weight, and height. A 5 ml blood sample was drawn from each participant. 2 ml was placed in the EDTA tube to calculate the HbA1c within 30 min of collecting the sample, and 3 ml was placed in a gel tube and left for 30 min at room temperature until clotting, after which it was quickly separated using a centrifuge. 3000 rpm for 15 minutes, and the blood serum was separated and frozen until use. The fasting blood sugar level was quantified utilizing a spectrophotometer, the HbA1c level was determined utilizing the AVIAS-6 device, and the adipocytokine level was assessed using enzymelinked immunosorbent assay. The levels of thyroid hormones and C-peptide were assessed using the COBAS method. Ages less than 30 years were excluded, and women and thyroid diseases were excluded.
Statistical analysis
The determination of statistically significant differences was conducted using SPSS (Version 26).
Results
Results
Differences in the anthropic-demographic characteristics among the study groups
The table compares the characteristics (age and BMI) of the control group and patients. For age, the Mean ± SD in the control group was 44.14±4.87 years, while in the patients group, it was 43.98±7.88 years. The difference was not statistically significant with a p-value of 0.11. Regarding BMI, the Mean ± SD in the control group was 23.78±0.95 kg/m 2 , whereas in the patients group, it was significantly higher at 34.12±6.85 kg/m 2 (p<0.001). This indicates a significant difference in BMI between the two groups, with the patients having a higher BMI compared to the control group. These results suggest that there is a significant difference in BMI between the control group and patients, indicating a potential association between the infection with the Ascaris worm and higher BMI. However, no significant difference was observed in age between the two groups.
Differences of the adipocytokine (Hormone) levels between control and obese diabetic patient
According to Table 2, the levels of leptin, resistin, and adiponectin were significantly lower in the obese diabetic patients compared to the control group. The p-values for these three markers were 198.66±29.13, 109.73±20.76 pg/ml, 0.21±0.07, and 1.53±0.21 ng/ml, respectively, with a significance level of p<0.001.
| Parameters | Control Mean ± SD | Obese diabetic Mean ± SD | P. value |
|---|---|---|---|
| Leptin pg/ml | 198.66±29.13 | 109.73±20.76 | <0.001 |
| Resestin ng/ml | 0.21±0.07 | 0.13±0.05 | <0.001 |
| Adiponectin ng/ml | 1.53±0.21 | 0.94±0.18 | <0.001 |
Table text extracted from the original PDF; superscript letters are shown inline. The original table image is below.
View original table image
Differences of the thyroid Hormone levels between control and obese diabetic patient
According to the data in Table 3, it is evident that obese diabetic patients exhibit considerably higher FT3 levels compared to the control group (5.09±0.22 pmol/L vs. 3.12±0.19 pmol/L, p<0.001). The study revealed a noteworthy decline in FT4 levels among obese diabetic patients when compared to the control group. The average value of the first group was 13.64±0.41 pmol/L, whereas the second group had an average value of 17.86±0.33 pmol/L. The difference was highly significant with a p-value of less than 0.001. Obese diabetic patients exhibit markedly elevated TSH levels (2.33±0.09 μIU/mL) in comparison to the control group (1.27±0.42 μIU/mL, p<0.001).
| Parameters | Control Mean ± SD | Obese diabetic Mean ± SD | P. value |
|---|---|---|---|
| FT3 pmol/L | 3.12±0.19 | 5.09±0.22 | <0.001 |
| FT4 pmol/L | 17.86±0.33 | 13.64±0.41 | <0.001 |
| TSH μIU/mL | 1.27±0.42 | 2.33±0.09 | <0.001 |
Table text extracted from the original PDF; superscript letters are shown inline. The original table image is below.
View original table image
Discussions
After analyzing the leptin concentrations in the study groups, it was discovered that the diabetic obese group had a significantly lower leptin concentration than the control group. The statistical analysis revealed a highly significant difference between the two groups (P value < 0.001). This research agrees with [24] . Which showcased the OB gene encodes leptin, a peptide hormone released by adipocytes. Leptin appears to affect a variety of physiological systems, despite its well-known role in hunger regulation, neuroendocrine function, and energy balance. Aside from metabolic processes, endocrine regulation, and immune function, there may be other roles that have yet to be identified. The metabolic diseases and obesity are associated with leptin deficiency [25] .
The absence of leptin leads to a range of clinical characteristics including severe obesity, reduced feeling of fullness, excessive appetite, persistent search for food, repeated bacterial infections, high levels of insulin in the blood, accumulation of fat in the liver, abnormal lipid levels, and impaired reproductive function. These phenotypes serve as a reminder of the numerous different function's leptin plays in the body, many of which are currently poorly understood and being studied. Congenital Leptin Deficiencies (CLD) arise from mutations in the LEP or LR genes and present during prenatal development as low levels of leptin in the blood [26] .
Genetic abnormalities in the leptin system can cause obesity and leptin deficiency in humans. The efficacy of leptin in treating the endocrine and metabolic consequences of morbid obesity in adults is still debated [27] . This study demonstrates that administering leptin to adults with morbid obesity and leptin deficiency leads to substantial weight reduction, heightened physical activity, alterations in endocrine function and metabolism (including the resolution of type 2 diabetes mellitus and hypogonadism), and favorable impacts on both eating and non-eating behaviors. The findings indicate that the leptin pathway has a substantial impact on the control of body weight, gonadal function, and behavior in adults [27] . This search is not compatible with [28] . The primary function of leptin is to maintain the balance between food intake and energy expenditure. Leptin's primary physiological function is to communicate to the brain the amount of energy available for long-term use [29] . Less body fat reduces blood-brain barrier leptin transport.
The CNS detects a drop in leptin levels as an indicator of low energy and triggers a series of responses to help the body adapt to fasting. Energy deficits affect several physiological processes. Growth, energy expenditure, thyroid and reproductive hormone levels, and sympathetic nervous system activity decrease. The central nervous system increases hunger as a defense. Leptin signals starvation, which increases food intake and decreases energy expenditure. When serum leptin levels drop, the brain senses a food shortage [29,30] . Excess adipose tissue is associated with insulin resistance, a common feature of metabolic diseases, and is also responsible for increased plasma leptin levels [31] . A high body fat content is logically associated with a proportional increase in leptin production. Regardless of BMI, the association with insulin suggests that leptin may play a role in insulin resistance or hyperinsulinemia [31,32] .
The study found that individuals with diabetes and obesity had significantly lower levels of resistin than the control group. The difference was statistically significant (p<0.001). This research agrees with [33] .
The findings suggest that individuals with obesity have lower resistin levels, which may contribute to the link between obesity and type 2 diabetes mellitus. Nonetheless, compelling evidence suggests that weight loss does not always result in lower levels of serum resistin; In fact, some studies show that weight loss is associated with significant increases in this protein [34] .
Recent studies have shown that resistin is expressed in a variety of tissues, not just those associated with obesity, such as adipocytes. This calls into question the notion that resistin is solely responsible for the link between obesity and Type 2 Diabetes Mellitus (T2DM), creating even more uncertainty [34] .
Obese women showed a correlation between resistin levels and Waist Circumference (WC) and fat mass. However, there was no correlation with Body Mass Index (BMI) [35] . Expressed in human adipocytes, pancreatic cells, muscle, and mononuclear cells, this polypeptide consists of 108 amino acids. Peripheral Blood Mononuclear Cells (PBMCs) play a crucial role in producing resistin in humans. Multiple studies have demonstrated the significance of its role in inflammatory processes [36] . This search is not compatible with [37] . According to this human study, there is a positive correlation between an elevation in resistin levels and an increase in body mass index [38] . While there is an association between increased serum resistin levels and obesity, it remains uncertain whether this mechanism directly contributes to the insulin resistance observed in obese individuals. Multiple researchers have independently discovered positive correlations between resistin levels and insulin resistance, thus confirming this relationship [39] . The association between obesity and T2DM, known as the resistin connection theory, is supported by a substantial amount of evidence. Nevertheless, there is a lack of agreement among scientists regarding this hypothesis, and an increasing amount of research contradicts it [40] . The diabetic obesity group had significantly lower adiponectin levels than the control group (p<0.001). The search results correspond with [41] . Adiponectin levels were significantly lower in the obese group than in the control group, according to the findings. A serious health concern, obesity increases the risk of developing cancer, diabetic retinopathy, cardiovascular disease, and respiratory issues. Obese people's visceral body fat can have an impact on their health because it causes abnormal adipokine production. Adiponectin regulates energy metabolism. Obesity reduces total and High Molecular Weight (HMW) adiponectin concentrations, whereas weight loss increases these concentrations.
Furthermore, both overall and weight-loss adiponectin levels are negatively correlated with body mass index, glucose, insulin, triglyceride levels, insulin resistance score, and, most significantly, visceral fat accumulation [41] . Insulin stimulates adiponectin release in 3T3-L1 adipocytes derived from murine fat, non-pregnant animals, and humans [42] . Only half of the adiponectin protein produced and released is synthesized, implying that breakdown mechanisms play an important role in controlling adiponectin secretion. Insulin inhibits the Ubiquitin-Proteasome System (UPS), which slows protein breakdown in cells outside the pancreas. The Ubiquitin-Proteasome System (UPS) is a highly regulated pathway that degrades ubiquitinated proteins. According to research, the Ubiquitin-Proteasome System (UPS) regulates the breakdown of adiponectin protein in non-pregnant mice. This suggests that UPS activity contributes to the reduction in adiponectin levels in the bloodstream observed in obese people. Currently, it is unknown whether UPS has control over adiponectin degradation in humans. Furthermore, the regulatory processes that control adiponectin ubiquitination remain poorly understood. In non-pregnant obese people, adipose tissue shows inflammation and Endoplasmic Reticulum (ER) stress, which are pathological conditions that impair insulin signalling and disrupt glucose and lipid homeostasis throughout the body [43] . This search is not compatible with [41] . According to one individual, adiponectin is one of the hormones with the highest concentrations in the plasma. Weight loss or caloric restriction causes an increase in adiponectin levels, which is linked to improved insulin sensitivity. Adipocytes secrete adipokines, which influence insulin sensitivity and energy homeostasis throughout the body.
Adiponectin is an adipokine that helps skeletal muscle, liver, and adipose tissue respond to insulin. Pregnancy-related insulin resistance has been linked to lower levels of adiponectin in the mother's blood [44] . Moreover, pregnant women who exhibit low levels of adiponectin in their bloodstream are at a higher risk of giving birth to infants with atypical growth patterns. Furthermore, pregnant women with obesity or Gestational Diabetes Mellitus (GDM) have lower levels of circulating adiponectin [44] . Adiponectin's ability to lower levels of inflammatory cytokines and oxidative stress improves insulin sensitivity.
Adiponectin lowers blood glucose levels because of its ability to reduce insulin resistance, increase glucose uptake in skeletal muscle, decrease hepatic glucose synthesis, and improve fatty acid utilization. The protective effects of adiponectin on β cells may serve as a preventive measure against diabetes [45] .
The study found that all groups had higher FT3 hormone levels than the control group. Statistical calculations verified this with a significance level of p<0.001. Results indicate a significant decrease in FT4 in all study groups compared to the control group (p<0.001). The study found a significant increase in TSH levels in all groups compared to the control group (p<0.001). This search yielded coherent and consistent results [46] . Although some studies have not established a correlation between slight variations in thyroid function within the normal range and weight gain, other studies have demonstrated this association. Studies have demonstrated a negative association between free T 4 (fT4) and Body Mass Index (BMI), even when fT4 levels are within the normal range. Nevertheless, there is a correlation between the buildup of fat and decreased levels of fT4, as well as increased levels of TSH and FT3, in individuals who are slightly overweight but have normal thyroid function. Changes in energy expenditure, which can be attributed to abnormal thyroid function with normal feedback control, can lead to increases in body mass index and weight [47] . that the alternative result exhibited Individuals who are obese, including children, adolescents, and adults, exhibit higher levels of Thyroid-Stimulating Hormone (TSH) which are directly correlated with their Body Mass Index (BMI). Furthermore, it has been observed that individuals who are obese often exhibit low levels of fT4, accompanied by a modest increase in T3 or fT3 concentrations [47] .
Various studies conducted on adult obese patients have revealed varying levels of thyroid hormone and TSH, which can be either normal, elevated, or reduced. This contradicts the commonly held belief that obese individuals typically exhibit high TSH, low fT4, and high fT3 levels. The origins of these changes in thyroid function are currently unknown.
One hypothesis suggests that an increased rate of conversion from T4 to T3 may be attributed to heightened deiodinase activity. It is believed that in individuals who are obese, this mechanism serves as a protective measure that can impede or halt the advancement of obesity by increasing energy expenditure [48] . The expression of sodium/iodide symporter mRNA and the activity of iodide uptake is inhibited by inflammatory cytokines, such as tumor necrosis factor-alpha, interleukin-1, and interleukin-6, which are released from adipose tissue. Medical practitioners should remain vigilant for thyroid dysfunction in their obese patients due to the high occurrence of both obesity and thyroid dysfunction. Thyroid hormones have been inappropriately and frequently used in attempts to cause weight loss in obese individuals with normal thyroid function, despite the fact that only obese individuals with an underactive thyroid have a legitimate reason to use them for regulating body weight. There is insufficient evidence to support the effectiveness of longterm administration of thyroid hormones for weight loss in individuals who are overweight but do not have thyroid dysfunction. Moreover, there is a potential for adverse effects when these hormones are used for an extended duration [49] . The majority of individuals who are obese exhibit slightly increased levels of TSH, but do not display any noticeable thyroid dysfunction according to prominent studies involving overweight children and adults. Subsequent investigations have shown that the observed increase in TSH blood levels cannot be attributed to a lack of iodine or autoimmune thyroiditis [46] . Adipocytokines serve as a connection between thyroid hormones and obesity. There is increasing evidence that shows a connection between obesity and slightly higher levels of TSH, fT3, and REE. However, the specific physiological mechanisms that link fat to elevated thyroid hormone levels are not yet fully understood. Leptin has demonstrated potential as a mediator linking obesity and thyroid hormones [50] . The body's response to changes in diet may be influenced by the regulation of various levels within the thyroid system. The release of TSH from the pituitary gland is controlled by thyrotropin-releasing hormone, which is a neuropeptide synthesized in the hypothalamic Paraventricular Nucleus (PVN). Thyroid-Stimulating Hormone (TSH) triggers the synthesis and release of thyroxine (T 4 ) and triiodothyronine (T 3 ) by attaching to receptors located on the thyroid gland. Deiodinases, a group of enzymes, convert T 4 into either T 3 or inactive reverse T 3 . In cases of primary hypothyroidism, a decrease in T 4 levels is accompanied by an inherent dysfunction in the thyroid, which initiates a dual compensatory reaction. When thyroid hormones fail to exert negative feedback, the expression of TRH increases in the hypothalamic Paraventricular Nucleus (PVN). Increased production of Thyrotropin-Releasing Hormone (TRH) and decreased inhibitory effect of thyroid hormones on the genes responsible for producing Thyroid-Stimulating Hormone (TSH) subunits both contribute to the heightened production of TSH in the pituitary thyrotroph. Elevated levels of Thyroid-Stimulating Hormone (TSH) are considered the most reliable indicator of thyroid failure, as it stimulates the malfunctioning thyroid gland [51] . This search is not compatible with [52] . Research has shown a positive relationship between the ratio of fT3 to fT4 and both waist circumference and body mass index in obese patients. In cases of obesity, alterations in free and total T4 levels usually do not coincide with a slight increase in TSH levels. Lean and obese individuals exhibit comparable levels of both Total T 4 and FT4. Excluding the likelihood of severe hypothyroidism despite a slightly increased TSH in adipose tissue [46] . The research findings indicated that there was no significant difference in the levels of cholesterol, HDL, and LDL between the obese diabetes group and the control group (p>0.05 for all variables). Triglyceride and VLDL levels increased significantly in comparison to the control group (P 0.001), according to the study. The findings agree with [53] . Individuals with obesity often exhibit lipid abnormalities, such as elevated triglyceride, very Low-Density Lipoprotein (VLDL), and High-Density Lipoprotein (HDL) levels, as well as a reduction in the occurrence of small, dense LDL particles. Small compact LDL particles are considered more pro-atherogenic than large LDL particles due to several reasons. Small, dense LDL particles have a lower attraction to the LDL receptor, resulting in a longer circulation time. Additionally, these smaller particles have a greater ability to enter the artery wall and bind more readily to proteoglycans within the artery, resulting in their entrapment.
Macrophages have an increased propensity to engulf small, compact LDL particles when they undergo oxidation [54] .
There is a positive correlation between the magnitude of BMI increase and the severity of lipid level abnormalities. Around 60-70% of obese patients exhibit dyslipidemia, whereas approximately 50-60% of overweight patients experience dyslipidemia. This dyslipidemia partially contributes to the heightened susceptibility to cardiovascular disease in obese patients [54] .
It is crucial to acknowledge that the impact of obesity on lipid metabolism differs based on the location of the surplus fat storage. Elevated levels of visceral fat and subcutaneous fat in the torso, especially in the upper torso, are associated with reduced levels of High-Density Lipoprotein Cholesterol (HDL-C) and increased levels of Low-Density Lipoprotein Cholesterol (LDL-C). Individuals with greater amounts of subcutaneous adipose tissue in their legs generally exhibit lower or normal levels of triglycerides [55] .
International Journal of Advanced Chemistry Research https://www.chemistryjournals.net
The dyslipidemia commonly seen in obesity is caused by multiple factors, including excessive production of VLDL by the liver, reduced breakdown of circulating TG lipids, impaired trapping of FFA in peripheral tissues, increased movement of FFA from fat cells to the liver and other tissues, and the creation of small, dense LDL particles [56] .
Obese individuals frequently experience dyslipidemia as a result of a combination of irregularities. The problems are caused by a combination of elevated delivery of free fatty acids to the liver due to overall and abdominal fat accumulation, reduced sensitivity to insulin, and an inflammatory condition resulting from the infiltration of macrophages into adipose tissue. The liver's excessive production of Very Low-Density Lipoprotein (VLDL) particles is a crucial malfunction that leads to elevated levels of triglycerides in the bloodstream. The user's text is empty. The rate of triglyceride synthesis in the liver directly affects the speed at which very low-density lipoprotein particles are released. Excessive triglycerides inhibit the breakdown of Apo B-100 in the liver, resulting in increased formation and secretion of VLDL [53] .
Morbidly obese patients exhibit an increase in Apo C-III levels. The presence of high levels of Apo C-III in obese individuals can be attributed to insulin resistance, as insulin suppresses the expression of Apo C-III. Apo C-III inhibits the activity of lipoprotein lipase, which can result in reduced removal of lipoproteins that are rich in triglycerides. Furthermore, Apo C-III inhibits the cellular uptake of triglyceride-rich lipoproteins [57] . On the contrary, the results of this search do not match [58] .
Recent research has established a correlation between Apo C-III loss-of-function mutations and reduced serum triglyceride levels as well as a decreased likelihood of developing cardiovascular disease. Interestingly, the ability of Apo C-III to change levels of triglycerides in the blood is not solely based on its effect on lipoprotein lipase activity. This is evident from the fact that patients who have a deficiency in lipoprotein lipase still experience a decrease in triglyceride levels when Apo C-III expression is inhibited [59] . Adipomectin reduces triglyceride levels by increasing the activity of lipoprotein lipase and decreasing the levels of Apo C-III [60] , which is an inhibitor of lipoprotein lipase [61] .
Ethical considerations
All of the parents and caregivers of the patients who participated in the study signed a written consent form that included illustrations. According to the ethical guidelines outlined in the Declaration of Helsinki, (1964), this study was carried out in accordance with the principles that govern medical research that involves human participants.
The ethical and research committee of Al-Habbobi Teaching Hospital gave their approval, which was found to be in accordance with ethical standards.
Conclusion
The study findings indicate that diabetic obese individuals have significantly lower levels of leptin compared to the control group, with a highly significant statistical difference (p< 0.001
Figures and tables from the paper
| Parameters | Control Mean ± SD | Obese diabetic Mean ± SD | P. value |
|---|---|---|---|
| Cholesterol | 144.65±15.98 | 144.73±39.76 | 0.85NS |
| Triglyceride | 110.73±13.65 | 171.42±51.87 | <0.001 |
| HDL | 47.01±4.12 | 46.77±10.15 | 0.50NS |
| LDL | 77.56±15.98 | 69.53±38.96 | 0.182NS |
| VLDL | 20.54±2.66 | 33.75±10.52 | <0.001 |
| FBS | 90.65±7.44 | 183.65±31.75 | <0.001 |
| HBA1C | 5.44±0.66 | 8.91±0.81 | <0.001 |
| C. peptide | 0.86±0.42 | 2.94±0.65 | <0.001 |
Table text extracted from the original PDF; superscript letters are shown inline. The original table image is below.
View original table image
References
59 in the original paper- Cohen RV, Shikora S, Petry T, Caravatto PP, Le Roux CW. The Diabetes Surgery Summit II Guidelines: A Disease-Based Clinical Recommendation. Obesity Surgery. 2016;26(8):1989-1991.
- Narayan KM, Boyle JP, Thompson TJ, Gregg EW, Williamson DF. Effect of BMI on lifetime risk for diabetes in the U.S. Diabetes Care. 2007;30(6):15621566.
- Knowler WC, Barrett-Connor E, Fowler SE, Hamman RF, Lachin JM, Walker EA, et al., Diabetes Prevention Program Research Group. Reduction in the incidence of type 2 diabetes with lifestyle intervention or metformin. The New England Journal of Medicine. 2002;346(6):393-403.
- Wilcox G. Insulin and insulin resistance. Clinical Biochemist Reviews. 2005;26(2):19.
- Ginsberg HN. Insulin resistance and cardiovascular disease. Journal of Clinical Investigation. 2000;106(4):453.
- Christopher B, Newgard CB. Molecular and metabolic mechanisms of insulin resistance and β-cell failure in type 2 diabetes. Nature Reviews Molecular Cell Biology. 2008;9(3):193-205.
- Hardy OT, Czech MP, Corvera S. What causes the insulin resistance underlying obesity? Current Opinion in Endocrinology, Diabetes and Obesity. 2012;19(2):81.
- Rosenbaum M, Hirsch J, Murphy E, Leibel RL. Effects of changes in body weight on carbohydrate metabolism, catecholamine excretion, and thyroid function. The American Journal of Clinical Nutrition. 2000;71(6):1421-1432.
- Danforth E, Jr, Horton ES, O'Connell M, Sims EA, Burger AG, Ingbar SH, et al. Dietary-induced alterations in thyroid hormone metabolism during overnutrition. The Journal of Clinical Investigation. 1979;64(5):1336-1347.
- Knudsen N, Laurberg P, Rasmussen LB, Bülow I, Perrild H, Ovesen L, et al. Small differences in thyroid function may be important for body mass index and the occurrence of obesity in the population. The Journal of Clinical Endocrinology & Metabolism. 2005;90(7):4019-4024.
- Grinspoon S, Gulick T, Askari H, Landt M, Lee K, Anderson E, et al. Serum leptin levels in women with anorexia nervosa. The Journal of Clinical Endocrinology and Metabolism. 1996;81(11):38613863.
- Rajala MW, Lin Y, Ranalletta M, Yang XM, Qian H, Gingerich R, et al. Cell type-specific expression and coregulation of murine resistin and resistin-like International Journal of Advanced Chemistry Research https://www.chemistryjournals.net molecule-alpha in adipose tissue. Molecular Endocrinology. 2002;16(8):1920-1930.
- Morash BA, Willkinson D, Ur E, Wilkinson M. Resistin expression and regulation in mouse pituitary. FEBS Letters. 2002;526(1-3):26-30.
- Pravenec M, Kazdová L, Landa V, Zidek V, Mlejnek P, Jansa P, et al. Transgenic and recombinant resistin impair skeletal muscle glucose metabolism in the spontaneously hypertensive rat. Journal of Biological Chemistry. 2003;278(46):45209-45215.
- Wong GW, Wang J, Hug C, Tsao TS, Lodish HF. A family of Acrp30/adiponectin structural and functional paralogs. Proceedings of the National Academy of Sciences. 2004;101(28):10302-10307.
- Bastard JP, Maachi M, Lagathu C, Kim MJ, Caron M, Vidal H, et al. Recent advances in the relationship between obesity, inflammation, and insulin resistance. European Cytokine Network. 2006;17(1):4-12.
- Nawrocki AR, Rajala MW, Tomas E, Pajvani UB, Saha AK, Trumbauer ME, et al. Mice lacking adiponectin show decreased hepatic insulin sensitivity and reduced responsiveness to peroxisome proliferator-activated receptor gamma agonists. Journal of Biological Chemistry. 2006;281(5):2654-2660.
- Semple RK, Cochran EK, Soos MA, Burling KA, Savage DB, Gorden P, et al. Plasma adiponectin as a marker of insulin receptor dysfunction: Clinical utility in severe insulin resistance. Diabetes Care. 2008;31(5):977-979.
- Duntas LH, Orgiazzi J, Brabant G. The interface between thyroid and diabetes mellitus. Mellitus Clinical Endocrinology. 2011;75(1):1-9. https://scholar.google.com/scholar?q=intitle:The%20int erface%20between%20thyroid%20and%20diabetes%2
- Stanická S, Vondra K, Pelikánová T, Vlček P, Hill M, Zamrazil V et al. Insulin sensitivity and counterregulatory hormones in hypothyroidism and during thyroid hormone replacement therapy. Clinical Chemistry and Laboratory Medicine (CCLM). 2005;43(7):715-720.
- Dimitriadis G, Mitrou P, Lambadiari V, et al. Insulinstimulated rates of glucose uptake in muscle in hyperthyroidism: the importance of blood flow. The Journal of Clinical Endocrinology & Metabolism. 2008;93(6):2413-2415. https://academic.oup.com/jcem/article/93/6/2413/25990 07?login=true.
- Kapadia KB, Bhatt PA, Shah JS. Association between altered thyroid state and insulin resistance. Journal of Pharmacology and Pharmacotherapeutics. 2012;3(2):156-160.
- Paz-Filho G, Mastronardi CA, Licinio J. Leptin treatment: Facts and expectations. Metabolism. 2015;64(1):146-156.
- Grinspoon S, Gulick T, Askari H, Landt M, Lee K, Anderson E, et al. Serum leptin levels in women with anorexia nervosa. The Journal of Clinical Endocrinology and Metabolism. 1996;81(11):38613863.
- Farooqi IS, O'Rahilly S. 20 years of leptin: human disorders of leptin action. Journal of Endocrinology. 2014;223(1):T63-T70.
- Licinio J, Caglayan S, Ozata M, Yildiz BO, de Miranda PB, O'Kirwan F, et al. Phenotypic effects of leptin replacement on morbid obesity, diabetes mellitus, hypogonadism, and behavior in leptin-deficient adults. Proceedings of the National Academy of Sciences. USA. 2004;101(13):4531-4536.
- Flier JS, Maratos-Flier E. Leptin's physiologic role: does the emperor of energy balance have no clothes? Cell Metabolism. 2017;26(1):24-26.
- Williams DL, Ozment-Skelton T, Li C. Modulation of the phosphoinositide 3-kinase signaling pathway alters host response to sepsis, inflammation, and ischemia/reperfusion injury. Shock. 2006;25(5):432439.
- Osegbe I, Okpara H, Azinge E. Relationship between serum leptin and insulin resistance among obese Nigerian women. Annals of African Medicine. 2016;15(1):14.
- Enriori PJ, Evans AE, Sinnayah P, Cowley MA. Leptin resistance and obesity. Obesity. 2006;14(8):254S-258S.
- Kumar R, Mal K, Razaq MK, Magsi M, Memon MK, Memon S, et al. Association of leptin with obesity and insulin resistance. Cureus. 2020 Dec 27;12(12):e12336.
- Heilbronn L, Smith SR, Ravussin E. Failure of fat cell proliferation, mitochondrial function and fat oxidation results in ectopic fat storage, insulin resistance and type II diabetes mellitus. International Journal of Obesity. 2004;28(4):S12-S21.
- Milan G, Granzotto M, Scarda A, Calcagno A, Pagano C, Federspil G, et al. Resistin and adiponectin expression in visceral fat of obese rats: Effect of weight loss. Obesity Research. 2002;10(11):1095-1003.
- De Luis DA, Terroba MC, Cuellar L, Conde R, Primo D, Aller R, et al. Resistin levels in morbid obese patients following the biliopancreatic diversion surgery. Hormone and Metabolic Research. 2011;43(03):205208.
- Nagaev I, Smith U. Insulin resistance and type 2 diabetes are not related to resistin expression in human fat cells or skeletal muscle. Biochemical and Biophysical Research Communications. 2001;285(2):561-564.
- Asensio C, Cettour-Rose P, Theander-Carrillo C, Rohner-Jeanrenaud F, Muzzin P. Changes in glycemia by leptin administration or high-fat feeding in rodent models of obesity/type 2 diabetes suggest a link between resistin expression and control of glucose homeostasis. Endocrinology. 2004;145(5):2206-2213.
- Lee JH, Bullen Jr JW, Stoyneva VL, Mantzoros CS. Circulating resistin in lean, obese, and insulin-resistant mouse models: lack of association with insulinemia and glycemia. American Journal of PhysiologyEndocrinology and Metabolism. 2005;288(3):E625E632.
- Silha JV, Krsek M, Skrha JV, Sucharda P, Nyomba BL, Murphy LJ et al. Plasma resistin, adiponectin and leptin levels in lean and obese subjects: Correlations with insulin resistance. European Journal of Endocrinology. 2003;149(4):331-335.
- Fain JN, Cheema PS, Bahouth SW, Hiler ML. Resistin release by human adipose tissue explants in primary culture. Biochemical and Biophysical Research Communications. 2003;300(3):674-648.
- De Rosa A, Monaco ML, Capasso M, Forestieri P, Pilone V, Nardelli C, et al. Adiponectin oligomers as potential indicators of adipose tissue improvement in International Journal of Advanced Chemistry Research https://www.chemistryjournals.net obese subjects. European Journal of Endocrinology. 2013;169(1):37-43.
- Blümer RME, Van Roomen CP, Meijer AJ, HoubenWeerts JHPM, Sauerwein HP, Dubbelhuis PF et al. Regulation of adiponectin secretion by insulin and amino acids in 3T3-L1 adipocytes. Metabolism. 2008;57(12):1655-1662.
- Wang ZV, Schraw TD, Kim JY, Khan T, Rajala MW, Follenzi A, et al. Secretion of the adipocyte-specific secretory protein adiponectin critically depends on thiol-mediated protein retention. Molecular and Cellular Biology. 2007;27(10):3716-3731.
- Lekva T, Roland MCP, Michelsen AE, Friis CM, Aukrust P, Bollerslev J, et al. Large reduction in adiponectin during pregnancy is associated with largefor-gestational-age newborns. The Journal of Clinical Endocrinology & Metabolism. 2017;102(7):2552-2559.
- Yanai H, Yoshida H. Beneficial effects of adiponectin on glucose and lipid metabolism and atherosclerotic progression: Mechanisms and perspectives. International Journal of Molecular Sciences. 2019;20(5):1190.
- Reinehr T, De Sousa G, Andler W. Hyper thyrotropinemia in obese children is reversible after weight loss and is not related to lipids. The Journal of Clinical Endocrinology & Metabolism. 2006;91(8):3088-3091.
- Biondi B. Thyroid and obesity: An intriguing relationship. The Journal of Clinical Endocrinology and Metabolism. 2010;95(8):3614-3617.
- Longhi S, Radetti G. Thyroid function and obesity. Journal of Clinical Research in Pediatric Endocrinology. 2013;5(1):40.
- Ladenson PW, Kristensen JD, Ridgway EC, Olsson AG, Carlsson B, Klein I, et al. Use of the thyroid hormone analogue eprotirome in statin-treated dyslipidemia. New England Journal of Medicine. 2010;362(10):906-916.
- Shupnik MA, Chin WW, Habener JF, Ridgway EC. Transcriptional regulation of the thyrotropin subunit genes by thyroid hormone. Journal of Biological Chemistry. 1985;260(5):2900-2903.
- Segerson TP, Kauer J, Wolfe HC, Mobtaker H, Wu P, Jackson IMD, et al. Thyroid hormone regulates TRH biosynthesis in the paraventricular nucleus of the rat hypothalamus. Science. 1987;238(4823):78-80.
- Chomard P, Vernhes G, Autissier N, Debry G. Serum concentrations of total T 4 , T 3 , reverse T 3 and free T 4 , T 3 in moderately obese patients. Human Nutrition & Metabolism. 1985;39(5):371-378.
- Bays HE, Toth PP, Kris-Etherton PM, Abate N, Aronne LJ, Brown WV, et al. Obesity, adiposity, and dyslipidemia: A consensus statement from the National Lipid Association. Journal of Clinical Lipidology. 2013 Jul;7(4):304-383.
- Masuda D, Yamashita S. Postprandial hyperlipidemia and remnant lipoproteins. Journal of Atherosclerosis and Thrombosis. 2017;24(2):95-109.
- Cameron AJ, Magliano DJ, Söderberg S. A systematic review of the impact of including both waist and hip circumference in risk models for cardiovascular diseases, diabetes and mortality. Obesity Reviews. 2013;14(1):86-94.
- Klop B, Elte JWF, Castro Cabezas M. Dyslipidemia in obesity: Mechanisms and potential targets. Nutrients. 2013;5(4):1218-1240.
- Gaudet D, Brisson D, Tremblay K, Alexander VJ, Singleton W, Hughes SG, et al. Targeting APOC3 in the familial chylomicronemia syndrome. The New England Journal of Medicine. 2014;371(23):2200-2206.
- Gaudet D, Brisson D, Tremblay K, Alexander VJ, Singleton W, Hughes SG, et al. Targeting APOC3 in the familial chylomicronemia syndrome. The New England Journal of Medicine. 2014;371(23):2200-2206.
- Bushra, Sangeeta Kapoor and Fozia Jamal. Study of mineral profile in patients with hypothyroidism. Int. J. Adv. Biochem. Res. 2022;6(1):55-60. DOI: 10.33545/26174693.2022.v6.i1a.89
- Katsiki N, Mantzoros C, Mikhailidis DP. Adiponectin, lipids and atherosclerosis. Current Opinion in Lipidology. 2017;28(4):347-354.
Cited by 8
From OpenAlex, OpenCitations and reference lists read by Scinovex
- Lipoprotein Ratios as Biomarkers for Assessing Chronic Atherosclerosis Progression ↗
Abbas Mohsin Abbas, Iman H. Shewael, Osama Akram Mohsein · Academia Open · 2025
General Background: Lipoprotein ratios are critical biomarkers for assessing chronic atherosclerosis progression, providing insights into lipid metabolism imbalances and cardiovascular risk. Specific Background: While their role in cardiovascular disease is established, their correlation with inflammatory markers in chronic atherosclerosis remains underexplored. Knowledge Gap: Limited studies have comprehensively examined the interplay between lipid dysregulation and systemic inflammation in chronic atherosclerosis. Aims:…
❝ 4PDF - Inflammatory biomarkers as predictors of cancer progression and treatment response ↗
Zeina Abdul-Ella, Maryam Jasim Hasan, Hamssa Majid Mustafa, Osama A. Mohsein · International Journal of Clinical and Diagnostic Pathology · 2025
Inflammatory biomarkers have emerged as critical tools for understanding cancer progression and predicting treatment response. Chronic inflammation plays a pivotal role in tumor development by promoting genetic instability, angiogenesis, and immune evasion. Key biomarkers, such as C-reactive protein (CRP), interleukins (IL-6, IL-10), tumor necrosis factor-alpha (TNF-α), and neutrophil-to-lymphocyte ratio (NLR), have shown significant associations with cancer prognosis and therapeutic outcomes
- A comprehensive review of Adipsin and CTRP12 as potential biomarkers and their implications in chronic kidney disease (CKD) ↗
Mohammed M Abdulkadhm, Aws Rassul Hussain, Ali Faisal Hussein, Abbas Abdulhasan Jebur, Rakesh Rawal, Rushikesh Joshi · International Journal of Chemical and Biological Sciences · 2025
Background and Aim: Chronic kidney disease (CKD) is a global health concern that is often exacerbated by metabolic disorders such as obesity and type 2 diabetes mellitus (T2DM). Adipsin and C1q/TNF-related protein 12 (CTRP12), two adipokines, have emerged as important regulators of glucose metabolism, insulin sensitivity, lipid homeostasis, and inflammation, all of which are crucial factors in the pathogenesis of
- Overview on type 5 diabetes mellitus: Causes, symptoms and dietary management ↗
Nasir Nabi Batt, Sabyasachi Sen, Mohima Das, D. Chatterjee, Swati Nakhale · International Journal of Pharmaceutical and Clinical Research · 2025
Type 5 Diabetes Mellitus is an emerging subtype of diabetes, classified under "secondary diabetes," primarily associated with pancreatic diseases such as pancreatitis, pancreatic cancer, and cystic fibrosis. Unlike the classical types Type 1 and Type 2, Type 5 diabetes arises from direct damage to the exocrine and endocrine functions of the pancreas, affecting insulin production and glucose metabolism. This review
- Latent autoimmune diabetes in an adult male presenting with diabetic ketoacidosis precipitated by sepsis ↗
Hemant Gupta, Isha Koul, Alpana Waghmare, Abhishek Chande, Akash Parab · International Journal of Research in Medical Science · 2025
Latent autoimmune diabetes in adults (LADA) is a relatively common form of diabetes, but it remains under-researched. It shares characteristics of both type 1 and type 2 diabetes mellitus (T1D and T2D). While autoimmunity is a recognised underlying cause of LADA, certain environmental factors such as obesity, lack of physical activity, and smoking may also contribute to its development. Due
- Assessment of Nurses’ Knowledge and Practice regarding the Management of Type 2 Diabetes Mellitus at 250 Bedded Mohammad Ali Hospital, Bogura, Bangladesh ↗
Mt. Farida Khatun, Sadiya Aktar Sukhi, Mst. Afroza Khatun, Most. Jesmin Akhter, Maksuda Aktar, Mst. Jakera Khatun et al. · International Journal of Nursing and Health Sciences · 2025
Background: Diabetes mellitus is one of the most common chronic diseases in nearly all countries, and continues to increase in numbers and significance, as changing lifestyles lead to reduced physical activity, and increased obesity. Type 2 Diabetes Mellitus (T2DM) is a chronic metabolic disorder characterized by elevated blood glucose levels due to insulin resistance and/or impaired insulin secretion. It is
- Exploring diabetes mellitus: Anatomy, genetics, and cuting-edge treatments ↗
Kothwala, Deveshkumar Mahendralal, Shaikh Amirhamzah Mahmadiqbal, Khalifa Haroonmohammad Rasidmohammad, Pruthavi Bhima Biradar · International Journal of Diabetes Research · 2025
Diabetes Mellitus is a chronic metabolic disorder characterized by elevated blood glucose levels due to defects in insulin production, insulin action, or both. It has become a major global health issue with rising prevalence across all age groups. This article explores the anatomical basis of diabetes involving pancreatic dysfunction, the genetic factors contributing to both Type 1 and Type 2
❝ 0Found by Scinovex - Comprehensive review of diabetes mellitus: Pathophysiology, current management, and emerging therapeutic approaches ↗
Bharti Khichi, Sukhwant Singh · International Journal of Pharmacy and Pharmaceutical Science · 2025
Diabetes mellitus (DM), a chronic metabolic disorder marked by hyperglycaemia, results from defects in insulin secretion, insulin action, or both. This comprehensive review examines the pathophysiology of diabetes, highlighting new therapies for DM and other forms of the disease. It outlines current management strategies, including lifestyle modifications, pharmacological interventions, and monitoring techniques aimed at achieving optimal glycaemic control and minimizing