
Research article · 2024 · Full text
International Journal of Agriculture Extension and Social DevelopmentCorrelates of utility perception of E-Peek Pahani Mobile App by user farmers
Volume 7(2) · Pages 06–09 · DOI: 10.33545/26180723.2024.v7.i2a.287 ↗
Research areasSMEs Development and Digital MarketingTechnology Adoption and User BehaviourFinancial Literacy and Behavior
Abstract
Author-writtenThe present study was conducted in two districts of the Marathwada region with the objective of examining the relationship between the profile of E-Peek Pahani Mobile app user farmers and their utility perception. The results indicated that the majority of E-Peek Pahani users were in the middle-age group, with secondary-level education, a medium family size, small landholding, with medium level of social participation, extension contact, innovativeness, source of information and techno-savviness. Data also revealed that they possessed good network connectivity, and ICT tools. Among the eleven selected independent variables, education, landholding, social participation, extension contact, source of information, innovativeness, network connectivity, possession of ICT tools, and techno-savviness demonstrated a positive and significant relationship with utility perception. However, family size did not show any significant relationship with the utility perception of the E-Peek Pahani Mobile App. Conversely, the age of respondents exhibited a significantly negative relationship with the utility perception of the E-Peek Pahani Mobile App.
Summary
Source-checkedPlain-language reading of the full paper, prepared with AI and checked against the text. Each point links to the authors' own words.
Why it matters
- Digital agriculture uses information and communication technology (ICT) to provide localized services and information, which helps make farming more sustainable economically, socially, and environmentally. View evidence ↗
- The E-Peek Pahani app allows farmers to self-report crop data and stages, removing the requirement to visit the talathi office for 7/12 extract registration. View evidence ↗
- By using the app, the government can obtain accurate data on crop areas, which informs policies regarding marketing, pricing, and pre-planning based on expected yields. View evidence ↗
The question
- The study aimed to identify the profile characteristics of farmers using the E-Peek Pahani app and determine how these profiles relate to their perception of the app's utility. View evidence ↗
What they did
- The research was carried out across eight randomly selected villages in the Chhatrapati Sambhajinagar and Parbhani districts of the Marathwada region. View evidence ↗
- The researchers analyzed eleven independent variables, including age, education, landholding, and techno-savviness, against the dependent variable of utility perception. View evidence ↗
- Data analysis was performed using Pearson’s correlation coefficient, frequency, percentage, mean, and standard deviation. View evidence ↗
What they found
- Most respondents were middle-aged (55.00%, 31-53 years), while 25.00% were young (up to 30 years) and 20.00% were old (54 years and above). View evidence ↗
- The most common education level among users was secondary education (44.17%), followed by college level (20.00%) and higher secondary (18.33%). View evidence ↗
- Small-sized landholdings (1.1 to 2 ha) were the most prevalent among respondents at 44.17%. View evidence ↗
- Age had a significant negative relationship (r = -0.342) with utility perception, suggesting younger users found the app more useful. View evidence ↗
- Education showed a highly positive and significant relationship (r = 0.266) with the perceived utility of the app. View evidence ↗
- Family size did not have a significant relationship (r = 0.038) with the utility perception of the app. View evidence ↗
- Extension contact showed a highly positive and significant relationship (r = 0.292) with the perceived utility of the app. View evidence ↗
- Possession of ICT tools was highly positively and significantly related (r = 0.284) to utility perception. View evidence ↗
What it means
- The authors concluded that nine of the eleven variables, including education, landholding, and techno-savviness, positively and significantly influenced the perceived utility of the E-Peek Pahani app. View evidence ↗
Visual summary
2 visualsIllustrations explain the paper; charts are replotted from the paper's own table values.
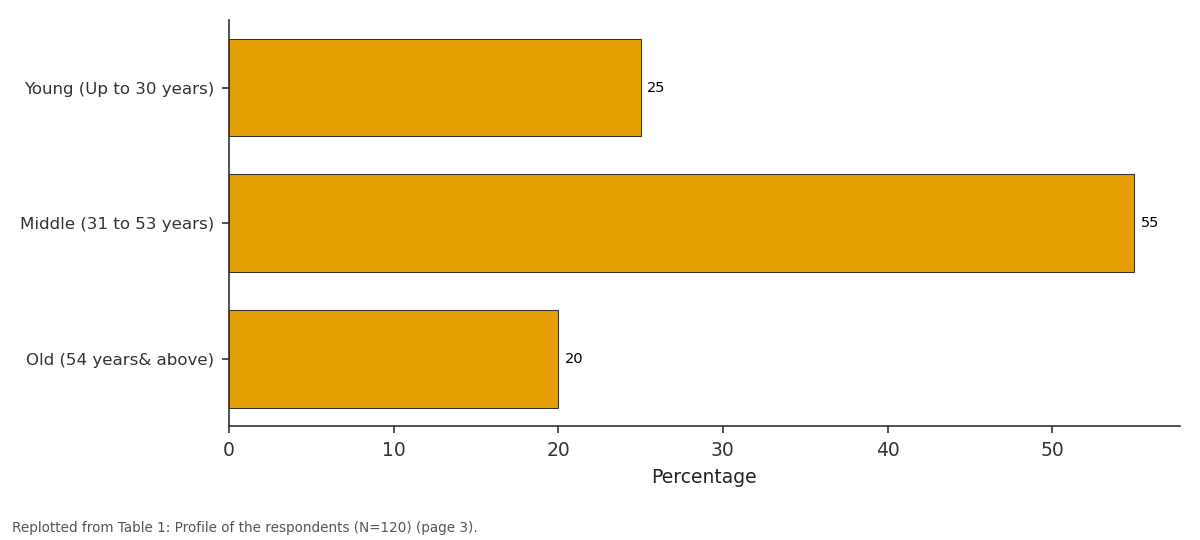
Percentage: Young (Up to 30 years) vs Middle (31 to 53 years) vs Old (54 years& above)
Replotted from Table 1 (page 3) of the original paper. Every bar is the paper's own table value.
View source evidence ↗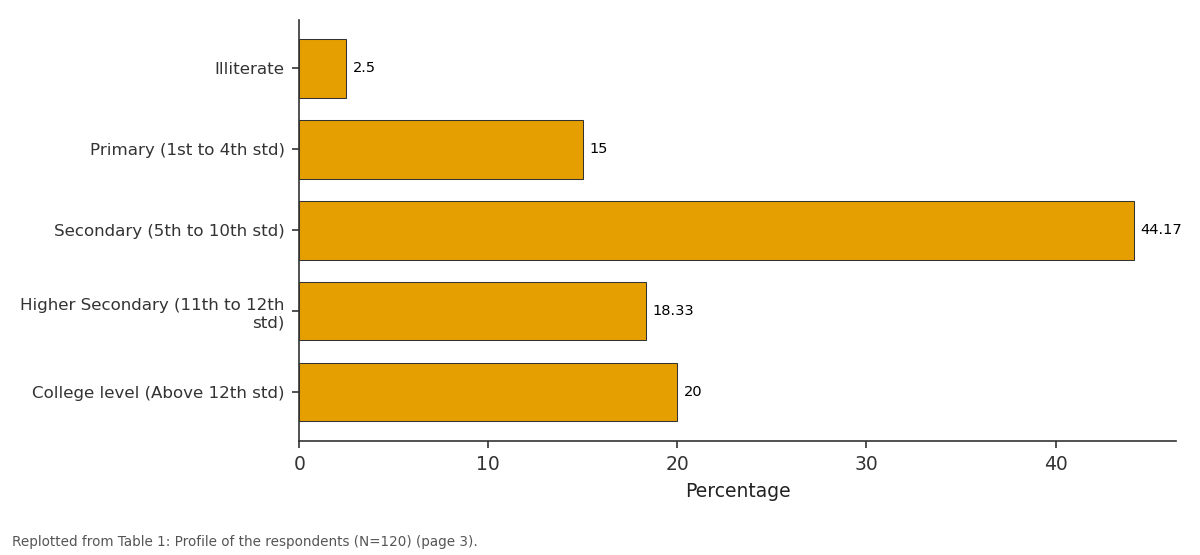
Percentage: Illiterate vs Primary (1st to 4th std) vs Secondary (5th to 10th... vs Higher Secondary (11th... vs College level (Above...
Replotted from Table 1 (page 3) of the original paper. Every bar is the paper's own table value.
View source evidence ↗Figures & tables
From the original paper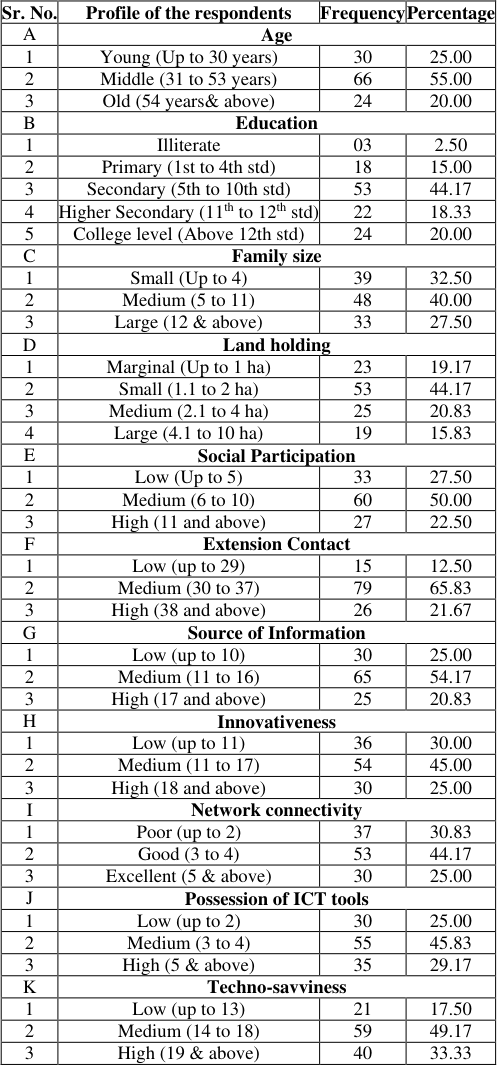 Table 1
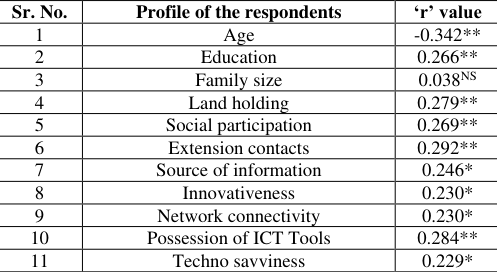 Table 2
Introduction
Digital agriculture is the application of information and communication technology (ICT) to facilitate the transmission of localized information and services aiming to make farming socially, economically, and environmentally sustainable, while assisting in the provision of affordable and wholesome food for all. This has also sparked the growth and development of smartphone apps, which are enabling farmers in rural India to access current government programs and other information related to agriculture. The agricultural conditions in India are changing as a result of this digital innovation. The ability of rural residents to reach their full potential and improve their economic, social, and environmental conditions has been compromised by information gaps between rural and metropolitan communities. The effects on rural residents included three things: loss of time, opportunity, and income. Therefore, efforts will be undertaken to arm farmers with knowledge. India has the technological resources to provide farmers with the knowledge they require, enabling them to increase their productivity and standard of living. The missing piece in the livestock agricultural supply chain for smallholder farmers has always been timely, affordable, and personally relevant information on better practices, markets, prices, inputs, weather, and approaching calamities. The Government of Maharashtra, in collaboration with Tata Trust, has initiated the E-Peek Pahani application.
According to the Maharashtra Land Revenue Code of 1966, Village Sample No. 7 serves as a rights record, while the 7/12 extract is employed to maintain crop records. The present 7/12 extract's crop details are documented by grassroots-level employees of the land revenue department, specifically the talathi. Following prevailing regulations, the concerned talathis issue prior notices and meticulously inspect crops in every village within their jurisdiction to update the 7/12 extract. However, due to factors such as population growth, an increase in account holders, group division, village division, and a substantial rise in nonrevenue work over the past decades, considerable effort is required. In light of these challenges, active farmer participation in the crop inspection process alongside the government is crucial to alleviate the talathis' workload and enhance the quality and accuracy of work through a digital platform. Additionally, farmer involvement has contributed to increased transparency. The E-Peek Pahani app facilitates farmers in self-reporting crop data and stages, eliminating the need for farmers to visit the talathi office to register crop information on the 7/12 extract. Farmers can download the app, register their crops, and specify the exact location of their fields. Real-time photographs of the crops, taken via mobile phones and GPS, can be uploaded, ensuring the accuracy of information through Google Maps and geotagging. www.extensionjournal.com Talathis verify the submitted information within two weeks and record details about crop status on the 7/12 extract. The app is integrated into the land records department, and talathis cross-check the information provided by farmers, submitting relevant details to the government. Consequently, the government obtains precise information on the area under various crops, enabling informed decisions on pre-planning, marketing, and price policies based on the types of crops sown and anticipated yields. The present study was conducted to understand the profile characteristics of user farmers and explore the relationship between user profiles and the utility perception of the E-Peek Pahani mobile app. Given the rapid adoption of mobile phones in rural India, this research contributes valuable insights to enhance the effectiveness of the E-Peek Pahani app. The study aims to comprehend the perceived needs of farmers regarding mobile apps as an extension service delivery tool, establishing a relationship between the level of acceptance and the perceived needs of farmers about mobile apps with independent variables. In consideration of these aspects, the study was undertaken with the following objectives: 1. To examine the profile of the users of the E-Peek Pahani mobile app. 2. To delineate the relationship between the profile of users and the utility perception of the E-Peek Pahani mobile app.
Methodology
The study was conducted in randomly selected eight villages from two talukas in the Parbhani and Chhatrapati Sambhajinagar districts of the Marathwada region. The list of users of the E-Peek Pahani mobile app was obtained from the talathi of the respective village, and fifteen user farmers of the E-Peek Pahani mobile app were randomly selected from each village. In total, 120 respondents were selected as sample participants for the study. An ex-post facto design of social research was employed in the study. Considering the study's objectives, a structured interview schedule was prepared. Eleven independent variables were selected for the study viz., age, education, family size, landholding, social participation, extension contact, source of information, innovativeness, internet connectivity, possession of ICT tools, and Techno-savviness. The dependent variable was the utility perception of the E-Peek Pahani mobile app by the users farmers. Utility perception was defined as the degree to which the E-Peek Pahani app is perceived as useful for farmers. Statistical tools such as mean, standard deviation, frequency, percentage, and Pearson's correlation coefficient were employed for data analysis.
Results
Results
Profile of the users of E-Peek Pahani mobile app
The details of the profile characteristics of the E-Peek Pahani mobile app users are presented in Table 1. It was observed that the majority of the respondents (55.00%) were middle-aged (31-53 years), followed by 25.00% and 20.00% in the young age group (up to 30 years) and old age group (54 years & above), respectively. Regarding the education level of the respondents, it was reported that 44.17% had a secondary level of education, followed by college level (20.00%), higher secondary (18.33%), primary (15.00%), and illiterate (2.50%). Table 1 reveals that the majority (40.00%) of the respondents belonged to medium family size, while 32.50% came from small family sizes, and 27.50% from large family sizes. In terms of landholding, the data indicates that the highest number of respondents (44.17%) had small-sized landholding (1.1 to 2 ha), followed by marginal farmers (20.83%), medium farmers (23.33%), and large farmers (15.83%). Concerning social participation, it was observed that the majority (50.00%) of the respondents had medium social participation, followed by low (27.50%) and high (22.50%) social participation. Additionally, Table 1 highlights that the majority (65.83%) of the respondents had a medium level of extension contact, followed by high (21.67%) and low (12.50%) levels of extension contact. Regarding the source of information, 54.17% of the respondents reported a medium level of information, followed by low (25.00%) and high (20.83%) levels. The majority of respondents (45.00%) had a medium level of innovativeness, followed by low (30.00%) and high (25.00%) innovativeness. In terms of internet network connectivity, 44.17% of the respondents had good network connectivity, followed by poor network connectivity (30.83%) and excellent network connectivity (25.00%). Regarding the possession of ICT tools, the results indicated that the majority (45.83%) had a medium level of possession, followed by high (29.17%) and low (29.17%) levels. As for the techno-savviness of the respondents, Table 1 shows that the majority (49.17%) had a medium level of techno-savviness, followed by high (33.33%) and low (17.50%) techno-savviness.
| Sr. No. | Profile of the respondents | Frequency | Percentage |
|---|---|---|---|
| A | Age | ||
| 1 | Young (Up to 30 years) | 30 | 25.00 |
| 2 | Middle (31 to 53 years) | 66 | 55.00 |
| 3 | Old (54 years& above) | 24 | 20.00 |
| B | Education | ||
| 1 | Illiterate | 03 | 2.50 |
| 2 | Primary (1st to 4th std) | 18 | 15.00 |
| 3 | Secondary (5th to 10th std) | 53 | 44.17 |
| 4 | Higher Secondary (11th to 12th std) | 22 | 18.33 |
| 5 | College level (Above 12th std) | 24 | 20.00 |
| C | Family size | ||
| 1 | Small (Up to 4) | 39 | 32.50 |
| 2 | Medium (5 to 11) | 48 | 40.00 |
| 3 | Large (12 & above) | 33 | 27.50 |
| D | Land holding | ||
| 1 | Marginal (Up to 1 ha) | 23 | 19.17 |
| 2 | Small (1.1 to 2 ha) | 53 | 44.17 |
| 3 | Medium (2.1 to 4 ha) | 25 | 20.83 |
| 4 | Large (4.1 to 10 ha) | 19 | 15.83 |
| E | Social Participation | ||
| 1 | Low (Up to 5) | 33 | 27.50 |
| 2 | Medium (6 to 10) | 60 | 50.00 |
| 3 | High (11 and above) | 27 | 22.50 |
| F | Extension Contact | ||
| 1 | Low (up to 29) | 15 | 12.50 |
| 2 | Medium (30 to 37) | 79 | 65.83 |
| 3 | High (38 and above) | 26 | 21.67 |
| G | Source of Information | ||
| 1 | Low (up to 10) | 30 | 25.00 |
| 2 | Medium (11 to 16) | 65 | 54.17 |
| 3 | High (17 and above) | 25 | 20.83 |
| H | Innovativeness | ||
| 1 | Low (up to 11) | 36 | 30.00 |
| 2 | Medium (11 to 17) | 54 | 45.00 |
| 3 | High (18 and above) | 30 | 25.00 |
| I | Network connectivity | ||
| 1 | Poor (up to 2) | 37 | 30.83 |
| 2 | Good (3 to 4) | 53 | 44.17 |
| 3 | Excellent (5 & above) | 30 | 25.00 |
| J | Possession of ICT tools | ||
| 1 | Low (up to 2) | 30 | 25.00 |
| 2 | Medium (3 to 4) | 55 | 45.83 |
| 3 | High (5 & above) | 35 | 29.17 |
| K | Techno-savviness | ||
| 1 | Low (up to 13) | 21 | 17.50 |
| 2 | Medium (14 to 18) | 59 | 49.17 |
| 3 | High (19 & above) | 40 | 33.33 |
Table text extracted from the original PDF; superscript letters are shown inline. The original table image is below.
View original table image
Relationship between profile of the users with utility perception of E-Peek Pahani mobile app
The relationship between the profile of user farmers and their utility perception of the E-Peek Pahani mobile app is presented in Table 2. 2 indicates that the age of the user farmer showed a significantly negative relationship with the utility perception of the E-Peek Pahani mobile app. This can be attributed to the fact that younger users were more enthusiastic and familiar with handling smartphones and mobile apps.
| Sr. No. | Profile of the respondents | ‘r’ value |
|---|---|---|
| 1 | Age | -0.342** |
| 2 | Education | 0.266** |
| 3 | Family size | 0.038NS |
| 4 | Land holding | 0.279** |
| 5 | Social participation | 0.269** |
| 6 | Extension contacts | 0.292** |
| 7 | Source of information | 0.246* |
| 8 | Innovativeness | 0.230* |
| 9 | Network connectivity | 0.230* |
| 10 | Possession of ICT Tools | 0.284** |
| 11 | Techno savviness | 0.229* |
Table text extracted from the original PDF; superscript letters are shown inline. The original table image is below.
View original table image
Age and utility perception: Table
Education and utility perception: It was observed that there is a highly positive and significant relationship between education and the utility perception of the E-Peek Pahani Mobile App by its users. This suggests that educated individuals can easily understand the importance and utility of using the E-Peek Pahani mobile app.
Family size and utility perception:
The family size of the user farmer showed a non-significant relationship with utility perception. This may be because the utility perception of the E-Peek Pahani Mobile App is not affected by the family size of the respondents.
Land holding and utility perception:
The land holding of www.extensionjournal.com user farmers showed a highly positive and significant relationship with the utility perception of the E-Peek Pahani mobile app. This may be because user farmers with larger land holdings have the financial capacity to purchase smartphones and can better utilize agricultural and allied practices on their land.
Social participation and utility perception: Social participation of user farmers showed a positive and highly significant relationship with the utility perception of the E-Peek Pahani mobile app. This suggests that user farmers with high social participation are more likely to receive needed information about the mobile app and utilize it more effectively.
Extension contact and utility perception: It was observed that extension contact has a highly positive and significant relationship with utility perception. This is likely because user farmers having contact with extension personnel are exposed to new ideas and information related to the latest technologies and mobile apps like E-Peek Pahani. Extension personnel play a crucial role in creating awareness about the app and boosting farmer confidence in handling it.
Source of information and utility perception:
The use of various sources of information was found to have a highly positive and significant relationship with utility perception. This indicates that utilizing different information sources and channels helps individuals acquire new knowledge and increases the utility perception of the latest technologies.
Innovativeness and utility perception:
The innovativeness of user farmers showed a highly positive and significant relationship with utility perception. This suggests that farmers with a more innovative mindset perceive greater utility in mobile apps like E-Peek Pahani. The adventurous nature of innovators makes them more inclined to use new ICT tools efficiently.
Network Connectivity and utility perception: Network connectivity showed a highly positive and significant relationship with utility perception. This may be because better network connectivity is essential for downloading, logging in, and registering the E-Peek Pahani mobile app.
Possession of ICT Tools and utility perception:
There was a highly positive and significant relationship between the possession of ICT tools and utility perception. This implies that users with better access to ICT tools have a higher utility perception of the E-Peek Pahani mobile app.
Techno-savviness and utility perceptions: It was observed that there was a highly positive and significant relationship between techno-savviness and utility perception. This indicates that individuals with higher techno-savviness perceive greater utility in using the E-Peek Pahani mobile app. Similar findings are echoed by Singh et al. (2004) [5] , Nagnikar (2005) [3] , Mangal Shinde (2016) [1] , Pawar et al. (2020) [4] , and Motka (2021) [2] .
Conclusion
The result of the study concluded that the majority of respondents belonged to the middle-age group, with secondary level education, medium family size, small land holding, and a medium level of social participation, extension contact, innovativeness, source of information. They also possessed good network connectivity, ICT tools, and techno-savviness. Out of the eleven selected independent variables, education, land holding, social participation, extension contact, source of information, innovativeness, network connectivity, possession of ICT tools, and techno-savviness showed a positive and significant relationship with utility perception. On the other hand, family size did not exhibit any significant relationship with the utility perception of the E-Peek Pahani Mobile App. However, the age of respondents had a significantly negative relationship with the utility perception of the E-Peek Pahani Mobile App.
References
2 in the original paper- Pawar HY, Kapse PS, Puri SG. Utility of AgroTech VNMKV mobile app as perceived by the user farmers. Int. J Curr. Microbiol. App. Sci. 2020;9(4):1280-1286.
- Singh SP, Malik RS, Narwad RS. Mass media exposure among horticultural development officers in Haryana. Rural India. 2004;67(5):90-9.