
Research article · 2023 · Full text
International Journal of Agriculture and Food ScienceMultidimensional poverty and commercialization level of sweet potato farmers in Kwara and Osun states
Volume 5(2) · Pages 124–130 · DOI: 10.33545/2664844x.2023.v5.i2b.156 ↗
Research areasAgricultural Innovations and PracticesInnovation and Socioeconomic DevelopmentAgricultural Economics and Practices
Abstract
Author-writtenSmallholder farming remains the livelihood of rural farmers who constitute majority of poverty ridden population in the rural area. Commercialization of smallholder farms has the potential to enhance food security, nutrition, incomes and welfare outcomes and takes smallholder farmers out of poverty. This study examined the Multidimensional Poverty and Commercialization level of Sweet Potato Farmers in Kwara and Osun States Multistage sampling technique was used to select 485 sweet potato farmers. An interview guide was used through structured questionnaire to obtain primary data which were analysed using multidimensional poverty index and commercialization index. The study revealed that majority the sweet potato farmers were considered to be multidimensionally poor, since majority of the indicators were above the cutoff level of deprivation level (36%). Also, the mean of agricultural commercialization level was 84% for the respondents. Indicating that majority of the respondent engaged in commercializing their agricultural crop. The study concludes that sweet potato farmers were multidimensional poor in the study areas. It is therefore recommended that Government and Non-Governmental Organizations involved in agricultural development should give more attention to rural development to reduce their multidimensional poverty level. Also, effort to encourage the commercial production and commercialization of sweet potatoes as a competitive alternative to yam by reducing its postharvest losses should be given the needed attention.
Summary
Source-checkedPlain-language reading of the full paper, prepared with AI and checked against the text. Each point links to the authors' own words.
Why it matters
- Smallholder farming is the primary livelihood for many rural farmers, who make up the majority of the impoverished rural population. View evidence ↗
- Moving smallholder farms toward commercialization can potentially reduce poverty by improving incomes, nutrition, and food security. View evidence ↗
- Sweet potatoes are a valuable crop for developing countries because they can help address nutritional deficits, generate income, and reduce poverty. View evidence ↗
The question
- The study aimed to examine the levels of multidimensional poverty and agricultural commercialization among sweet potato farmers in Kwara and Osun States, Nigeria. View evidence ↗
What they did
- The researchers used a multistage sampling technique to select a total of 486 sweet potato farmers from the study areas. View evidence ↗
- Primary data was collected from the farmers using structured questionnaires. View evidence ↗
- The study employed a Multidimensional Poverty Index (MPI) and a Commercialization Index to analyze the farmers' status. View evidence ↗
- Poverty was measured across four domains, education, health, living standards, and agricultural commercialization, using a deprivation cutoff of 36%. View evidence ↗
What they found
- In Kwara state, the poverty incidence (H) was 0.568, meaning 56.8% of the sweet potato farmers were multidimensionally poor. View evidence ↗
- In Osun state, the poverty incidence (H) was 0.678, indicating that 67.8% of the farmers were multidimensionally poor. View evidence ↗
- When pooled, 61.4% of the sweet potato farmers across both states were found to be multidimensionally poor. View evidence ↗
- The mean level of agricultural commercialization for the respondents in both states was 84%. View evidence ↗
- The highest levels of commercialization recorded were 49.8% in Kwara state and 51.2% in Osun state. View evidence ↗
- The average age of the farmers ranged between 42 and 45 years, suggesting they are in an active and responsive stage of life. View evidence ↗
What it means
- The authors concluded that sweet potato farmers in the studied areas of Kwara and Osun states are multidimensionally poor. View evidence ↗
- The authors recommend focusing on reducing post-harvest losses to encourage the commercial production of sweet potatoes as a competitive alternative to yam. View evidence ↗
Visual summary
3 visualsIllustrations explain the paper; charts are replotted from the paper's own table values.
MPI Framework
AI-generated conceptual illustration (sweet potato plants and farming tools). It explains the idea and does not show study data.
View source evidence ↗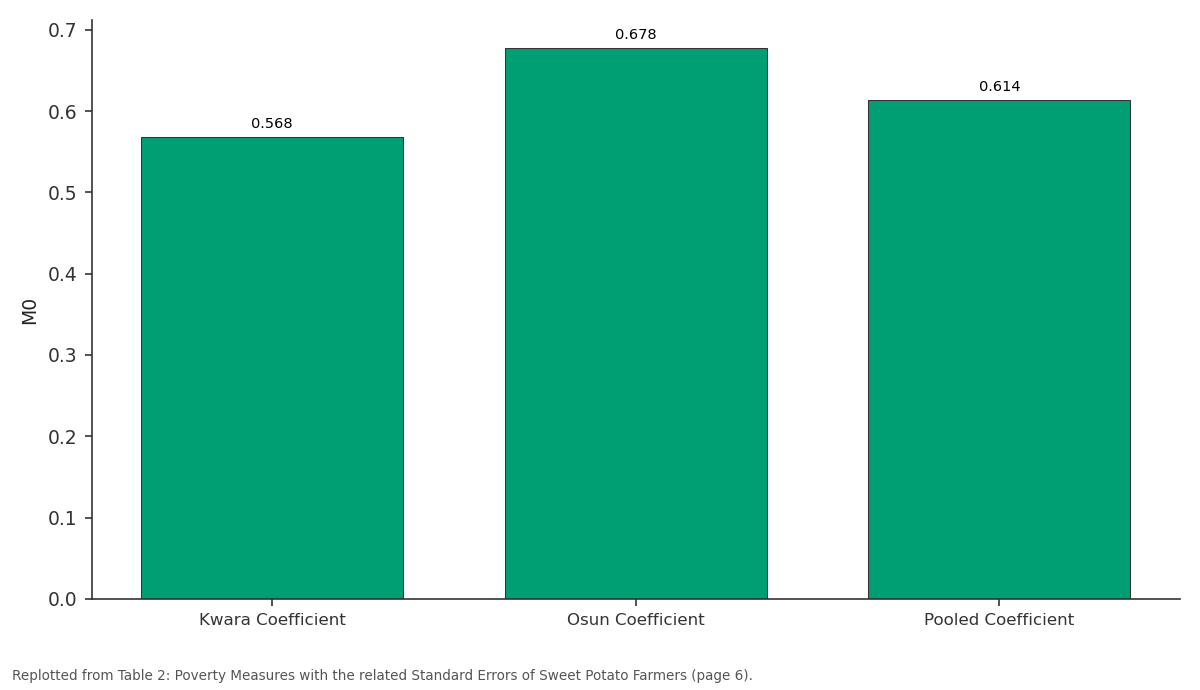
M0: Kwara Coefficient vs Osun Coefficient vs Pooled Coefficient
Replotted from Table 2 (page 6) of the original paper. Every bar is the paper's own table value.
View source evidence ↗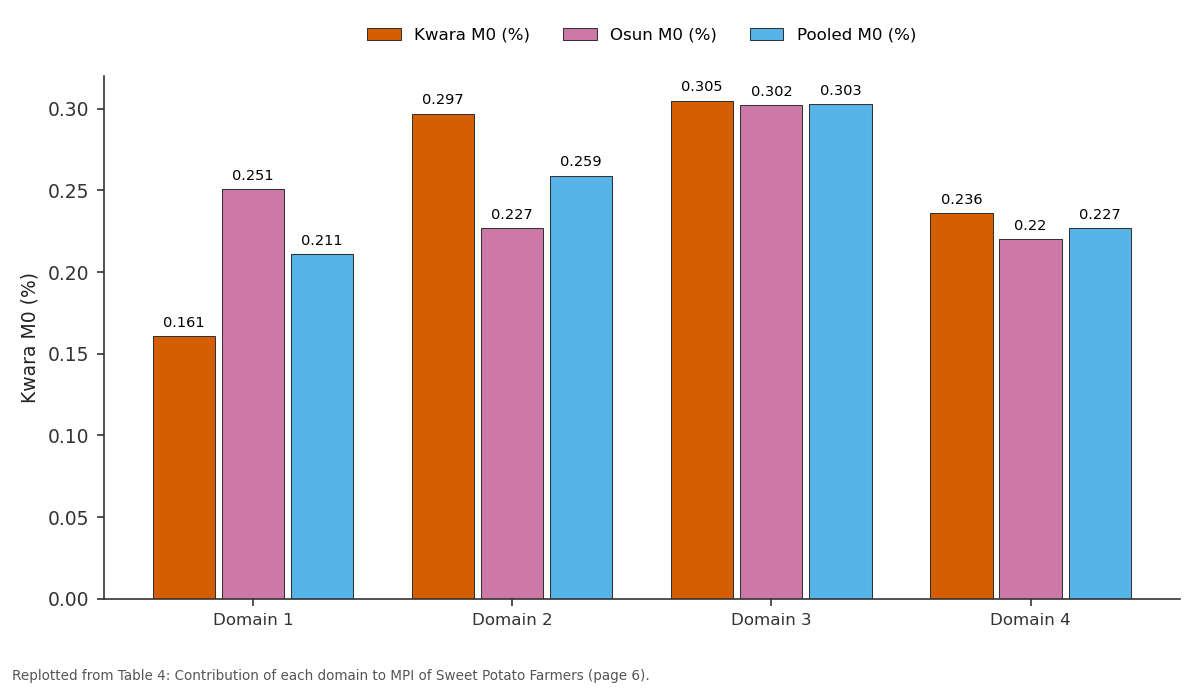
Kwara M0 (%) and Osun M0 (%) and more: Domain 1 vs Domain 2 vs Domain 3 vs Domain 4
Replotted from Table 4 (page 6) of the original paper. Every bar is the paper's own table value.
View source evidence ↗Figures & tables
From the original paper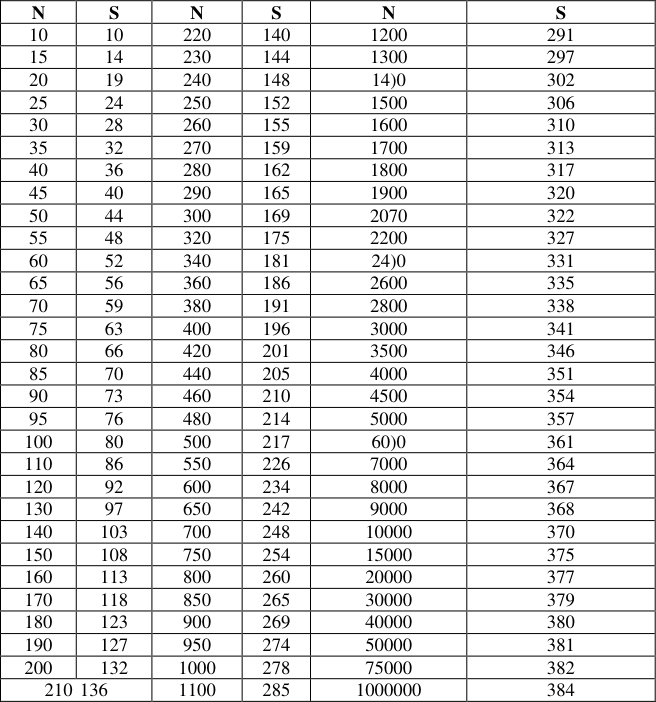 Table 1
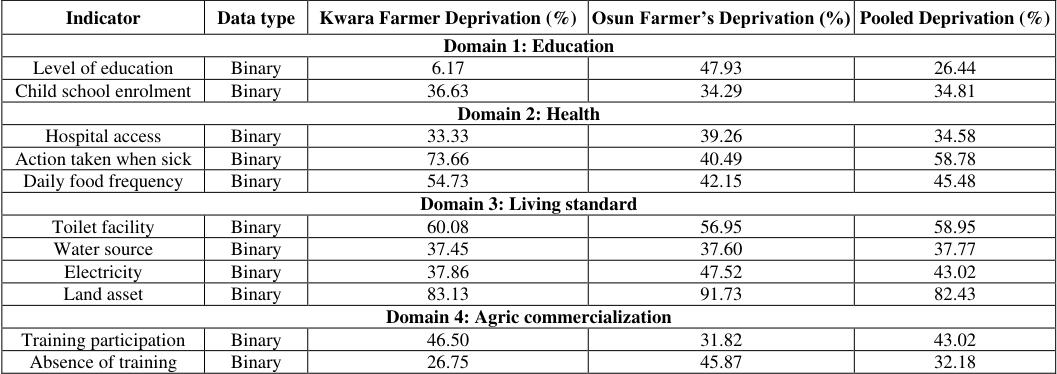 Table 1
 Table 2
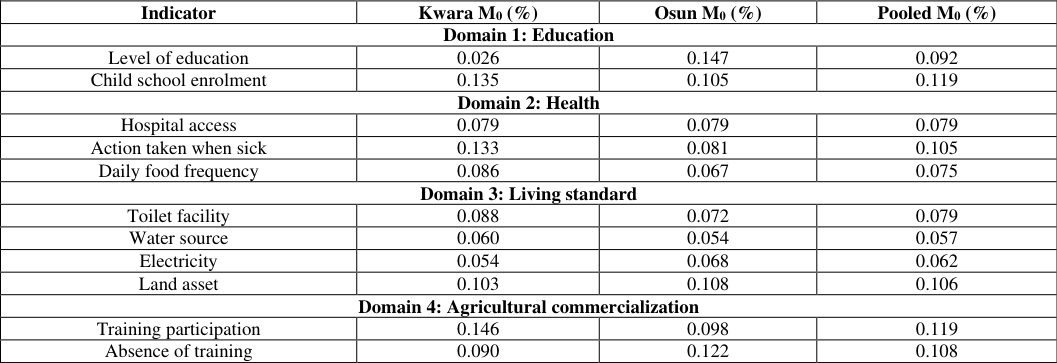 Table 3
 Table 4
 Table 5
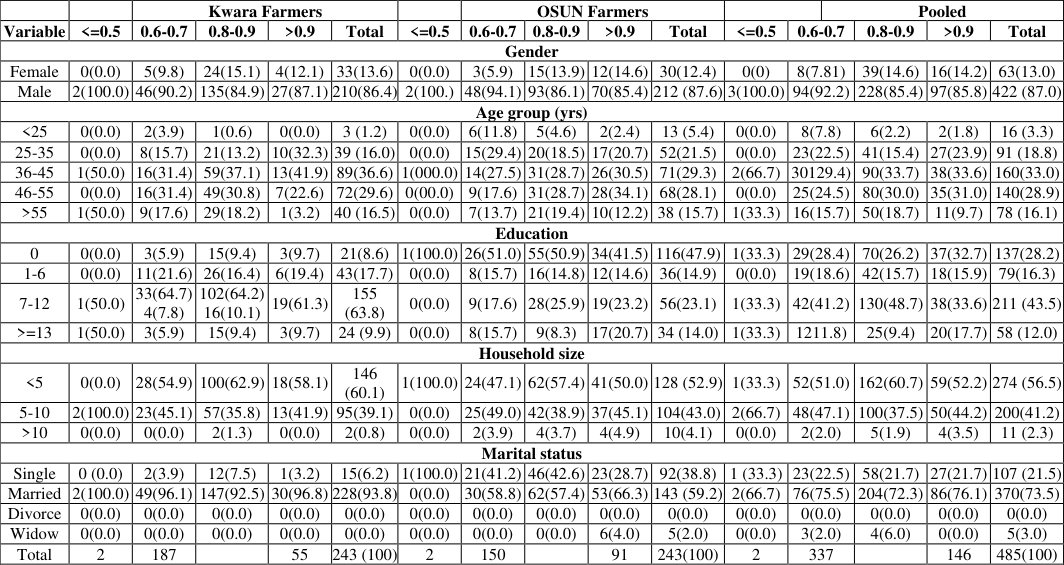 Table 6
Introduction
Background of the Study: Sweet potato (Ipomoea batatas L. Lam) is a climber and perennial plant belonging to the Convolvulaceae family (Yan et al., 2014) [9] sweet potato ranks as the fifth most important food crop in the tropics and the seventh in the world food production after wheat, rice, maize, potato, barley, and cassava (FAO 2019) [11] . In the world production of sweet potato, Asia accounts for closeto76%, followed by the African continent (19.5%). Among the top five producers are China, Nigeria, Uganda, Indonesia, and the Agriculture is important to live most especially; people living in rural areas and relies on farming for securing their daily livelihood. On average the sector contributes 33% of national income, 70% of full-time employment and 40% of total export earnings in Africa (Otsuka et al., (2013) [5] . Availability of storage is a precursor for improved postharvest management and marketing practices, Lack of access to storage facility often leads to selling at lower price due to the perishability nature of the produce, thereby resulting in sub-optimal outcomes. Access to storage facility on the other hand offers the farmer the flexibility to postpone the sale to a later date when the market conditions are more favorable and also to choose the agency with which to enter into a sale transaction. Although, food insecurity has been attributed to factors such as soil infertility and inadequate capacity to adoption and sustain new innovation production practices such as adoption of production technology, fertilizer use, improved seed and irrigation (Sahley et al, 2005) [7] . This clearly shows that transforming subsistence to a more commercialized production could improve the household access to diverse types of food due to increased purchasing power. Sweet potato is particularly a suitable food security crop as it produces high yields in a short growing season even under low rainfall (Kone, 1992) [3] . Olarinde et al., (2020) [4] estimated multidimensional poverty of cassava producers in Nigeria, by determining the factors responsible for poverty increase and contribution(s) of these factors to poverty, and found that about 74% of the respondents were multi-dimensionally poor, Assets and public/housing utility as the main contributors to aggregate multidimensional poverty index (MPI), while education and health contributed most to poverty reduction. Also, that major contributing indicators to MPI to be formal employment, school enrolment, years of schooling, frequency of hospital visits, and household assets' ownership. The estimated coefficient of age, farming experience, years of schooling, household size, and access to informal credit were significant determinants of poverty in the study area. The study examined the multidimensional poverty and commercialization level of sweet potato farmers in Kwara and Osun States.
Research Methodology The study Areas
The study was carried out in Kwara and Osun States of Nigeria.
Sampling Procedure and Sample Size
Multistage sampling technique was used in the selection of the respondents, due to the population density of the study area and also, for the selection of major producers and processors of sweet potato. Firstly, two states were purposively selected, secondly, four Local Government Areas (LGAs) were selected purposively from each selected state that are major producers of sweet potatoes crop, making a total of eight LGAs. Thirdly, from each of the four LGAs per state, four sweet potatoes farming and processing villages were randomly selected making a total of 32 communities for the two states. Lastly, Krejcie and Morgan (1970) [10] sample table was used to select 248 farmers for each of the two selected states respectively based on their population size of 700, making a total of 486 famers selected for this study. [10] Krejcie and Morgan (1970) [10] Total number of respondents used was constructed using the following formula for calculating sample size. s = X 2 NP(1-P) ÷ d 2 (N -1) + X 2 P(1-P). s = required sample size. X 2 = the table value of chi-square for 1 degree of freedom at the desired confidence level (3.841). N = The population size. = 700 P = the population proportion (assumed to be .50 since this would provide the maximum sample size). d = the degree of accuracy expressed as a proportion (.05).
Farmer's population: N was selected to be 700 Sf = 3.841x700x0.50 (1-0.05)/ (0.05) 2 (700-1) +3.841x0.5 (1-0.5) Sf = 1344.35(0.5)/ (0.0025) (699) +1.9205(0.5) Sf = 672.175/1.7475+0.96025 Sf = 672.17/2.70775 Sf = 248.24 Sf = 248 Farmers Respondents per state
Nature and Sources of Data
Primary data was used for this study and data was obtained through the administration of structured questionnaire to the respondents in selected study areas.
Analysis of data collected
Multidimensional poverty index was used to analyze the poverty level of sweet potato and Commercialization Index to analyze the commercialization level of the farmers in the study area.
Results and Discussions Poverty level of Sweet Potato Farmers in the Study Areas
Table 1 shows the result of Multi-dimensional Poverty Index (MPI) output with a summary of the deprivation indicators. The indicators are organized in deprivations domains, and for each of them MPI shows the data type and the share of deprived individuals from the total population. These binary indictors were constructed under four domains (Education, health, living standard and agricultural commercialization) and the AF measure was estimated with a poverty cutoff of 0.36 (36% respectively. This also shows that Osun state sweet potato farmers were also considered to be poor, since majority of the indicators were above the cutoff level of deprivation level (36%). Where after, the pooled deprivation revealed the result of MPI output with a summary of the deprivation indicators which begins with Education domain deprivation to be 26.4% level of education, and 35% level of Child school enrolment. Domain 2, which is Health contains Hospital at deprivation level of 34.6%, Action taken when seek with 58.8%, and Daily food frequency at 45.5%. Living standard which is domain 3 contains of Toilet facility with deprivation level of 59%, Water source 37.8%, Electricity 43%, and Land 82.4%. Then the last domain which is Agricultural commercialization comprises of Training participation, and Absence of training which have deprivation level of 43% and 32.2% respectively. This implies that since the numbers of indicators that have deprivation value greater than the cut off level of 36% are more than four simultaneous deprivations, it therefore indicates that sweet potato farmers in the study areas were considered poor.
| Indicator | Data type | Kwara Farmer Deprivation (%) | Osun Farmer’s Deprivation (%) | Pooled Deprivation (%) |
|---|---|---|---|---|
| Domain 1: Education | ||||
| Level of education | Binary | 6.17 | 47.93 | 26.44 |
| Child school enrolment | Binary | 36.63 | 34.29 | 34.81 |
| Domain 2: Health | ||||
| Hospital access | Binary | 33.33 | 39.26 | 34.58 |
| Action taken when sick | Binary | 73.66 | 40.49 | 58.78 |
| Daily food frequency | Binary | 54.73 | 42.15 | 45.48 |
| Domain 3: Living standard | ||||
| Toilet facility | Binary | 60.08 | 56.95 | 58.95 |
| Water source | Binary | 37.45 | 37.60 | 37.77 |
| Electricity | Binary | 37.86 | 47.52 | 43.02 |
| Land asset | Binary | 83.13 | 91.73 | 82.43 |
| Domain 4: Agric commercialization | ||||
| Training participation | Binary | 46.50 | 31.82 | 43.02 |
| Absence of training | Binary | 26.75 | 45.87 | 32.18 |
Table text extracted from the original PDF; superscript letters are shown inline. The original table image is below.
View original table image
| N | S | N | S | N | S |
|---|---|---|---|---|---|
| 10 | 10 | 220 | 140 | 1200 | 291 |
| 15 | 14 | 230 | 144 | 1300 | 297 |
| 20 | 19 | 240 | 148 | 14)0 | 302 |
| 25 | 24 | 250 | 152 | 1500 | 306 |
| 30 | 28 | 260 | 155 | 1600 | 310 |
| 35 | 32 | 270 | 159 | 1700 | 313 |
| 40 | 36 | 280 | 162 | 1800 | 317 |
| 45 | 40 | 290 | 165 | 1900 | 320 |
| 50 | 44 | 300 | 169 | 2070 | 322 |
| 55 | 48 | 320 | 175 | 2200 | 327 |
| 60 | 52 | 340 | 181 | 24)0 | 331 |
| 65 | 56 | 360 | 186 | 2600 | 335 |
| 70 | 59 | 380 | 191 | 2800 | 338 |
| 75 | 63 | 400 | 196 | 3000 | 341 |
| 80 | 66 | 420 | 201 | 3500 | 346 |
| 85 | 70 | 440 | 205 | 4000 | 351 |
| 90 | 73 | 460 | 210 | 4500 | 354 |
| 95 | 76 | 480 | 214 | 5000 | 357 |
| 100 | 80 | 500 | 217 | 60)0 | 361 |
| 110 | 86 | 550 | 226 | 7000 | 364 |
| 120 | 92 | 600 | 234 | 8000 | 367 |
| 130 | 97 | 650 | 242 | 9000 | 368 |
| 140 | 103 | 700 | 248 | 10000 | 370 |
| 150 | 108 | 750 | 254 | 15000 | 375 |
| 160 | 113 | 800 | 260 | 20000 | 377 |
| 170 | 118 | 850 | 265 | 30000 | 379 |
| 180 | 123 | 900 | 269 | 40000 | 380 |
| 190 | 127 | 950 | 274 | 50000 | 381 |
| 200 | 132 | 1000 | 278 | 75000 | 382 |
| 210 136 | 1100 | 285 | 1000000 | 384 |
Table text extracted from the original PDF; superscript letters are shown inline. The original table image is below.
View original table image
Multidimensional Poverty Index Parameters for Sweet Potato Farmers
Table 2 displays the AF (MPI) poverty measures with the related standard errors. The tables consist of three MPI parameters: M 0 (the MPI estimate); H (the incidence of the poor in the population); and A (the average intensity of simultaneous deprivations among the poor). Since the model made use of only binary indicators the MPI computes only M 0 . The result shows that the MPI of the population of sweet potato farmers in Kwara state accounted for 29.6%. This reflects that the respondents in Kwara state were severely in poverty and the degree to which they are deprived. H which is the poverty incidence estimates the proportion of the population are multi-dimensionally poor at 0.568. This implies that 56.8% of potato farmers in Kwara state are multi-dimensionally poor. The final MPI parameter A, which is the average intensity of simultaneous deprivations among the poor accounted for 0.522. This gives an indication that the intensity of deprivations across the dimensions is 52.2%, which is averagely high. At the same time the result also shows the MPI of the population of sweet potato farmers in Osun state to be accounted for this reflects that the respondents in Osun state were severely poor and the degree to which they are deprived. H which is the poverty incidence estimates the proportion of the population are multi-dimensionally poor at 0.678. This implies that 67.8% of potato farmers in Osun state are multi-dimensionally poor. The final MPI parameter A, which is the average intensity of simultaneous deprivations among the poor accounted for 0.530. This gives an indication that the intensity of deprivations across the dimensions is 53%.
| MPI | Kwara Coefficient | Kwara Standard Error | Osun Coefficient | Osun Standard Error | Pooled Coefficient | Pooled Standard Error |
|---|---|---|---|---|---|---|
| M0 | 0.568 | 0.032 | 0.678 | 0.030 | 0.614 | 0.020 |
| H | 0.296 | 0.017 | 0.360 | 0.017 | 0.321 | 0.011 |
| A | 0.522 | 0.009 | 0.530 | 0.009 | 0.523 | 0.006 |
Table text extracted from the original PDF; superscript letters are shown inline. The original table image is below.
View original table image
Whereas, the pooled result shows that the MPI of the population potato farmers in the both states accounted for 32.1%. This reflects both the share of the respondents in poverty and the degree to which they are deprived. H which is the poverty incidence, estimates the proportion of the population that are multi-dimensionally poor at 0.614. This implies that 61.4% of potato farmers in both states are multi-dimensionally poor. Then MPI parameter A, which is the average intensity of simultaneous deprivations among the poor accounted for 0.523. This gives an indication that the intensity of deprivations across the dimensions is 52.3%, this pooled result confirmed the severity of poverty level of the respondents in both Kwara and Osun states.
Multidimensional Poverty Index Overall Decomposition of Sweet Potato Farmers
Table 3 of the MPI output shows the percentage of contribution of each of the indicators to the overall index in Kwara state that is, the overall decomposition of the domains and indicators. For education domain, the deprivation in level of education accounted for 2.6% of the overall value of M 0, 13.5% accounted for Child school enrolment. In the Health domain: deprivation level for Hospital access was 7.9%, the action taking when seek accounted for 13.3%, and daily food frequency accounted for 8.6%. Under the standard of living of the respondents; owning toilet facility accounted for 8.8%, water source has a deprivation of 6.0% that of electricity was 5.4%, while land asset was 10.3%. Lastly, under Agricultural commercialization awareness; training participation accounted for 14.6%, and Absence of training accounted for the deprivation level of 9%. It also shows the percentage of contribution of each of the indicators to the overall index in Osun state that is, the overall decomposition of the domains and indicators. For education domain, the deprivation in level of education accounted for 2.6% of the overall value of M 0, 13.5% accounted for Child school enrolment. In the Health domain: deprivation level for Hospital access was 7.9%, the action taking when seek accounted for 13.3%, and daily food frequency accounted for 8.6%. Under the standard of living of the respondents; owning toilet facility accounted for 8.8%, water source has a deprivation of 6.0% that of electricity was 5.4%, while land asset was 10.3%. Lastly, under Agricultural commercialization awareness; training participation accounted for 14.6%, and Absence of training accounted for the deprivation level of 9%. The pooled result of the MPI output shows the percentage of contribution of each of the indicators to the overall index, that is, the overall decomposition of the domains and indicators. For education domain, the deprivation in level of education accounted for 9.2% of the overall value of M 0, 11.9% accounted for Child school enrolment. In the Health domain: deprivation level for Hospital access was 7.9%, the action taking when seek accounted for 10.5%, and daily food frequency accounted for 7.5%. Under the standard of living of the respondents; owning toilet facility accounted for 7.9%, water source has a deprivation of 5.7% that of electricity was 6.2%, while land asset was 10.6%. Lastly, under Agricultural commercialization awareness; training participation accounted for 11.9%, and Absence of training accounted for the deprivation level of 10.8%.
| Indicator | Kwara M0 (%) | Osun M0 (%) | Pooled M0 (%) |
|---|---|---|---|
| Domain 1: Education | |||
| Level of education | 0.026 | 0.147 | 0.092 |
| Child school enrolment | 0.135 | 0.105 | 0.119 |
| Domain 2: Health | |||
| Hospital access | 0.079 | 0.079 | 0.079 |
| Action taken when sick | 0.133 | 0.081 | 0.105 |
| Daily food frequency | 0.086 | 0.067 | 0.075 |
| Domain 3: Living standard | |||
| Toilet facility | 0.088 | 0.072 | 0.079 |
| Water source | 0.060 | 0.054 | 0.057 |
| Electricity | 0.054 | 0.068 | 0.062 |
| Land asset | 0.103 | 0.108 | 0.106 |
| Domain 4: Agricultural commercialization | |||
| Training participation | 0.146 | 0.098 | 0.119 |
| Absence of training | 0.090 | 0.122 | 0.108 |
Table text extracted from the original PDF; superscript letters are shown inline. The original table image is below.
View original table image
Multidimensional Poverty Index Derivative per Domain of Sweet Potato Farmers
Table 4 of MPI output provides the contribution of each of the deprivations per domains. For Kwara state farmers, domain 1 whose indicators are level of education and child/children school enrollment contributed 16.6% to the overall value of M 0 , Domain 2 whose indicators are contributed 29.7% to the overall value of M 0, Domain 3 whose indicators are contributed 30 5% to the overall value of M 0 . And Domain 4 whose indicators are training participation and absence of training contributed 23.6% to the overall value of M 0 . This implies that the contribution of each of the deprivations per domain was not up to the cut off value of deprivation which means that at each domain, the sweet potato farmers are not poor. This is also applicable for Osun state sweet potato farmers of which domain 1 whose indicators are level of education and child/children school enrollment contributed 25.1% to the overall value of M 0 , Domain 2 whose indicators are contributed 22.7% to the overall value of M 0, Domain 3 whose indicators are contributed 30.2% to the overall value of M 0 . And Domain 4 whose indicators are training participation and absence of training contributed 22% to the overall value of M 0 . This implies that the contribution of each of the deprivations per domain was not up to the cut off value of deprivation which means that at each domain, the sweet potato farmers are not poor. The pooled result of MPI output provides the contribution of each of the deprivations per domains. For instance, domain 1 whose indicators are level of education and child/children school enrollment contributed 21% to the overall value of M 0 , Domain 2 whose indicators are contributed 25.7% to the overall value of M 0, Domain 3whose indicators are contributed 30% to the overall value of M 0 . And Domain 4 whose indicators are training participation and absence of training contributed 23% to the overall value of M 0 . This implies that the contribution of each of the deprivations per domain was not up to the cut off value of deprivation which means that at each domain, the sweet potato farmers not poor in the study areas. This corroborates with the results got per each state of the respondents.
| Domain | Kwara M0 (%) | Osun M0 (%) | Pooled M0 (%) |
|---|---|---|---|
| Domain 1 | 0.161 | 0.251 | 0.211 |
| Domain 2 | 0.297 | 0.227 | 0.259 |
| Domain 3 | 0.305 | 0.302 | 0.303 |
| Domain 4 | 0.236 | 0.220 | 0.227 |
Table text extracted from the original PDF; superscript letters are shown inline. The original table image is below.
View original table image
Commercialization Index of sweet potato Farmers
The result in table 5 revealed that the mean value of sweet potato household commercialization index of sweet potato farmers in both Kwara and Osun state was about 0.8 which falls on the household commercialization index greater than 0.8 ratio of quantity sold to quantity produce by the sweet potato farmers in both states have low level of commercialization. It also showed that the highest level of commercialization was 49.8% in kwara state, and 51.2% in Osun state. The pooled result revealed also confirm the individual state of sweet potato farmers considered, that the mean value of sweet potato household commercialization index of sweet potato farmers in both states was also 0.8 which falls on the household commercialization index greater than 0.8 ratio of quantity sold to quantity produce by the farmers. This implies that sweet potato farmers in the study area moved a little bit above average towards commercialization of sweet potato. This corroborates with the findings of Oyebamiji et al., (2019) [6] , that "commercialization can be measured along a continuum from zero (total subsistenceoriented production) to unity (100% production sold)". It also showed that the highest level of commercialization was 51%, this also corroborates with the findings of Oyebamiji et al., (2019) [6] were between the ranges of 50.01-75.00 which amounted to 51.7% maize commercialization level.
| Variable | Kwara Farmers | — | — | Osun Farmers | — | — | Pooled Farmers | — | — |
|---|---|---|---|---|---|---|---|---|---|
| Household Commercialization Index | Freq | % | Mean | Freq. | % | Mean | Freq | % | Mean |
| <0.60 | 2 | 0.82 | 0.79 | 0 | 0.00 | 0.82 | 2 | 0.41 | 0.81 |
| 0.60 -0.70 | 50 | 20.58 | 51 | 21.07 | 101 | 20.82 | |||
| 0.71 – 0.80 | 70 | 28.81 | 67 | 27.69 | 137 | 28.25 | |||
| >0.8 | 121 | 49.79 | 124 | 51.24 | 245 | 50.52 | |||
| Total | 243 | 100.00 | 242 | 100.00 | 485 | 100.00 |
Table text extracted from the original PDF; superscript letters are shown inline. The original table image is below.
View original table image
Commercialization level profile distribution by socioeconomic characteristics:
The categorization of sweet potato farmers into commercialization level profile was done to relate differences in commercialization level to socio-economic characteristics. Table 6 presents the socioeconomic characteristics in relation to the commercialization level of the respondents in both Kwara and Osun States respectively. Generally, it was revealed that there was relationship between the socio-economic characteristics of the respondents in both state and commercialization level most especially at the index range between 0.8-0.9. This implies that sweet potato farmers in both states engage in commercialization of their crop. The result reveals that 85% of farmers in Kwara State were male within the commercialization index range of 0.8-0.9 index, and 86% for the Osun farmers with the same index value range between 0.8-0.9. it was shows that between the age ratio of 36-45 years of the respondent in both states were well commercialized (37.1% and 28.7%) respectively, within the index range of 0.8-0.9. about 64% of level of education between 7-12 years (secondary school) of the respondent in Kwara State engaged in commercialization which falls within the index range of 0.8-0.9, whereas in Osun State farmers with non-formal education engaged majorly in sweet potato commercialization (50.9%) which falls within the index range of 0.8-0.9. This supports the idea that educational level of the sweet potato farmers has effect on commercialization level of the crop. About 63% and 57% of farmers in both states with less than 5 members fall under the index ranges between 0.8-0.9 respectively. It is noteworthy that respondents within 5 -10 household members followed with 35.8% and 38.9% at index of >0.9 in Kwara and Osun States respectively. Also, 92.5% of the index within 0.8-0.9 categories were married in Kwara State, while 57.4% of the same index ranges or category were married followed by 66.3% at index > 0.9. Therefore, the socio-economic characteristics in the study area are perceived to have enhanced commercialization level of sweet potato.
| — | — | Kwara Farmers | — | — | — | — | OSUN Farmers | — | — | — | — | — | Pooled | — | — | — |
|---|---|---|---|---|---|---|---|---|---|---|---|---|---|---|---|---|
| Variable | <=0.5 | 0.6-0.7 | 0.8-0.9 | >0.9 | Total | <=0.5 | 0.6-0.7 | 0.8-0.9 | >0.9 | Total | <=0.5 | 0.6-0.7 | 0.8-0.9 | >0.9 | Total | |
| Gender | ||||||||||||||||
| Female | 0(0.0) | 5(9.8) | 24(15.1) | 4(12.1) | 33(13.6) | 0(0.0) | 3(5.9) | 15(13.9) | 12(14.6) | 30(12.4) | 0(0) | 8(7.81) | 39(14.6) | 16(14.2) | 63(13.0) | |
| Male | 2(100.0) | 46(90.2) | 135(84.9) | 27(87.1) | 210(86.4) | 2(100.) | 48(94.1) | 93(86.1) | 70(85.4) | 212 (87.6) | 3(100.0) | 94(92.2) | 228(85.4) | 97(85.8) | 422 (87.0) | |
| Age group (yrs) | ||||||||||||||||
| <25 | 0(0.0) | 2(3.9) | 1(0.6) | 0(0.0) | 3 (1.2) | 0(0.0) | 6(11.8) | 5(4.6) | 2(2.4) | 13 (5.4) | 0(0.0) | 8(7.8) | 6(2.2) | 2(1.8) | 16 (3.3) | |
| 25-35 | 0(0.0) | 8(15.7) | 21(13.2) | 10(32.3) | 39 (16.0) | 0(0.0) | 15(29.4) | 20(18.5) | 17(20.7) | 52(21.5) | 0(0.0) | 23(22.5) | 41(15.4) | 27(23.9) | 91 (18.8) | |
| 36-45 | 1(50.0) | 16(31.4) | 59(37.1) | 13(41.9) | 89(36.6) | 1(000.0) | 14(27.5) | 31(28.7) | 26(30.5) | 71(29.3) | 2(66.7) | 30129.4) | 90(33.7) | 38(33.6) | 160(33.0) | |
| 46-55 | 0(0.0) | 16(31.4) | 49(30.8) | 7(22.6) | 72(29.6) | 0(00.0) | 9(17.6) | 31(28.7) | 28(34.1) | 68(28.1) | 0(0.0) | 25(24.5) | 80(30.0) | 35(31.0) | 140(28.9) | |
| >55 | 1(50.0) | 9(17.6) | 29(18.2) | 1(3.2) | 40 (16.5) | 0(0.0) | 7(13.7) | 21(19.4) | 10(12.2) | 38 (15.7) | 1(33.3) | 16(15.7) | 50(18.7) | 11(9.7) | 78 (16.1) | |
| Education | ||||||||||||||||
| 0 | 0(0.0) | 3(5.9) | 15(9.4) | 3(9.7) | 21(8.6) | 1(100.0) | 26(51.0) | 55(50.9) | 34(41.5) | 116(47.9) | 1(33.3) | 29(28.4) | 70(26.2) | 37(32.7) | 137(28.2) | |
| 1-6 | 0(0.0) | 11(21.6) | 26(16.4) | 6(19.4) | 43(17.7) | 0(0.0) | 8(15.7) | 16(14.8) | 12(14.6) | 36(14.9) | 0(0.0) | 19(18.6) | 42(15.7) | 18(15.9) | 79(16.3) | |
| 7-12 | 1(50.0) | 33(64.7) 4(7.8) | 102(64.2) 16(10.1) | 19(61.3) | 155 (63.8) | 0(0.0) | 9(17.6) | 28(25.9) | 19(23.2) | 56(23.1) | 1(33.3) | 42(41.2) | 130(48.7) | 38(33.6) | 211 (43.5) | |
| >=13 | 1(50.0) | 3(5.9) | 15(9.4) | 3(9.7) | 24 (9.9) | 0(0.0) | 8(15.7) | 9(8.3) | 17(20.7) | 34 (14.0) | 1(33.3) | 1211.8) | 25(9.4) | 20(17.7) | 58 (12.0) | |
| Household size | ||||||||||||||||
| <5 | 0(0.0) | 28(54.9) | 100(62.9) | 18(58.1) | 146 (60.1) | 1(100.0) | 24(47.1) | 62(57.4) | 41(50.0) | 128 (52.9) | 1(33.3) | 52(51.0) | 162(60.7) | 59(52.2) | 274 (56.5) | |
| 5-10 | 2(100.0) | 23(45.1) | 57(35.8) | 13(41.9) | 95(39.1) | 0(0.0) | 25(49.0) | 42(38.9) | 37(45.1) | 104(43.0) | 2(66.7) | 48(47.1) | 100(37.5) | 50(44.2) | 200(41.2) | |
| >10 | 0(0.0) | 0(0.0) | 2(1.3) | 0(0.0) | 2(0.8) | 0(0.0) | 2(3.9) | 4(3.7) | 4(4.9) | 10(4.1) | 0(0.0) | 2(2.0) | 5(1.9) | 4(3.5) | 11 (2.3) | |
| Marital status | ||||||||||||||||
| Single | 0 (0.0) | 2(3.9) | 12(7.5) | 1(3.2) | 15(6.2) | 1(100.0) | 21(41.2) | 46(42.6) | 23(28.7) | 92(38.8) | 1 (33.3) | 23(22.5) | 58(21.7) | 27(21.7) | 107 (21.5) | |
| Married | 2(100.0) | 49(96.1) | 147(92.5) | 30(96.8) | 228(93.8) | 0(0.0) | 30(58.8) | 62(57.4) | 53(66.3) | 143 (59.2) | 2(66.7) | 76(75.5) | 204(72.3) | 86(76.1) | 370(73.5) | |
| Divorce | 0(0.0) | 0(0.0) | 0(0.0) | 0(0.0) | 0(0.0) | 0(0.0) | 0(0.0) | 0(0.0) | 0(0.0) | 0(0.0) | 0(0.0) | 0(0.0) | 0(0.0) | 0(0.0) | 0(0.0) | |
| Widow | 0(0.0) | 0(0.0) | 0(0.0) | 0(0.0) | 0(0.0) | 0(0.0) | 0(0.0) | 0(0.0) | 6(4.0) | 5(2.0) | 0(0.0) | 3(2.0) | 4(6.0) | 0(0.0) | 5(3.0) | |
| Total | 2 | 187 | 55 | 243 (100) | 2 | 150 | 91 | 243(100) | 2 | 337 | 146 | 485(100) |
Table text extracted from the original PDF; superscript letters are shown inline. The original table image is below.
View original table image
Conclusion
It is concluded that the mean age of the respondents was between 42 and 45years which implies that they were more responsive and alert strong and at their active age. For their poverty status, the sweet potato farmers were considered poor, since, they have more than four indicators having deprivation values greater than the cut-off level of deprivation (36%). Moreover, commercialization index revealed that the mean level of sweet potato commercialization of the respondents was 84% in both states. This implies that commercializing sweet potato crop and its products have improved the sweet potato farmer's well-being.
Recommendation
Farmer's poverty level is increasing on daily basis due to economic challenges and lack or inadequate level of commercialization of their produces. Therefore, the followings were recommended to minimize poverty level if farmers in the study area. There should be more awareness of the importance of sweep potato value addition to generate more income and improve their standard of living. Government and Non-Governmental Organizations involved in agricultural development should give more attention to rural development to reduce their multidimensional poverty level. Effort to encourage the commercial production and commercialization of sweet potatoes as a competitive alternative to yam by reducing its postharvest losses should be given the needed attention. OSUN Farmers Pooled Variable <=0.5 0.6-0.7 0.8-0.9 >0.9 Total <=0.5 0.6-0.7 0.8-0.9 >0.9 Total <=0.5 0.6-0.7 0.8-0.9 >0.9 Total Gender Female 0(0.0) 5(9.8) 24(15.1) 4(12.1) 33(13.6) 0(0.0) 3(5.9) 15(13.9) 12(14.6) 30(12.4) 0( 0
Appendixes
Appendixes
References
7 in the original paper- Adewumi MO, Adebayo FA. Profitability and Technical Efficiency of Sweet Potato Production in Nigeria Journal of Rural Development. 2016;31(5):105-120.
- Zuma-Netshiukhwi G. The significance of disadvantaged crop species to improve food systems and security in the changing climate: Learning from Motheo District, South Africa. Int. J Agric. Nutr. 2022;4(1):4452. DOI: 10.33545/26646064.2022.v4.i1a.53
- Olarinde LO, Abass AB, Adepoju AA, Fanifosi EG, Adio MO, Adeniyi OA, et al. Estimating Multidimensional Poverty Among Cassava Producers In Nigeria: Patterns and Socioeconomic Determinants. Sustainability. 2020;12(13):5366. DOI:10.3390/su12135366www.mdpi.com/journal/sustai nability
- Oyebamiji IT, Oladeebo JO, Owojaiye OB, Adetayo SA, Aina OB. Effect of Agricultural Commercialization on the Efficiency of Maize-based Smallholder Farmers in Kwara State, Nigeria. International Journal of Agriculture and Rural Development (IJARD). 2019;22(1):3934-3941.
- Yan L, Gu YH, Tao X, Lai XJ, Zhang YZ, Tan XM, et al. Scanning of transposable elements and analyzing expression of transposase genes of sweet potato [Ipomoea batatas]. PLoS One. 2014;79(3):890-895.
- Krejcie RV, Morgan DW. Determining sample size for research activities. Educational and Psychological Measurement. 1970;30(3):607-610.
- Food and Agriculture Organization of the United Nation. Enhancing Sweet Potato Commercialization in the Kingdom of Eswatini TCP/SWA/3503; 2019.