
Research article · 2024 · Full text
International Journal of Statistics and Applied MathematicsAn analysis of doubling income from crop diversification in Haryana
Volume 9(1S) · Pages 232–237 · DOI: 10.22271/maths.2024.v9.i1sd.1592 ↗
Research areasAgricultural Economics and PracticesAgricultural risk and resilience
Abstract
Author-writtenThis paper examines the change in Income of farmer’s due to crop diversification trend in northern India i.e. Haryana during the recent period. It is based on secondary data collected from various sources. Findings suggest that share of forestry and logging has declined in agricultural income while fisheries have gained. Agriculture including livestock has also gained. Among crop groups, percent of GCA under sugarcane, spices, fibers and cotton has increased significantly whereas it has declined for fodder crops, pulses and cereal. However, paddy, maize and wheat gained. Further, results of change in area, production and yield exhibited gains for cotton, gram, sugarcane, wheat and maize. The future strategy towards crop diversification should favor sustainable crops instead of water incentive crops. Recently, agricultural diversification has attracted considerable attention. The term can be interpreted in several ways such as shift from agriculture to non-agriculture, crops to allied sectors and within crop sector, shift from food grains to high value crops i.e. fruits, vegetables, flowers and spices, etc. There have been significant changes in the pattern of agricultural diversification at the state and regional level. Crop diversification is intended to give a wider choice in the production of a variety of crops in a given area so as to expand production related activities for various crops and also to lessen risk.
Summary
Source-checkedPlain-language reading of the full paper, prepared with AI and checked against the text. Each point links to the authors' own words.
Why it matters
- Agriculture is the primary occupation for over 70% of India's population, who reside in rural areas. View evidence ↗
- Crop diversification aims to reduce risk and expand production activities by allowing farmers to grow a wider variety of crops. View evidence ↗
- The long-term cultivation of wheat and rice has led to significant degradation of natural resources. View evidence ↗
The question
- The study aims to evaluate the success, prospects, and challenges of agricultural crop diversification in Haryana. View evidence ↗
What they did
- The research utilizes secondary data from the Ministry of Agriculture's 'Agricultural Statistics at a Glance' and the Fertilizer Association of India. View evidence ↗
- Primary data for the 2012-13 period was gathered from a sample of 210 farmers. View evidence ↗
What they found
- The share of crops and livestock in total agricultural income rose slightly from 84.30% in 2004-05 to 84.95% in 2011-12. View evidence ↗
- The income share from fisheries grew from 4.80% to 5.39% over the study period. View evidence ↗
- The most significant increases in cultivated area were recorded for sugarcane (36.53%), cotton (36.31%), and gram (26.91%). View evidence ↗
- Cotton saw the highest production increase at 108.30%, followed by gram (61.49%) and maize (57.06%). View evidence ↗
- Productivity (yield) increased across all major crops, with the highest gains in cotton (52.83%), bajra (39.46%), and total pulses (36.74%). View evidence ↗
- In 2011-12, wheat achieved the highest production target at 112.95%, followed by food grains (105.83%) and cotton (103.53%). View evidence ↗
What it means
- The authors recommend that future crop diversification strategies prioritize sustainable crops over those that require high water incentives. View evidence ↗
- The authors conclude that diversifying toward pulses and oilseeds is essential to reduce the country's dependence on exports. View evidence ↗
Visual summary
1 visualsIllustrations explain the paper; charts are replotted from the paper's own table values.
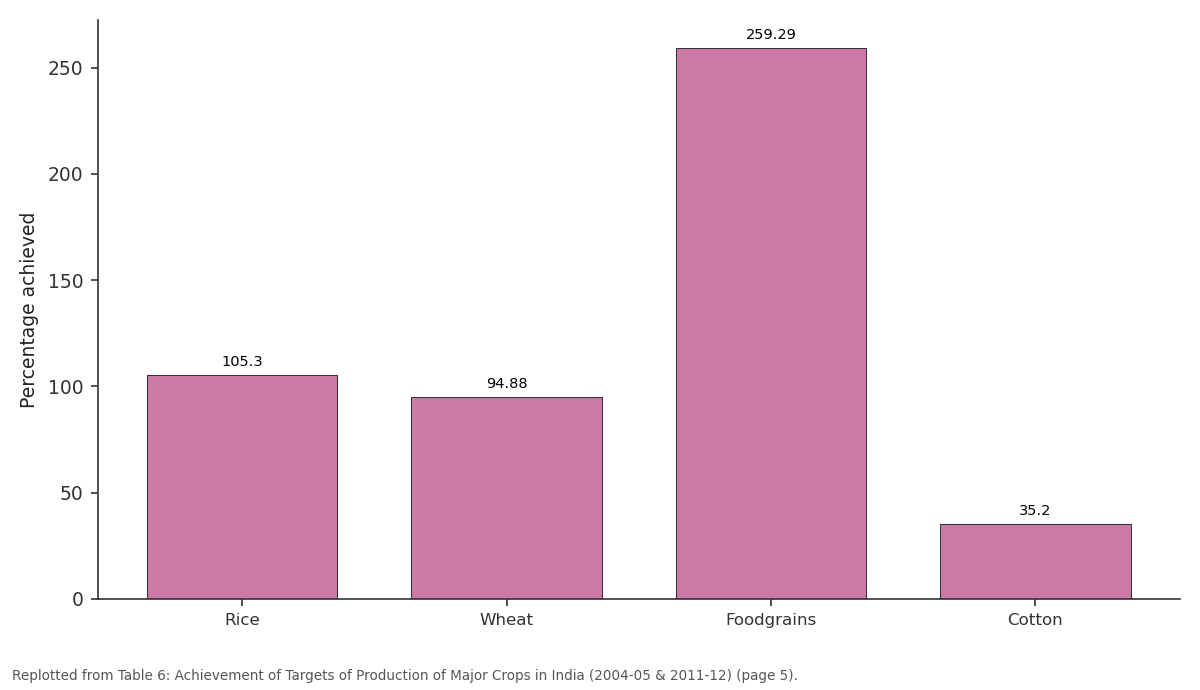
Achievement: Rice vs Wheat vs Foodgrains vs Cotton
Replotted from Table 6 (page 5) of the original paper. Every bar is the paper's own table value.
View source evidence ↗Figures & tables
From the original paper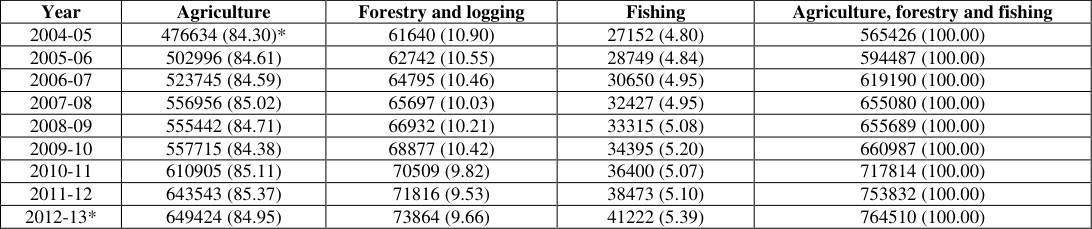 Table 1
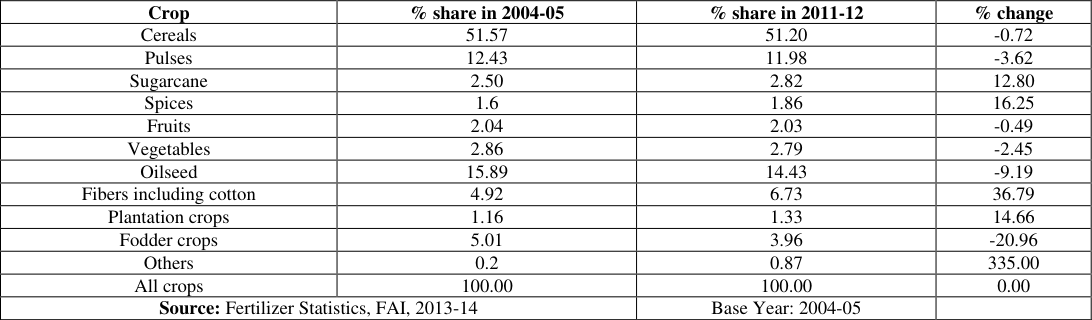 Table 2
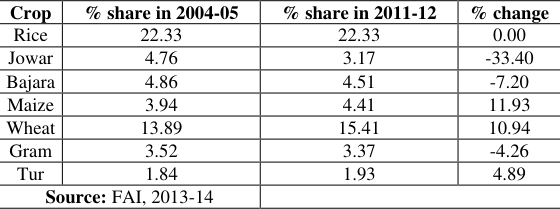 Table 3
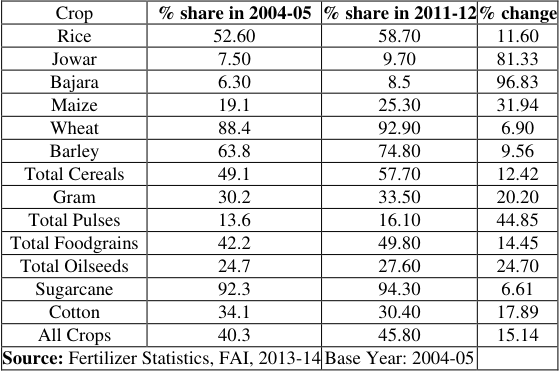 Table 4
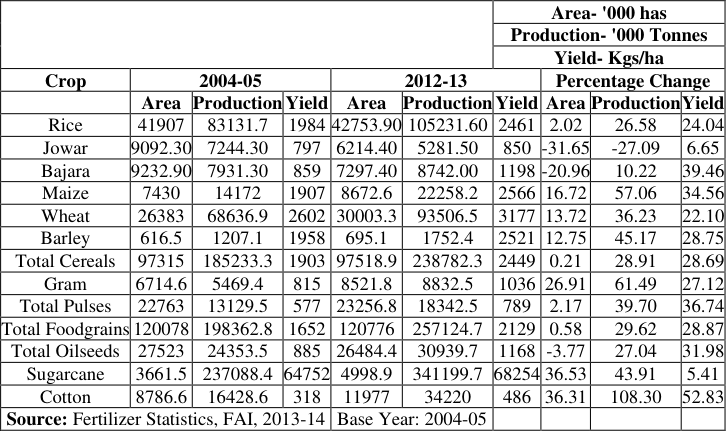 Table 5
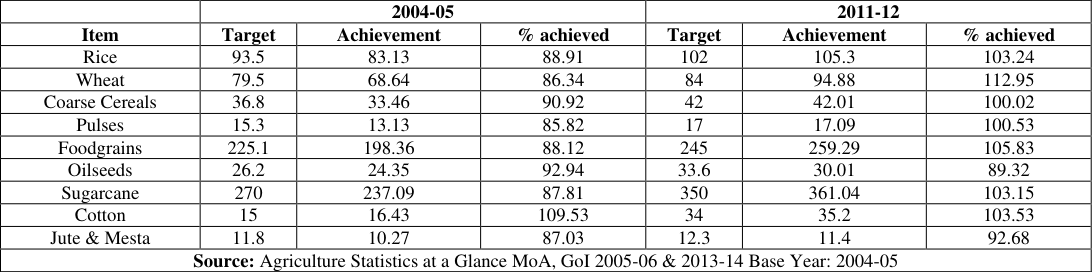 Table 6
Introduction
India is a country of billion plus population. More than 70 percent of India's population lives in rural areas whose main occupation of the workers in agriculture. Moreover, Indian agriculture is characterized by small farm holdings. The average farm size in the country is 1.57 hectares. Around 93 percent of farmers have land holdings smaller than 4 hectares and they cultivate nearly 55 percent of the arable land. On the other hand, only 1.6 percent of the farmers have operational land holdings above 10 hectares and they utilize 17.4 percent of the total cultivated land. Owning to diverse agro-climatic conditions in the country, a large number of agricultural items are produced. 'Self-reliance' in food grains has been the cornerstone of our policies in the past 50 years. As a result, around 63 percent of the gross cropped area is under food grain crops (cereals and pulses). The pattern of crops is increasingly influenced by economic and technological factors. This is due to expansion in irrigation, infrastructure development, penetration of rural markets, development and spread of short duration and drought resistant crop technologies of late, high value crops such as fruits and vegetables have attracted the farmers and acreage under these crops is increasing continuously. Crop diversification in northern states of India i.e. Haryana is generally viewed as a shift from traditionally grown less remunerative crops to more remunerative crops. In this paper, we shall focus on crop diversification from one crop to other crop. The analysis in this article is based on secondary data collected from Agricultural Statistics at a Glance published by the Ministry of Agriculture, Government of India and Fertilizer statistics published by Fertilizer Association of India, New Delhi. We have covered a period from 2004-05 to the recent period. The crop sub-sector has been steadily diversifying in northern states of India i.e. Haryana. Evidences show that the non-foodgrain crops have gradually replaced food grain crops.
Non-foodgrain crops, like oilseeds, fruits, vegetables, spices and sugarcane are primarily substituted for coarse cereals in search of higher incomes. We have covered a period from 2004-05 to 2011-12 because significant change in crop pattern has taken place after 2000. A comparison of changes in these two years 2004-05 and 2011-12 is expected to provide some useful insights for future sustainability of agriculture.
Methodology
This study is conducted in the state of Haryana. It is based on published and un-published sources of secondary and primary data. The relevant information about the state and districts was obtained from various issues of the Statistical Abstract of Haryana, Government of Haryana, Panchkula. Further, the time series data on area, production and yield of paddy and alternative crops for selected districts and state were also culled out from this source. The required preliminary information regarding the selection of blocks and villages was obtained from the district officials. The meetings with the Deputy Directors of Agriculture of selected districts were useful and informative. The crops for the study were decided as per the study design according research. were selected on the same criterion. A questionnaire was canvassed to the farmers growing these crops. All farm size categories i.e. small, medium and large were covered in the sample. The number of farm households in each category was decided according to their proportion at the district level. The primary data pertaining to the year 2012-13 were collected from 210 farmers. Haryana has introduced progressive agricultural schemes to boost sustainable growth in agriculture. There are over three dozen schemes aimed at agricultural development in Haryana which are being implemented by the state directly or in collaboration with the central government. Major thrust of these schemes and policies are to make agricultural production more sustainable, remunerative and climate resilient by promoting location specific integrated/composite farming. For instance, the objective of the Scheme for Promotion of Crop Diversification is to promote the alternate crops like summer moong, sunflower and maize in order to reduce wheat and paddy crop rotation. Cultivation of rice and wheat over a prolonged period has caused degradation of natural resources to a great extent. 5 The major rationales for promotion of crop diversification are as follows: a.) due to extensive specialised cultivation ground water table has significantly deteriorated; b.) government procurement agencies are facing challenge in procuring and storage of conventional cereals; c). central agencies are not able to procure 100 percent wheat and rice based on MSP; d) due to high dependence on import to meet the shortage of pulses and edible oil seeds etc.; and e.) change in consumption pattern especially among middle-and high-income groups. 5Brief description of schemes for the year 2015-16, Government of Haryana. 4 Objectives of the Study Against this background, the present study has been conducted to assess the prospects and challenges as also to evaluate the success of diversification of agricultural crops in Haryana. The present study postulated the following objectives keeping in mind that the changing cropping pattern is thought to be determined by the interactive effects of several factors: 1. To access the status and magnitude of crop diversification in the state; 2. To analyse the impact of physical, socio-economic and technological factors on crop diversification; 3. To analyse the status of utilization of cropping intensity and crop diversification schemes accessible to all categories of farmers; 4. To study the feasibility of changing crop patterns in respect of improvement in productivity of other crops in rotation; 5. To examine the impact of input and resource-related factors like irrigation, rainfall, soil fertility and availability of high yielding seeds and fertilizers on crop diversification; 6. To study the farmers' perception on institutional and infrastructure related challenges in the process of diversification of crops; and 7. Evidently, this is not a major shift. On the other hand, proportion of income from forestry and logging has declined through this period. Fisheries emerged as the rising sub-sector of agriculture. The higher growth in inland fisheries was basically attributed to the overwhelming progress in aquaculture, both in fresh and brackish waters. Its share increased from 4.80 to 5.39 percent during this period. The remarkable progress in fisheries sector was the outcome of a well-knit strategy to accomplish multiple goals of augmenting production, enhancing export, and overcoming poverty of fishermen. Several production and developmentoriented programs were launched in the potential areas. To sum up, some change in shares of sub-sectors could be observed but it cannot be termed as a major shift. After analyzing share of income from agriculture, forestry and fishing, we have examined percentage share of important crop groups during 2004-05 and 2011-12. We have included important crop groups ranging from cereals (51.57%), pulses (12.43%) to fodder crops (5.01%). The data clearly indicate that cereals occupying an area of 51.57 percent of GCA in 2004-05 are dominant crops in India. Oilseeds and pulses were allotted 15.89 and 12.43 percent respectively. Fodder crops (5.01%) and fibers including cotton (4.92%) fall next. Vegetables (2.86%), sugarcane (2.50%) and fruits (2.04%) received more than 2 percent of cultivated area. Nevertheless, percentage change under fodder crops (-20.96%), oilseeds (-9.19%) and pulses (-3.62%) was found negative. It could be due to variety of factors such as relative profitability, irrigation and availability of technology.
It would be interesting to analyze differences of GCA in important cereal crops. Table 3 demonstrated percentage change in share of important cereal crops in gross cropped area during 2004-05 and 2011-12. We have included major food grains such as rice, jowar, bajra, maize, wheat, gram and tur. An analysis of data for the years 2004-05 and 2011-12 indicates nil change in area under rice. Maize (11.93%) followed by wheat (10.94%) occupied the highest percentage of GCA in 2004-05 as well as in 2011-12. Among coarse cereals, bajara and jowar were found important. Further results depict a negative trend in percentage change of GCA for jowar (-33.40%) followed by bajra (-7.20%) and gram (-4.26%).After analyzing the GCA for major food grains, it is important to analyze the percentage of area irrigated under important crops in India during 2004-05 and 2011-12. 4 indicates percentage change of area irrigated under important crops in India during 2004-05 and 2011-12 for fourteen major crops which show that sugarcane (92.3%) has the highest percentage share followed by wheat (88.4%), barley (63.8%), rice (52.60%) and total cereals (49.1%) during 2004-05. The same pattern of percentage share was found in the year 2011-12. Further, the analysis of percentage change of area irrigated indicates that the highest change occurred in bajra (96.83%) followed by jowar (81.33%) and total pulses (44.85%) whereas the least change in percentage area irrigated could be observed for sugarcane (6.61%), wheat (6.90%) and barley (9.56%). For understanding of changes in the area, production and yield of important crops in India, it is important to calculate the percentage change in area, production and yield between 2004-05 and 2011-12. Table 5 demonstrates a percentage change in area, production and yield of major crops like rice, jowar, bajra, maize, wheat, barley, total cereals, gram, total pulses, total food grains, total oilseeds, sugarcane and cotton. An analysis of table 5 clearly indicates highest percentage change in area during this period under sugarcane (36.53%) followed by cotton (36.31%), gram (26.91%) whereas there is a negative percentage change in jowar (-31.65%), bajra (-20.96%) and total oilseeds (-3.77%). In terms of production, highest percentage change occurred in cotton (108.30%) followed by gram (61.49%), maize (57.06%) whereas there is a negative percentage change in production of bajra (27.09%). After analyzing, area and production of these important crops, we found an increasing trend in yield.A positive percentage changeoccurred in the yield of all major crops. The highest percentage change was recorded in the productivity ofcotton (52.83%) followed by bajra (39.46%), total pulses (36.74%) whereas the least percentage change could be observed in case of sugarcane (5.41%), jowar (6.65%) and wheat (22.10%).
| — | — | — | — | — | — | Area- '000 has | — | — | — |
|---|---|---|---|---|---|---|---|---|---|
| Production- '000 Tonnes | |||||||||
| Yield- Kgs/ha | |||||||||
| Crop | 2004-05 | 2012-13 | Percentage Change | ||||||
| Area | Production | Yield | Area | Production | Yield | Area | Production | Yield | |
| Rice | 41907 | 83131.7 | 1984 | 42753.90 | 105231.60 | 2461 | 2.02 | 26.58 | 24.04 |
| Jowar | 9092.30 | 7244.30 | 797 | 6214.40 | 5281.50 | 850 | -31.65 | -27.09 | 6.65 |
| Bajara | 9232.90 | 7931.30 | 859 | 7297.40 | 8742.00 | 1198 | -20.96 | 10.22 | 39.46 |
| Maize | 7430 | 14172 | 1907 | 8672.6 | 22258.2 | 2566 | 16.72 | 57.06 | 34.56 |
| Wheat | 26383 | 68636.9 | 2602 | 30003.3 | 93506.5 | 3177 | 13.72 | 36.23 | 22.10 |
| Barley | 616.5 | 1207.1 | 1958 | 695.1 | 1752.4 | 2521 | 12.75 | 45.17 | 28.75 |
| Total Cereals | 97315 | 185233.3 | 1903 | 97518.9 | 238782.3 | 2449 | 0.21 | 28.91 | 28.69 |
| Gram | 6714.6 | 5469.4 | 815 | 8521.8 | 8832.5 | 1036 | 26.91 | 61.49 | 27.12 |
| Total Pulses | 22763 | 13129.5 | 577 | 23256.8 | 18342.5 | 789 | 2.17 | 39.70 | 36.74 |
| Total Foodgrains | 120078 | 198362.8 | 1652 | 120776 | 257124.7 | 2129 | 0.58 | 29.62 | 28.87 |
| Total Oilseeds | 27523 | 24353.5 | 885 | 26484.4 | 30939.7 | 1168 | -3.77 | 27.04 | 31.98 |
| Sugarcane | 3661.5 | 237088.4 | 64752 | 4998.9 | 341199.7 | 68254 | 36.53 | 43.91 | 5.41 |
| Cotton | 8786.6 | 16428.6 | 318 | 11977 | 34220 | 486 | 36.31 | 108.30 | 52.83 |
| Source: Fertilizer Statistics, FAI, 2013-14 | Base Year: 2004-05 |
Table text extracted from the original PDF; superscript letters are shown inline. The original table image is below.
View original table image
| Crop | % share in 2004-05 | % share in 2011-12 | % change |
|---|---|---|---|
| Rice | 22.33 | 22.33 | 0.00 |
| Jowar | 4.76 | 3.17 | -33.40 |
| Bajara | 4.86 | 4.51 | -7.20 |
| Maize | 3.94 | 4.41 | 11.93 |
| Wheat | 13.89 | 15.41 | 10.94 |
| Gram | 3.52 | 3.37 | -4.26 |
| Tur | 1.84 | 1.93 | 4.89 |
| Source: FAI, 2013-14 |
Table text extracted from the original PDF; superscript letters are shown inline. The original table image is below.
View original table image
After measuring the percentage change in GCA, irrigated area and area, production and yield for the major crops in India during 2004-05 and 2011-12 it is important to analyze achievement of the targets. Table 6 predicts information about achievements of targets of production of major crops in India during study period. It shows that production of cotton (109.53%) exhibited a commendable progress in terms of achieving the target followed by oilseeds (92.94%) and coarse cereals (90.92%) during 2004-05. During 2011-12 wheat has the best recorded for the achievement of the target (112.95%) followed by food grains (105.83%) and cotton (103.53%).
| — | 2004-05 | — | — | 2011-12 | — | — |
|---|---|---|---|---|---|---|
| Item | Target | Achievement | % achieved | Target | Achievement | % achieved |
| Rice | 93.5 | 83.13 | 88.91 | 102 | 105.3 | 103.24 |
| Wheat | 79.5 | 68.64 | 86.34 | 84 | 94.88 | 112.95 |
| Coarse Cereals | 36.8 | 33.46 | 90.92 | 42 | 42.01 | 100.02 |
| Pulses | 15.3 | 13.13 | 85.82 | 17 | 17.09 | 100.53 |
| Foodgrains | 225.1 | 198.36 | 88.12 | 245 | 259.29 | 105.83 |
| Oilseeds | 26.2 | 24.35 | 92.94 | 33.6 | 30.01 | 89.32 |
| Sugarcane | 270 | 237.09 | 87.81 | 350 | 361.04 | 103.15 |
| Cotton | 15 | 16.43 | 109.53 | 34 | 35.2 | 103.53 |
| Jute & Mesta | 11.8 | 10.27 | 87.03 | 12.3 | 11.4 | 92.68 |
| Source: Agriculture Statistics at a Glance MoA, GoI 2005-06 & 2013-14 Base Year: 2004-05 |
Table text extracted from the original PDF; superscript letters are shown inline. The original table image is below.
View original table image
Policy implications
In view of climate change, problems of sustainability of agriculture and shift in pattern of food consumption by the population towards high value foods, it is essential to diversify the crop pattern in favor of these crops including pulses and oilseeds in which country is export dependent. The sector is already facing the problem in terms of improving food and nutritional security with declining share of cultivable area in India. In recent years, agriculture in the country has experienced significant shifts in area under commercial crops, fruits and vegetables. The crop diversification is also essential for small and marginal farmers who constitute four-fifths of the actual numbers of the operational holdings. These developments have significant implications for diversification of agriculture. Judicious use of environmental resources such as water which is already scarce shall become significant in the further strategy through research and development in agriculture in India.
Figures and tables from the paper
| Year | Agriculture | Forestry and logging | Fishing | Agriculture, forestry and fishing |
|---|---|---|---|---|
| 2004-05 | 476634 (84.30)* | 61640 (10.90) | 27152 (4.80) | 565426 (100.00) |
| 2005-06 | 502996 (84.61) | 62742 (10.55) | 28749 (4.84) | 594487 (100.00) |
| 2006-07 | 523745 (84.59) | 64795 (10.46) | 30650 (4.95) | 619190 (100.00) |
| 2007-08 | 556956 (85.02) | 65697 (10.03) | 32427 (4.95) | 655080 (100.00) |
| 2008-09 | 555442 (84.71) | 66932 (10.21) | 33315 (5.08) | 655689 (100.00) |
| 2009-10 | 557715 (84.38) | 68877 (10.42) | 34395 (5.20) | 660987 (100.00) |
| 2010-11 | 610905 (85.11) | 70509 (9.82) | 36400 (5.07) | 717814 (100.00) |
| 2011-12 | 643543 (85.37) | 71816 (9.53) | 38473 (5.10) | 753832 (100.00) |
| 2012-13* | 649424 (84.95) | 73864 (9.66) | 41222 (5.39) | 764510 (100.00) |
Table text extracted from the original PDF; superscript letters are shown inline. The original table image is below.
View original table image
| Crop | % share in 2004-05 | % share in 2011-12 | % change |
|---|---|---|---|
| Cereals | 51.57 | 51.20 | -0.72 |
| Pulses | 12.43 | 11.98 | -3.62 |
| Sugarcane | 2.50 | 2.82 | 12.80 |
| Spices | 1.6 | 1.86 | 16.25 |
| Fruits | 2.04 | 2.03 | -0.49 |
| Vegetables | 2.86 | 2.79 | -2.45 |
| Oilseed | 15.89 | 14.43 | -9.19 |
| Fibers including cotton | 4.92 | 6.73 | 36.79 |
| Plantation crops | 1.16 | 1.33 | 14.66 |
| Fodder crops | 5.01 | 3.96 | -20.96 |
| Others | 0.2 | 0.87 | 335.00 |
| All crops | 100.00 | 100.00 | 0.00 |
| Source: Fertilizer Statistics, FAI, 2013-14 | Base Year: 2004-05 |
Table text extracted from the original PDF; superscript letters are shown inline. The original table image is below.
View original table image
| Crop | % share in 2004-05 | % share in 2011-12 | % change |
|---|---|---|---|
| Rice | 52.60 | 58.70 | 11.60 |
| Jowar | 7.50 | 9.70 | 81.33 |
| Bajara | 6.30 | 8.5 | 96.83 |
| Maize | 19.1 | 25.30 | 31.94 |
| Wheat | 88.4 | 92.90 | 6.90 |
| Barley | 63.8 | 74.80 | 9.56 |
| Total Cereals | 49.1 | 57.70 | 12.42 |
| Gram | 30.2 | 33.50 | 20.20 |
| Total Pulses | 13.6 | 16.10 | 44.85 |
| Total Foodgrains | 42.2 | 49.80 | 14.45 |
| Total Oilseeds | 24.7 | 27.60 | 24.70 |
| Sugarcane | 92.3 | 94.30 | 6.61 |
| Cotton | 34.1 | 30.40 | 17.89 |
| All Crops | 40.3 | 45.80 | 15.14 |
| Source: Fertilizer Statistics, FAI, 2013-14 | Base Year: 2004-05 |
Table text extracted from the original PDF; superscript letters are shown inline. The original table image is below.
View original table image
References
14 in the original paper- Birthal PS, Joshi PK, Roy D, Thorat A. Diversification in Indian Agriculture toward High-Value Crops: The Role of Small Farmers. Can J Agr Econ/Revue Canadienne d'agroeconomie. 2013;61(1):61-91.
- Bhalla GS, Gurmail Singh. Recent developments in Indian agriculture: A state level analysis. Econ Political Weekly. 1997:A2-A18.
- Hegde DM, Tiwari SP, Rai M. Crop diversification in Indian Agriculture. Agric Situat India. August 2003:351354.
- Joshi PK, Gulati A, Birthal PS. Agricultural diversification in India. 2007:219-242.
- Joshi PK, Joshi L, Birthal PS. Diversification and its impact on smallholders: Evidence from a study on vegetable production. Agric Econ Res Rev. 2006;19(2):219-236.
- Kalaiselvi V. Patterns of crop diversification in Indian scenario. Ann Biol Res. 2012;3(4):1914-1918.
- Mehra S. Instability in Indian agriculture in the context of the new technology. Intl Food Policy Res Inst. 1981;25.
- Munshi K. Social learning in a heterogeneous population: technology diffusion in the Indian Green Revolution. J Dev Econ. 2004;73(1):185-213.
- Murgai R, Ali M, Byerlee D. Productivity growth and sustainability in post-Green Revolution agriculture: the case of the Indian and Pakistan Punjabs. World Bank Res Obs. 2001;16(2):199-218.
- Pandey VK, Sharma KC. Crop Diversification and SelfSufficiency in Foodgrains. Indian J Agric Econ. 1996;51(4):644.
- Satyasai KJS, Viswanathan KU. Diversification of Indian agriculture and food security. Indian J Agric Econ. 1996;51(4):674.
- Sharma N, Mohan H. Diversification of agricultural sector in Punjab: Growth and challenges. Agric Situat India. 2013;69(11):21-31.
- Singh S. Contract farming for agricultural diversification in the India Punjab: A study of performance and problems. Indian J Agric Econ. 2000;55(3):283.
- Singh S. Crisis and diversification in Punjab agriculture: Role of state and agribusiness. Econ Political Weekly. 2004:5583-5590.