
Research article · 2024 · Full text
International Journal of Advanced Biochemistry ResearchMortality rates of Sirohi goats in semi-arid zone
Volume 8(1S) · Pages 676–678 · DOI: 10.33545/26174693.2024.v8.i1si.455 ↗
Research areasLivestock Management and Performance Improvement
Abstract
Author-writtenAnalyzing data related to Sirohi goats, archived at ICAR-Central Sheep and Wool Research Institute, Avikanagar, over a span of 15 years from 2001 to 2015, was carried out to assess mortality rates. The investigation of mortality rates encompassed various age brackets, specifically pre-weaning (0-3 months), post-weaning (3-12 months), and adult mortality. The cumulative mortality rate for Sirohi goats was notably elevated in the first 3 months of age (5.69%) when compared to the 3-12 month (1.50%) and adult (2.11%) age groups.
Summary
Source-checkedPlain-language reading of the full paper, prepared with AI and checked against the text. Each point links to the authors' own words.
Why it matters
- Sustainable livestock management is essential for maintaining health and productivity in challenging environments like semi-arid zones. View evidence ↗
- Sirohi goats are important for the livelihoods of people in semi-arid regions due to their endurance and adaptability. View evidence ↗
- Analyzing mortality rates across different age groups is necessary to evaluate the general health and productivity of the Sirohi breed. View evidence ↗
The question
- The study aims to establish a baseline understanding of natural mortality trends in Sirohi goats by examining mortality across different age groups. View evidence ↗
What they did
- The researchers analyzed 15 years of archived data (2001 to 2015) from the ICAR-Central Sheep and Wool Research Institute in Avikanagar. View evidence ↗
- Mortality was categorized into three age brackets: pre-weaning (0-3 months), post-weaning (3-12 months), and adults. View evidence ↗
- The study was conducted in the Malpura block of District Tonk, Rajasthan, India, at an altitude of 320 meters. View evidence ↗
- The farm's semi-arid, sub-tropical climate has annual rainfall of 615.93 mm and temperatures ranging from 4 °C to 48 °C. View evidence ↗
What they found
- Pre-weaning mortality peaked in 2004 at 19.35% and reached its lowest point in 2013 at 1.77%. View evidence ↗
- The overall post-weaning mortality rate (3-12 months) for the flock was 1.50%. View evidence ↗
- Post-weaning mortality was highest in 2012 (3.87%) and lowest in 2014 (0.00%). View evidence ↗
- The mean mortality rate for adult Sirohi goats was 2.11%. View evidence ↗
- Adult mortality was highest in 2007 (5.05%) and lowest in 2006 (0.86%). View evidence ↗
- The total cumulative mortality rate for all age groups from 2001 to 2015 was 2.85%. View evidence ↗
- The highest overall annual mortality rate occurred in 2003 (5.44%), while the lowest was in 2014 (0.92%). View evidence ↗
What it means
- The authors conclude that categorizing mortality by age provides essential data for targeted interventions and herd management to improve the sustainability of Sirohi goat farming. View evidence ↗
Visual summary
3 visualsIllustrations explain the paper; charts are replotted from the paper's own table values.
Mortality by Age Group
AI-generated conceptual illustration (Sirohi goats). It explains the idea and does not show study data.
View source evidence ↗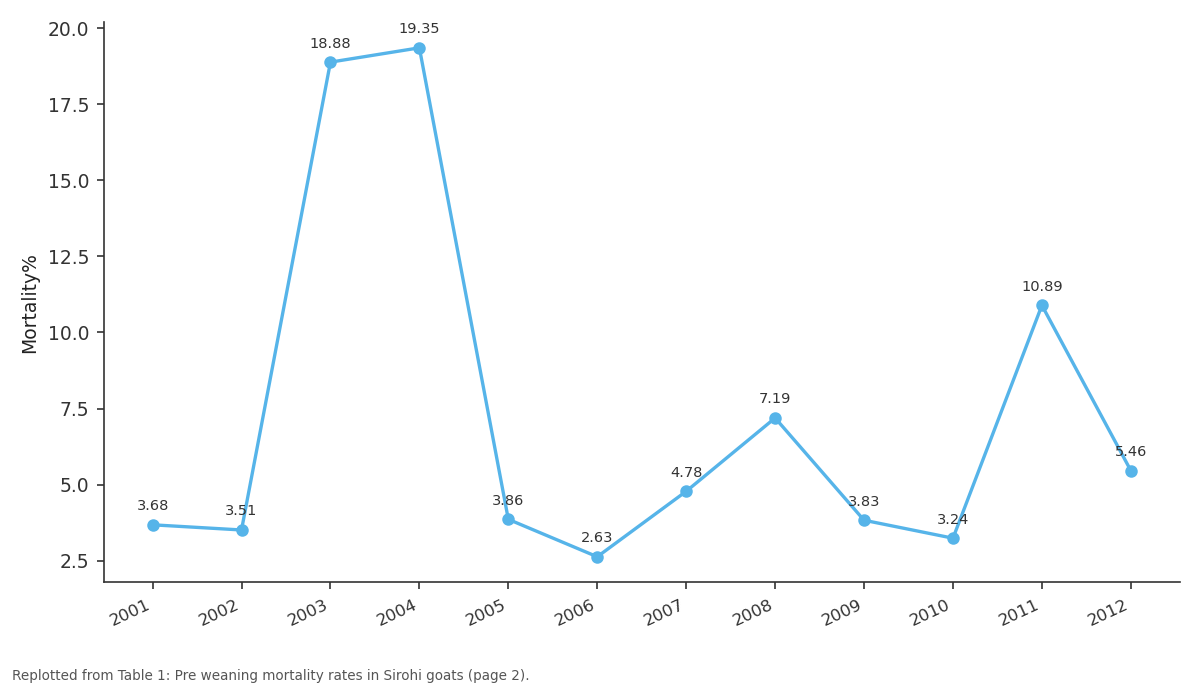
Mortality%: 2001 vs 2002 vs 2003 vs 2004 vs 2005
Replotted from Table 1 (page 2) of the original paper. Every bar is the paper's own table value.
View source evidence ↗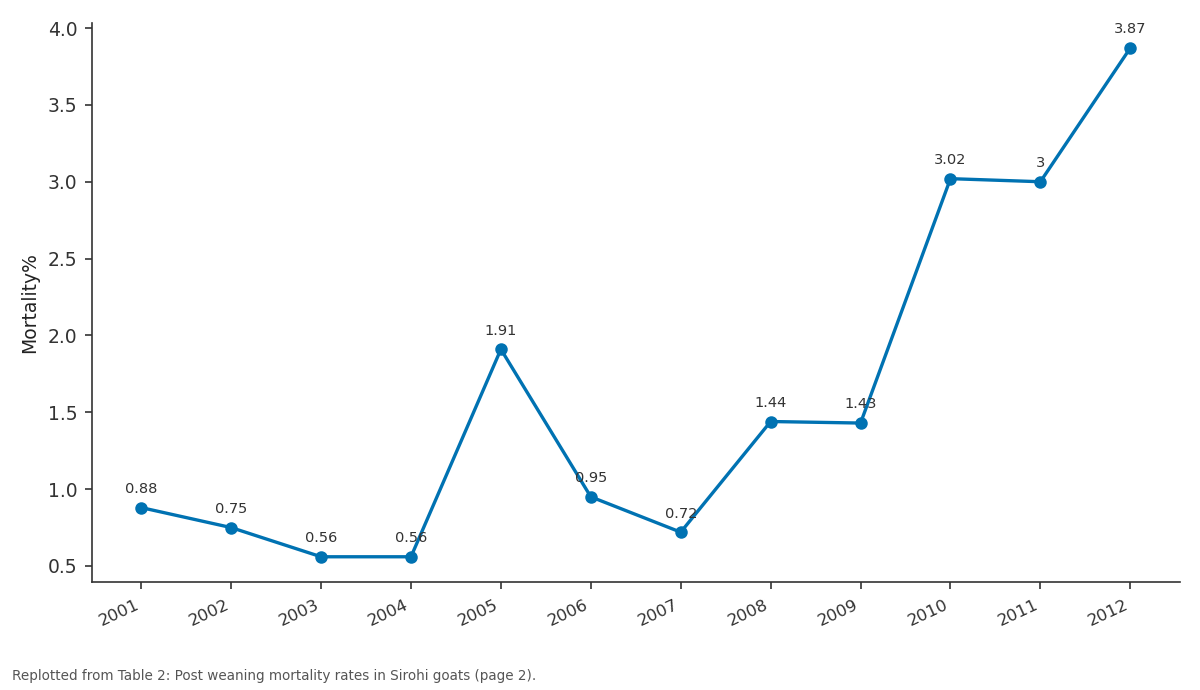
Mortality%: 2001 vs 2002 vs 2003 vs 2004 vs 2005
Replotted from Table 2 (page 2) of the original paper. Every bar is the paper's own table value.
View source evidence ↗Figures & tables
From the original paper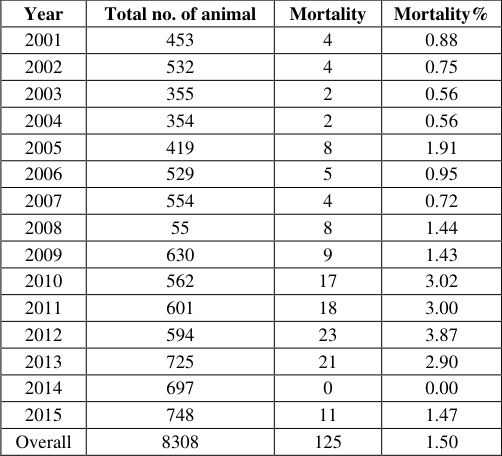 Table 2
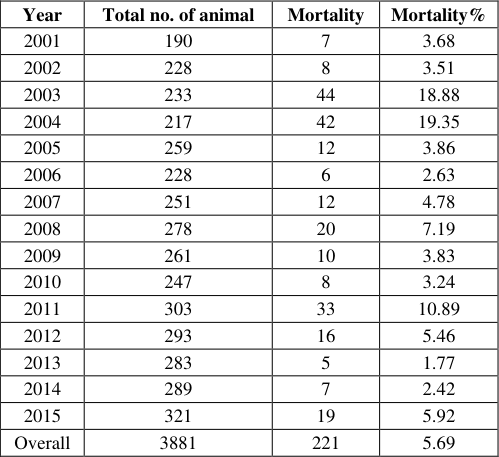 Table 1
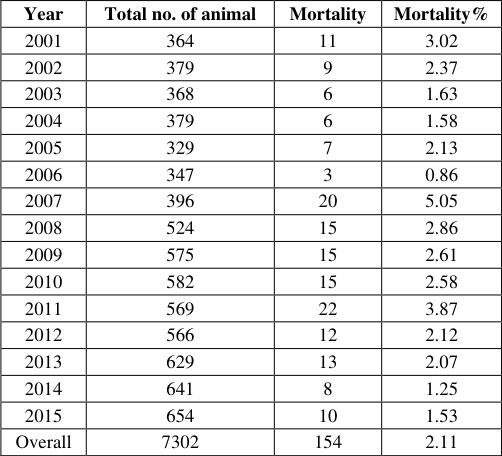 Table 3
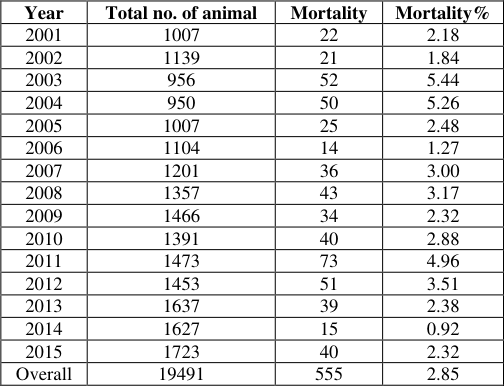 Table 4
Introduction
Ensuring the sustainable management of livestock is crucial for preserving the health and productivity of domestic animal populations, especially in regions with environmental challenges, such as semi-arid zones. The Sirohi goat, celebrated for its adaptability and endurance, holds a significant position in supporting the livelihoods of communities residing in these areas. Nevertheless, the effectiveness of Sirohi goat production is inevitably shaped by a range of factors, and one notable aspect is the mortality rate. Mortality rate is defined as percentage of number of animal died in particular age group to the total number of animal present in the beginning of that group. Understanding age-wise mortality patterns is crucial in assessing the overall health and productivity of Sirohi goats in semi-arid regions. The mortality rates of Sirohi goats vary across different age groups, providing valuable insights into the breed's susceptibility to various factors at different life stages. This study focuses on examining age-wise mortality in Sirohi goats, aiming to establish a baseline understanding of the natural mortality trends within the breed. By categorizing mortality data into distinct age groups, this research seeks to contribute essential information for effective herd management and targeted interventions, ultimately enhancing the overall sustainability of Sirohi goat farming in semi-arid regions.
Material and Methods
The information utilized for this analysis originated from the livestock data repositories specifically dedicated to Sirohi goats. These repositories are meticulously maintained within the Animal Genetics and Breeding Division of ICAR-CSWRI in Avikanagar, Rajasthan. The research site is situated in the Malpura block of District Tonk in Rajasthan, India, positioned at 75°28' E Latitude and 26°17' N Longitude, with an altitude of 320 meters above mean sea level. The climate at the farm is characterized as semi-arid and sub-tropical, featuring significant temperature fluctuations ranging from a maximum of 48 °C to a minimum of 4 °C throughout the year. The annual recorded rainfall in the region amounts to 615.93 mm. Selective breeding techniques were applied, and controlled mating procedures were utilized for the female goats. Health oversight followed the institute's flock health calendar. Comprehensive documentation of day-to-day mortality records was diligently upheld. Mortality rates were calculated both concerning age categories and collectively for each year throughout the research period.
Results and Discussion
Results and Discussion
Mortality rates:
Mortality rate is defined as percentage of number of animal died in particular age group to the total number of animal present in the beginning of that group. Elevated mortality rates among young goats pose a significant economic challenge. The extent of kid mortality has risen in tandem with advancements in goat rearing. Nearly half of kid mortalities are attributed to diverse diseases (Lodh et al., 1993) [6] . In addition to diseases, several factors, including age, birth weight, season, and litter size, play a role in influencing the occurrence of kid mortality. Mortality rates were examined across different age groups: pre-weaning (0-3 months), post-weaning (3-12 months) and adult mortality as follows.
Pre-weaning mortality (0-3 months)
The pre-weaning mortality rate for the entire Sirohi goat flock was determined to be 5.69% (Table 1). Elevated mortality rates during the first three months of life have been documented by Kumar et al. (2010) [5] , Sharma et al. (2007) [10] in Sirohi field flocks. Kumar et al. (2010) [5] reported an overall mortality rate of 4.48% in a Sirohi goat field flock, while Snyman (2010) [11] observed a rate of 11.50% in Angora goats. Comparative findings show slightly higher mortality rates in studies by Mandal et al. (2005) [7] (6.6% in Muzaffarnagari sheep), Atashi et al. (2013) [2] (7.1% in Ghezel sheep), Mustafa et al. (2014) [8] (7.3% in Pak Karakul, 11.2% in Thali sheep, 14.2% in Kacchi sheep), Getachew et al. (2015) [3] (12.2% in Menz sheep), Abegaz et al. (2000) [1] (8.8% in Menz sheep), Soundarajan et al. (2014) [12] (27.89% in Madras red sheep), and Thiruvenkadan et al. (2003) [14] (40.51% in Mecheri sheep). The highest pre-weaning mortality among Sirohi goat kids occurred in the year 2004 (19.35%), while the lowest was recorded in the year 2013 (1.77%).
| Year | Total no. of animal | Mortality | Mortality% |
|---|---|---|---|
| 2001 | 190 | 7 | 3.68 |
| 2002 | 228 | 8 | 3.51 |
| 2003 | 233 | 44 | 18.88 |
| 2004 | 217 | 42 | 19.35 |
| 2005 | 259 | 12 | 3.86 |
| 2006 | 228 | 6 | 2.63 |
| 2007 | 251 | 12 | 4.78 |
| 2008 | 278 | 20 | 7.19 |
| 2009 | 261 | 10 | 3.83 |
| 2010 | 247 | 8 | 3.24 |
| 2011 | 303 | 33 | 10.89 |
| 2012 | 293 | 16 | 5.46 |
| 2013 | 283 | 5 | 1.77 |
| 2014 | 289 | 7 | 2.42 |
| 2015 | 321 | 19 | 5.92 |
| Overall | 3881 | 221 | 5.69 |
Table text extracted from the original PDF; superscript letters are shown inline. The original table image is below.
View original table image
Post-weaning mortality (3-12 months)
The data presented in Table 2 reveals that post-weaning mortality within the flock was 1.50% during the 3-12 months age range. These figures were notably lower compared to those documented by Sharma et al. (2004) [9] (7.4% in Malpura and 8.25% in Garole × Malpura), Taneja et al. (1991) [13] (14.59% in Magra sheep), Thiruvenkadan et al. (2003) [14] (59.49% in Mecheri sheep), and Soundarajan (2014) [12] (72.11% in Madras red sheep). A nearly equivalent mortality rate was reported by Mandal et al.
| Year | Total no. of animal | Mortality | Mortality% |
|---|---|---|---|
| 2001 | 453 | 4 | 0.88 |
| 2002 | 532 | 4 | 0.75 |
| 2003 | 355 | 2 | 0.56 |
| 2004 | 354 | 2 | 0.56 |
| 2005 | 419 | 8 | 1.91 |
| 2006 | 529 | 5 | 0.95 |
| 2007 | 554 | 4 | 0.72 |
| 2008 | 55 | 8 | 1.44 |
| 2009 | 630 | 9 | 1.43 |
| 2010 | 562 | 17 | 3.02 |
| 2011 | 601 | 18 | 3.00 |
| 2012 | 594 | 23 | 3.87 |
| 2013 | 725 | 21 | 2.90 |
| 2014 | 697 | 0 | 0.00 |
| 2015 | 748 | 11 | 1.47 |
| Overall | 8308 | 125 | 1.50 |
Table text extracted from the original PDF; superscript letters are shown inline. The original table image is below.
View original table image
(2005) [7] (6.0%) in Muzaffarnagari sheep. The highest post-weaning mortality among Sirohi goat kids was recorded in the year 2012 (3.87%), while the lowest occurred in the year 2014 (0.00%) (Refer to Table 2).
Adult mortality
The mean mortality rate among adults was determined to be 2.11%. The highest mortality was noted in the year 2007 (5.05%), while the lowest occurred in the year 2006 (0.86%) (Refer to Table 3). The cumulative mortality rate from 2001 to 2015 was calculated to be 2.85% (refer to Table 4). In a study by Kumar et al. (2016) [4] , it was reported that the overall adult mortality in Sirohi goats was 2.56%. The highest mortality was noted in the year 2003 (5.44%), while the lowest occurred in the year 2014 (0.92%).
| Year | Total no. of animal | Mortality | Mortality% |
|---|---|---|---|
| 2001 | 1007 | 22 | 2.18 |
| 2002 | 1139 | 21 | 1.84 |
| 2003 | 956 | 52 | 5.44 |
| 2004 | 950 | 50 | 5.26 |
| 2005 | 1007 | 25 | 2.48 |
| 2006 | 1104 | 14 | 1.27 |
| 2007 | 1201 | 36 | 3.00 |
| 2008 | 1357 | 43 | 3.17 |
| 2009 | 1466 | 34 | 2.32 |
| 2010 | 1391 | 40 | 2.88 |
| 2011 | 1473 | 73 | 4.96 |
| 2012 | 1453 | 51 | 3.51 |
| 2013 | 1637 | 39 | 2.38 |
| 2014 | 1627 | 15 | 0.92 |
| 2015 | 1723 | 40 | 2.32 |
| Overall | 19491 | 555 | 2.85 |
Table text extracted from the original PDF; superscript letters are shown inline. The original table image is below.
View original table image
| Year | Total no. of animal | Mortality | Mortality% |
|---|---|---|---|
| 2001 | 364 | 11 | 3.02 |
| 2002 | 379 | 9 | 2.37 |
| 2003 | 368 | 6 | 1.63 |
| 2004 | 379 | 6 | 1.58 |
| 2005 | 329 | 7 | 2.13 |
| 2006 | 347 | 3 | 0.86 |
| 2007 | 396 | 20 | 5.05 |
| 2008 | 524 | 15 | 2.86 |
| 2009 | 575 | 15 | 2.61 |
| 2010 | 582 | 15 | 2.58 |
| 2011 | 569 | 22 | 3.87 |
| 2012 | 566 | 12 | 2.12 |
| 2013 | 629 | 13 | 2.07 |
| 2014 | 641 | 8 | 1.25 |
| 2015 | 654 | 10 | 1.53 |
| Overall | 7302 | 154 | 2.11 |
Table text extracted from the original PDF; superscript letters are shown inline. The original table image is below.
View original table image
Conclusion
In summarizing the findings, the pre-weaning mortality for the entire Sirohi goat flock was determined to be 5.69%. Notably, the highest pre-weaning mortality for Sirohi goat kids was recorded in the year 2004 at 19.35%, contrasting with the lowest observed in the year 2013 at 1.77%. Moving on to post-weaning stages, the average post-weaning mortality was identified at 1.50%. The highest post-weaning mortality for Sirohi goat kids was observed in the year 2012 at 3.87%, while the lowest was registered in the year 2014 at 0.00%. Turning our attention to adult mortality, the average was calculated to be 2.11%, with the highest recorded in the year 2007 at 5.05% and the lowest in the year 2006 at 0.86%.
Examining the cumulative trends from 2001 to 2015, the overall mortality rate was determined to be 2.85%. The highest cumulative mortality rate was observed in the year 2003 at 5.44%, in contrast to the lowest recorded in the year 2014 at 0.92%. These findings provide valuable insights into the mortality patterns of the Sirohi goat flock over the specified time frame.
References
14 in the original paper- Abegaz S, Gemeda D, Rege JE, Van Wyk JA, Neser FWC, Erasmus GJ, et al. Early growth, survival and litter size in Ethiopian Horro sheep. South African Journal of Animal Science. 2000;30:1-3.
- Atashi H, Izadifard J, Zamiri MJ, Akhlaghi A. Investigation in early growth traits, litter size and lamb survival in two Iranian fat-tailed sheep breeds. Tropical Animal Health Production. 2013;45:1051-1054.
- Getachew T, Gizaw S, Wurzinger M, Haile A, Rischkowsky B, Okeyo AM, et al. Survival analysis of genetic and nongenetic factors influencing ewe longevity and lamb survival of Ethiopian sheep breeds. Science. 2015;176:22-32.
- Kumar A, Chauhan I, Mishra SS, Gowane GR. Mortality, culling and replacement in Sirohi goats in an organized farm. Indian Journal of Small Ruminants. 2016;22(1):50-52.
- Kumar U, Sharma SK, Nagda RK, Rajawat BS. Replacement index and mortality pattern of Sirohi goats under field condition. Indian Journal of Small Ruminants. 2010;16(1):274-276.
- Lodh C, Chakrabarthi A, Mukhopadhyay S. Factors affecting kid mortality in West Bengal. Indian Veterinary Journal. 1993;70:48-50.
- Mandal A, Barua S, Rout PK, Roy R, Prasad H, Sinha NK, et al. Factors affecting the prevalence of mortality associated with pneumonia in a flock of Muzaffarnagri sheep. Indian Journal of Animal Science. 2005;75:407410.
- Mustafa MI, Mehmood MM, Lateef M, Bashir MK, Khalid AR. Factors influencing lamb mortality from birth to weaning in Pakistan. Pakistan Journal of Life and Social Science. 2014;12(3):139-143.
- Sharma RC, Arora AL, Mishra AK, Kumar S, Singh VK. Breeding prolific Garole with Malpura sheep for increased reproductive efficiency in semi-arid tropics in India. Asian-Australian Journal of Animal Science. 2004;17(6):737-742.
- Sharma SK, Nagda RK, Kumar U, Khadda BS. Mortality pattern in Sirohi goats under field conditions. Indian Journal of Small Ruminants. 2007;13:210-212.
- Snyman MA. Factors affecting pre-weaning kid mortality in South African Angora goats. South African Journal of Animal Science, 2010, 40(1).
- Soundararajan C. Study on mortality pattern of Madras Red sheep under the semi-arid tropic region. International Journal of Agricultural Science and Veterinary Medicine. 2014;2(3):25-30.
- Taneja AD, Yadav SBS, Pant KP. Morbidity and mortality rate in Magra sheep of arid region. Indian Journal of Animal Science. 1991;61:1138-1139.
- Thiruvenkadan AK, Murugan M, Karunanithi K, Ganesh K. Study on the mortality of Mecheri sheep under dry land farming conditions. Journal of Small Ruminants. 2003;9:1-5.
Cited by 1
From OpenAlex, OpenCitations and reference lists read by Scinovex
- Growth performance and adaptability of Sirohi goats in arid and semi-arid regions of India
Vikas Kumar Meena, Sharma Dk, Bhupender ., Avinash Kumar Mishra · International Journal of Agriculture and Food Science · 2026
Sirohi goat is an important dual-purpose indigenous breed of India, native to the Sirohi district of Rajasthan and well distributed across the arid and semi-arid agro-climatic zones of Rajasthan and Gujarat. The present review compiles and critically analyses the available scientific information on growth performance and adaptability of Sirohi goats in arid and semi-arid regions of India. Birth weight ranged from 2.16 to 2.57 kg and 12-month body weight from 21.74 to 25.09 kg under diverse management conditions, with pre-weaning and post-weaning average daily gain of 87.52-113.66 g/day and 46.