
Research article · 2024 · Full text
International Journal of Advanced Biochemistry ResearchAnalysis of genetic parameters of Chickpea (Cicer arietinum L.) genotypes under Vindhya plateau of Madhya Pradesh
Volume 8(1) · Pages 631–633 · DOI: 10.33545/26174693.2024.v8.i1i.470 ↗
Research areasAgricultural pest management studiesGenetic and Environmental Crop StudiesBotanical Research and Chemistry
Abstract
Author-writtenIn the present study, 30 chickpea genotypes were assessed for various genetic parameters. Observations were recorded on phenological traits, including days to flower initiation and days to maturity, as well as nine quantitative traits: plant height (cm), number of primary branches per plant, number of pods per plant, number of seeds per pod, 100-seed weight (g), biological yield per plant (g), harvest index (%), and seed yield per plant (g). The analysis of variance for all the characters revealed significant differences among the genotypes. This indicates the presence of a substantial amount of genetic variability among the genotypes under study.
Summary
Source-checkedPlain-language reading of the full paper, prepared with AI and checked against the text. Each point links to the authors' own words.
Why it matters
- Chickpea is a globally significant legume crop, with worldwide cultivation covering 13.71 million hectares and producing 14.24 million metric tons. View evidence ↗
- In India, Madhya Pradesh is the leading state for chickpea cultivation, producing 2.48 million metric tons from 1.92 million hectares. View evidence ↗
- Chickpea production is challenged by abiotic stresses like drought and cold, as well as biotic stresses such as vascular wilt and pod borer pests. View evidence ↗
The question
- The study aimed to analyze the genetic parameters of various chickpea genotypes grown in the Vindhya plateau region of Madhya Pradesh. View evidence ↗
What they did
- The researchers used 30 chickpea genotypes selected from diverse genetic and geographical origins. View evidence ↗
- The experiment was conducted during the 2020 rabi season using a randomized block design with three replications. View evidence ↗
What they found
- The highest phenotypic coefficient of variation (PCV) was found in the number of primary branches per plant. View evidence ↗
- The height of the first fruiting node exhibited the highest genotypic coefficient of variation (GCV). View evidence ↗
- High heritability was observed across most traits, with biological yield per plant and number of effective pods per plant among the highest. View evidence ↗
- High heritability combined with high genetic advance was found for 100-seed weight, biological yield, grain yield, number of effective pods, and height of the first fruiting node. View evidence ↗
- Maturity varied by genotype, with Phule G 0-714 maturing earliest at 102.50 days and BGD-1063 maturing latest at 131.00 days. View evidence ↗
What it means
- The authors conclude that traits with high heritability and high genetic advance are driven by additive gene action and can be improved through direct selection. View evidence ↗
Visual summary
3 visualsIllustrations explain the paper; charts are replotted from the paper's own table values.
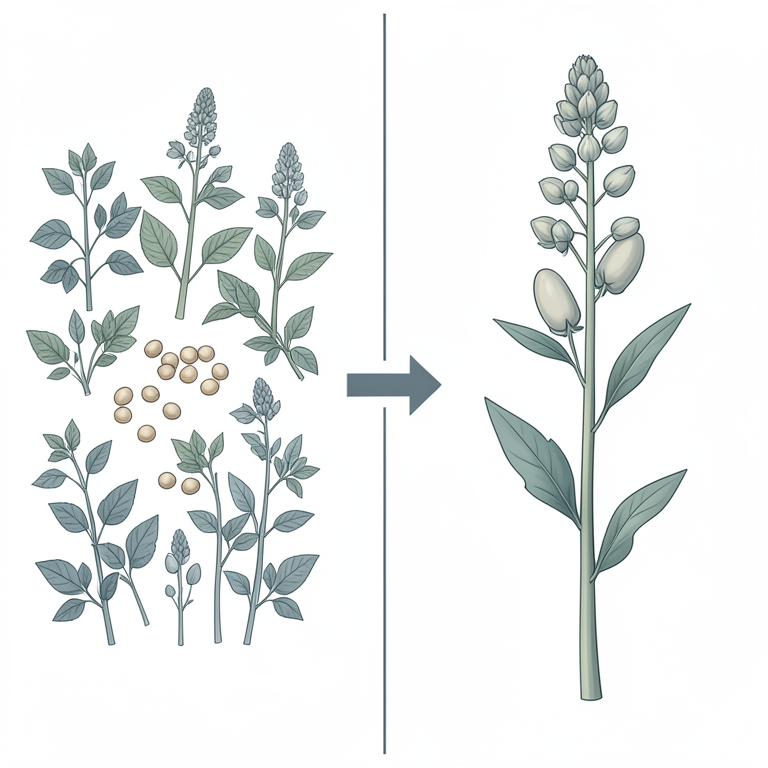
Selection Potential Concept
AI-generated conceptual illustration (Chickpea plants (Cicer arietinum L.)). It explains the idea and does not show study data.
View source evidence ↗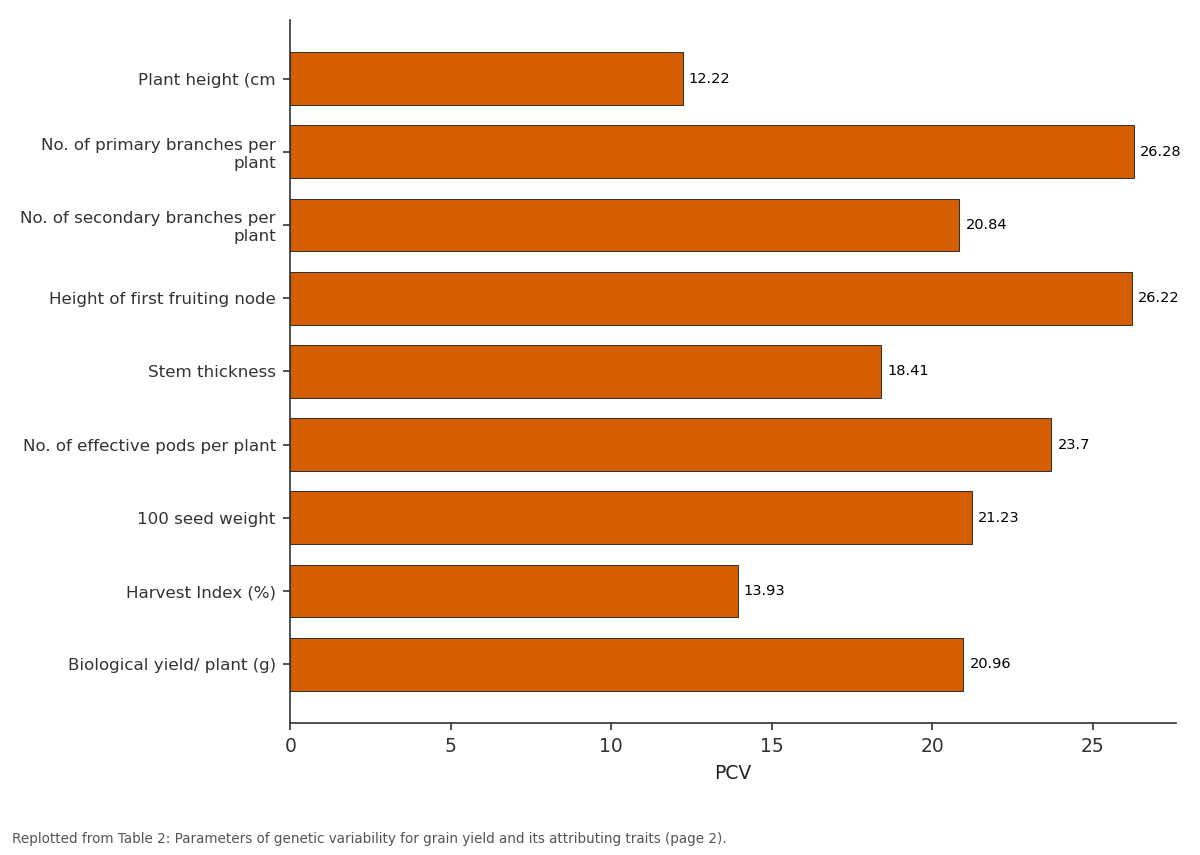
PCV: Plant height (cm vs No. of primary branches... vs No. of secondary... vs Height of first... vs Stem thickness
Replotted from Table 2 (page 2) of the original paper. Every bar is the paper's own table value.
View source evidence ↗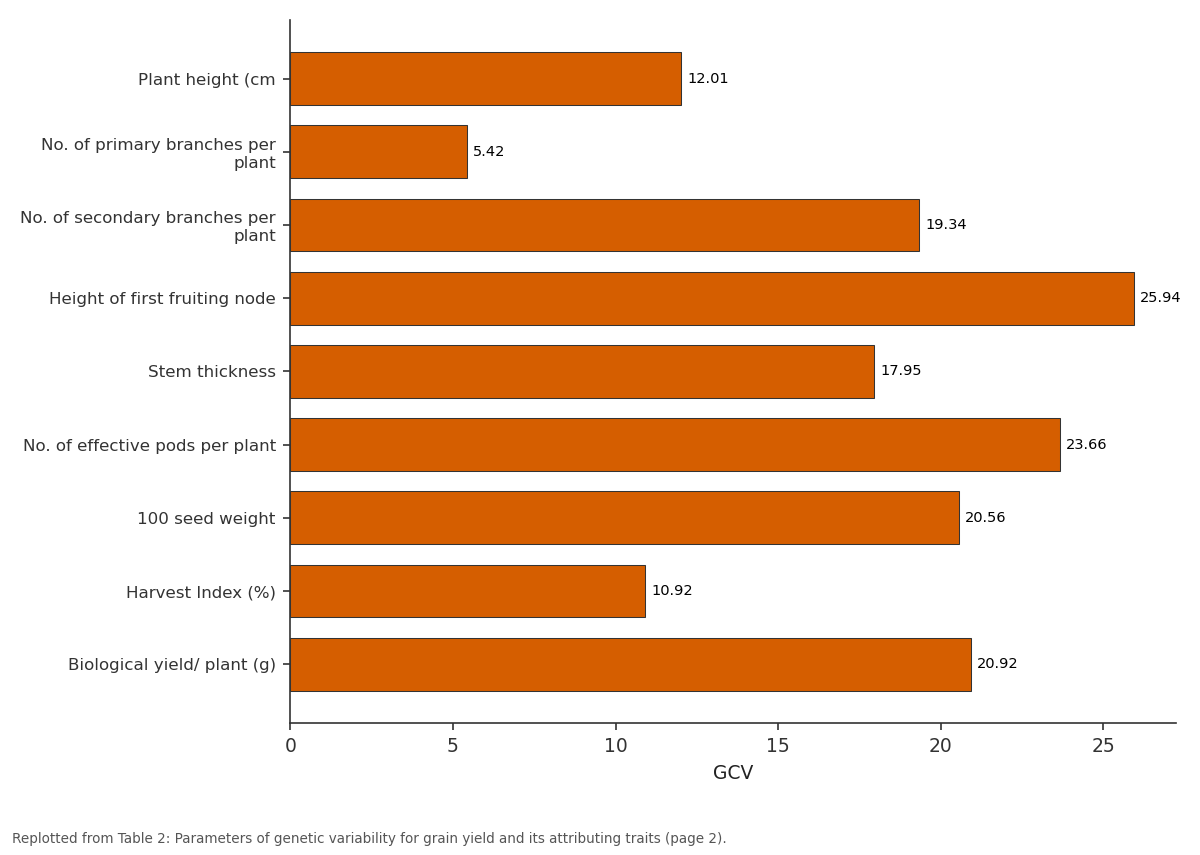
GCV: Plant height (cm vs No. of primary branches... vs No. of secondary... vs Height of first... vs Stem thickness
Replotted from Table 2 (page 2) of the original paper. Every bar is the paper's own table value.
View source evidence ↗Figures & tables
From the original paper Table 1
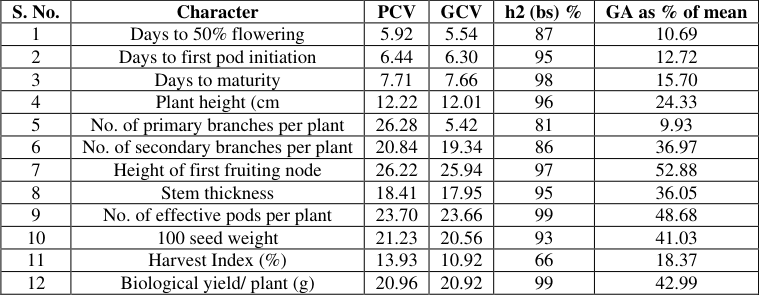 Table 2
Introduction
Chickpea (Cicer arietinum L.) is an important legume crop belonging to the family Leguminosae (Fabaceae). Globally, its cultivation spans 13.71 million hectares, with a production of 14.24 million metric tons and a productivity of 1038.4 kg/ha (FAO, 2019). In India, chickpea is grown over 10.17 million hectares, yielding a total production of 1.35 million metric tons and a productivity of 1116 kg/ha. As the largest producer worldwide, India contributes significantly to the annual global production of 162.25 million metric tons from an area of 149.66 million hectares, with a productivity of 1252 kg/ha (Anonymous, 2019-20). Madhya Pradesh takes the lead in chickpea cultivation, contributing an area of 1.92 million hectares, a production of 2.48 million metric tons, and a productivity of 1288 kg/ha. Despite breeding efforts that have improved chickpea yield, ensuring stable production remains a major concern for widespread adoption by farmers. Susceptibility to various biotic and abiotic stresses, including fungal diseases (such as Vascular wilt), pests (like pod borer), and drought or cold stress, poses significant challenges. Fusarium wilt, caused by Fusarium oxysporum f. sp. ciceris (Foc), is a prevalent soil-borne fungus affecting chickpeas globally. The Gram pod borer, Helicoverpa armigera (Lepidoptera: Noctuidae), stands out as the primary pest, causing substantial yield losses ranging from 26.0% to 40.1% (Sarwar, 2013) [4] . Developing crop cultivars resistant to pod borer is considered a cost-effective and ecofriendly approach, holding great promise for Helicoverpa management. Assessing genetic variability, heritability, and genetic advance percentage of mean provides valuable insights into the potential genetic gains through selection. A critical analysis of these parameters for various economically important traits is a prerequisite for plant breeders involved in crop improvement programs. With this objective, the present experiment was conducted to study genetic parameters in different chickpea genotypes under vindya plateau region of Madhya Pradesh.
Materials and Methods
The present investigation was conducted during the rabi season of 2020 at the Instructional Farm of the College of Agriculture, Ganjbasoda, situated in the Vidisha district of Madhya Pradesh, falling within the Malwa and Vindhyan Plateau agro-climatic zone.
The experimental materials for the study included 30 genotypes of chickpea (Cicer arietinum L.), selected based on different genetic and geographical origins. Ganjbasoda's climate, located in Vidisha, is characterized by hot summers and overall dry conditions, except during the southwest monsoon season. The district typically receives 1135.5 mm of normal rainfall, with the maximum occurring during the southwest monsoon period. Approximately 91.4% of the annual rainfall is received during the monsoon season, while only 8.6% occurs from October to May. The experimental material was sown in three replications using a randomized block design during the rabi season of 2020. The plot size was 3.0 x 2.25 m, and a spacing of 22.5 x 7.5 cm was maintained. Observations were recorded for various traits, including days to 50% flowering, days to first pod initiation, days to maturity, plant height (cm), number of primary branches per plant, number of secondary branches per plant, height of the first fruiting node (cm), stem thickness (mm), number of effective pods per plant, 100seed weight (g), biological yield (g), harvest index (%), and seed yield per plant (g). Data were recorded for five randomly selected plants from each replication.
Results and Discussions
The analysis of variance was calculated for ten quantitative traits of chickpea. Significant differences among the genotypes were observed for all the characters, indicating the presence of a considerable amount of genetic variability among the studied genotypes. Table 1 presents the mean sum of squares values for the ten characters. The mean sum of squares due to genotypes was significant for all the ten characters, suggesting a substantial level of genetic variability among the studied genotypes. This implies a potential for selecting promising lines from the current gene pool for yield and its components, likely due to the diverse sources of materials considered. In any crop improvement program, a detailed study of genetic variability is crucial. This involves estimating the mean, genotypic and phenotypic coefficients of variation. Table 2 provides estimates of variances, coefficients of variation, heritability, and genetic advance percentage of mean for all thirteen characters studied. Phenotypic and genotypic coefficients of variation were computed to assess the nature and magnitude of existing variability in the experimental material. The highest phenotypic coefficient of variation (PCV) was recorded for the number of primary branches per plant, followed by height at the first fruiting node, grain yield, number of effective pods per plant, 100-seed weight, biological yield per plant, and number of secondary branches per plant. Moderate estimates of PCV were recorded for stem thickness, harvest index, and plant height, while the least estimates were for days to 50% flowering, days to maturity, and days to first pod initiation. Similar findings were reported by Dhuria and Babbar (2015) [2] . The highest genotypic coefficient of variation (GCV) was recorded for height at the first fruiting node, followed by grain yield, number of effective pods per plant, 100-seed weight, and biological yield per plant. Moderate estimates of GCV were recorded for stem thickness, harvest index, plant height, and number of secondary branches per plant. The least estimates of GCV were for days to 50% flowering, days to maturity, days to first pod initiation, and number of primary branches per plant. Similar findings were reported by Babbar and Tiwari (2018) [1] and Manikanteswara et al. (2019) [3] ." The highest heritability was recorded for biological yield per plant, number of effective pods per plant, days to maturity, height at first fruiting nod, plant height, days to first pod initiation, stem thickness,100 seed weight, grain yield per plant, days to 50% flowering, number of secondary branches per plant, number of primary branches per plant harvest index. The higher genetic advance recorded for height at fruiting node followed by no of effective pods per plant, grain yield, biological yield per plant, 100 seed weight, stem thickness, secondary branches per plant, plant height. The high heritability coupled with high genetic advance as percentage of mean was recorded for height of first fruiting node, number of effective pod per plant, grain yield per plant, biological yield per plant and 100 seed weight.
| S. No. | Character | PCV | GCV | h2 (bs) % | GA as % of mean |
|---|---|---|---|---|---|
| 1 | Days to 50% flowering | 5.92 | 5.54 | 87 | 10.69 |
| 2 | Days to first pod initiation | 6.44 | 6.30 | 95 | 12.72 |
| 3 | Days to maturity | 7.71 | 7.66 | 98 | 15.70 |
| 4 | Plant height (cm | 12.22 | 12.01 | 96 | 24.33 |
| 5 | No. of primary branches per plant | 26.28 | 5.42 | 81 | 9.93 |
| 6 | No. of secondary branches per plant | 20.84 | 19.34 | 86 | 36.97 |
| 7 | Height of first fruiting node | 26.22 | 25.94 | 97 | 52.88 |
| 8 | Stem thickness | 18.41 | 17.95 | 95 | 36.05 |
| 9 | No. of effective pods per plant | 23.70 | 23.66 | 99 | 48.68 |
| 10 | 100 seed weight | 21.23 | 20.56 | 93 | 41.03 |
| 11 | Harvest Index (%) | 13.93 | 10.92 | 66 | 18.37 |
| 12 | Biological yield/ plant (g) | 20.96 | 20.92 | 99 | 42.99 |
Table text extracted from the original PDF; superscript letters are shown inline. The original table image is below.
View original table image
| Source of variation | D.F. | Days to 50% flowering | Days to first pod initiation | Days to maturity | Plant height (cm) | No. of primary branches per plant | No. of secondary branches per plant | Height of first fruiting node | Stem thickness | No. of effective pods per plant | 100 seed weight | Harvest Index (%) | Biological yield/ plant (g) | Grain Yield / plant (g) |
|---|---|---|---|---|---|---|---|---|---|---|---|---|---|---|
| Replications | 2 | 2.40 | 1.06 | 12.15 | 5.25 | 1.05 | 7.08 | 4.050 | 1.098 | 2.0166 | 2.666 | 118.84 | 75.062 | 1.727 |
| Treatments | 29 | 30.10* | 40.13* | 160.67** | 42.39* | 28.15** | 6.24** | 33.01** | 0.459* | 694.747** | 45.921** | 65.894** | 64.031** | 15.655* |
| Error | 58 | 31.71 | 1.65 | 1.80 | 1.44 | 1.012 | 0.86 | 0.691 | 0.656 | 2.223 | 2.839 | 22.009 | 0.290 | 1.222 |
Table text extracted from the original PDF; superscript letters are shown inline. The original table image is below.
View original table image
Conclusion
The analysis of variance for all the characters revealed significant differences among the genotypes, indicating the presence of a substantial amount of genetic variability in the studied genotypes. The genotype with the earliest maturity was Phule G 0-714 (102.50 days), while late maturity was registered for BGD-1063 (131.00 days). The highest magnitude of phenotypic coefficient of variation (PCV) was recorded for the number of primary branches per plant, followed by height at the first fruiting node, grain yield, number of effective pods per plant, 100-seed weight, biological yield per plant, and the number of secondary branches per plant. The higher magnitude of genotypic coefficient of variation (GCV) was recorded for height at the first fruiting node, followed by grain yield, number of effective pods per plant, 100-seed weight, and biological yield per plant. Traits like height of first fruiting node, number of effective pod per plant, grain yield per plant, biological yield per plant and 100 seed weight showed high heritability coupled with high genetic advance as percentage of mean. These characters showed substantial contribution of additive gene action for their phenotypic expression. They can be further improved by direct selection for these characters.
References
8 in the original paper- Babbar A, Tiwari A. Assessment of Genetic Variability and Yield Stability in Chickpea Genotypes under Diverse Environments. International Journal of Current Microbiology and Applied Sciences. 2018;7(12):35443554.
- Dhuria N, Babbar A. Assessment of genetic variability and trait association in Kabuli Chickpea (Cicer arietinum L.). Progressive Research-An International Journal. 2015;10(1):455-458.
- Manikanteswara O, Lavanya GR, Ranganatha YH, Chandu MMS. Estimation of Genetic Variability, Correlation and Path Analysis for Seed Yield Characters in Chickpea (Cicer arietinum L.). International Journal of Current Microbiology and Applied Sciences. 2019;8(3):2355-2361.
- Lepidoptera). African Journal agriculture Research 2013;8(26):3431-3435.
- Mujahida S, Sayyed F, Sharma RM. Effect of inspection error on CUSUM control charts for the Erlang truncated exponential distribution. Life Cycle and Safety Engineering. 2021;10:61-70.
- Rajmohan S, Mujahida S. Association analysis for yield and its components in sesame genotypes. Int. J of Curr. Microbiol. App. Sci. 2020;9(8):859-863.
- Rajmohan S. Association analysis for yield and its components in urd bean (Vigna mungo L.) Genotypes. Frontiers in crop improvement 5 (Spl) 253-255. The Bioscan. 2015;10(4):2121-2124
- Rajmohan S, Rao SK. Stability analysis in black gram (Vigna mungo L.) genotypes. Electronic Journal of Plant Breeding. 2015;6(4):972-980.