
Research article · 2024 · Full text
International Journal of Veterinary Sciences and Animal HusbandryEffect on blood biochemical, serum total immunoglobulin and blood antioxidant profile of rabbits fed probiotic supplemented diets
Volume 9(1S) · Pages 438–440 · DOI: 10.22271/veterinary.2024.v9.i1sg.1022 ↗
Research areasRabbits: Nutrition, Reproduction, HealthAnimal Nutrition and PhysiologyRuminant Nutrition and Digestive Physiology
Abstract
Author-writtenNewly weaned rabbits are more susceptible for colonization of various microbes in gastrointestinal track. The study was taken up in the Central Sheep and Wool Research Institute, Avikanagar (Rajasthan, India). Sixty weaned rabbits of almost same age (28 days old) and similar initial live body weight were selected and distributed into four groups (T1, T2, T3 and T4 groups) of fifteen each. The diets were given in pelleted form and ad libitum throughout the trials. The pellet feed for the T1 group was not supplemented with probiotics while the pellet feed for groups T2, T3, and T4 was supplemented with Lactobacillus plantarum (Lp), Saccharomyces cerevisiae (Sc), and a combination of Lactobacillus plantarum and Saccharomyces cerevisiae (Lp + Sc), respectively. The microbial population was 106 CFU/g pellet feed. The result indicates significantly ((p
Summary
Source-checkedPlain-language reading of the full paper, prepared with AI and checked against the text. Each point links to the authors' own words.
Why it matters
- Newly weaned rabbits are particularly vulnerable to the colonization of various microbes in their gastrointestinal tract. View evidence ↗
- Maintaining a healthy and diverse microflora in the digestive tract is critical for rabbits to resist intestinal diseases. View evidence ↗
- Probiotics are considered a potential alternative to antibiotics for promoting growth in animals. View evidence ↗
The question
- The study aimed to evaluate how feeding probiotics affects various blood parameters in rabbits. View evidence ↗
What they did
- The experiment used 60 weaned Soviet Chinchilla rabbits, both male and female, all approximately 28 days old with similar initial weights. View evidence ↗
- The treatment groups received different supplements: T1 (no probiotic), T2 (Lactobacillus plantarum), T3 (Saccharomyces cerevisiae), and T4 (a combination of both). View evidence ↗
- The feeding trial lasted for 60 days and was conducted at the Central Sheep and Wool Research Institute in Rajasthan, India. View evidence ↗
What they found
- Probiotic supplementation significantly lowered serum cholesterol levels (p=0.032), with the lowest level observed in the combination group (T4: 58.85 mg/dl) compared to the control (T1: 71.34 mg/dl). View evidence ↗
- Probiotic supplementation had no significant effect on hemoglobin, serum glucose, triglycerides, total protein, albumin, globulin, or the albumin/globulin ratio. View evidence ↗
- There was a numerical increase in serum total immunoglobulin in probiotic groups compared to the control, but this change was not statistically significant (p=0.725). View evidence ↗
- Total oxidative status (TOS) was significantly lower (p=0.000) in all probiotic groups compared to the control group (T1: 94.85 µM H2O2 Equi.). View evidence ↗
- The oxidative stress index (OSI) was significantly reduced (p=0.007) in probiotic-supplemented rabbits compared to the control group. View evidence ↗
- Superoxide dismutase (SOD) activity was significantly higher (p=0.017) in probiotic groups, particularly in T3 (87.81 U/g) and T4 (84.69 U/g), compared to the control (60.13 U/g). View evidence ↗
- No significant difference was found in total antioxidant capacity (TAC) across the different dietary groups (p=0.352). View evidence ↗
What it means
- The authors conclude that adding Lactobacillus plantarum and Saccharomyces cerevisiae to the diets of weaned rabbits lowers serum cholesterol, increases total immunoglobulin, and improves blood SOD activity. View evidence ↗
Visual summary
3 visualsIllustrations explain the paper; charts are replotted from the paper's own table values.
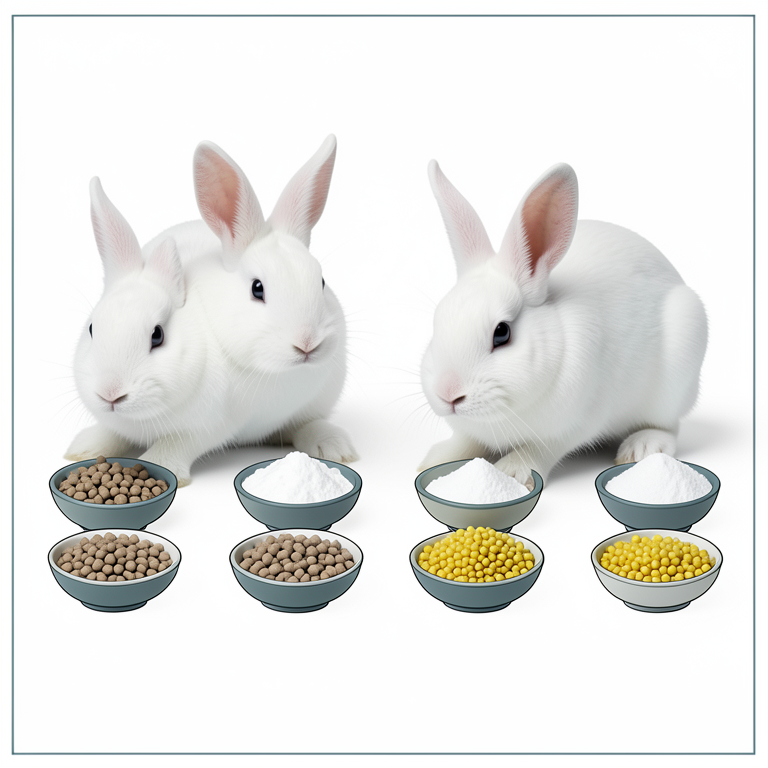
Experimental Group Layout
AI-generated conceptual illustration (New Zealand White rabbits). It explains the idea and does not show study data.
View source evidence ↗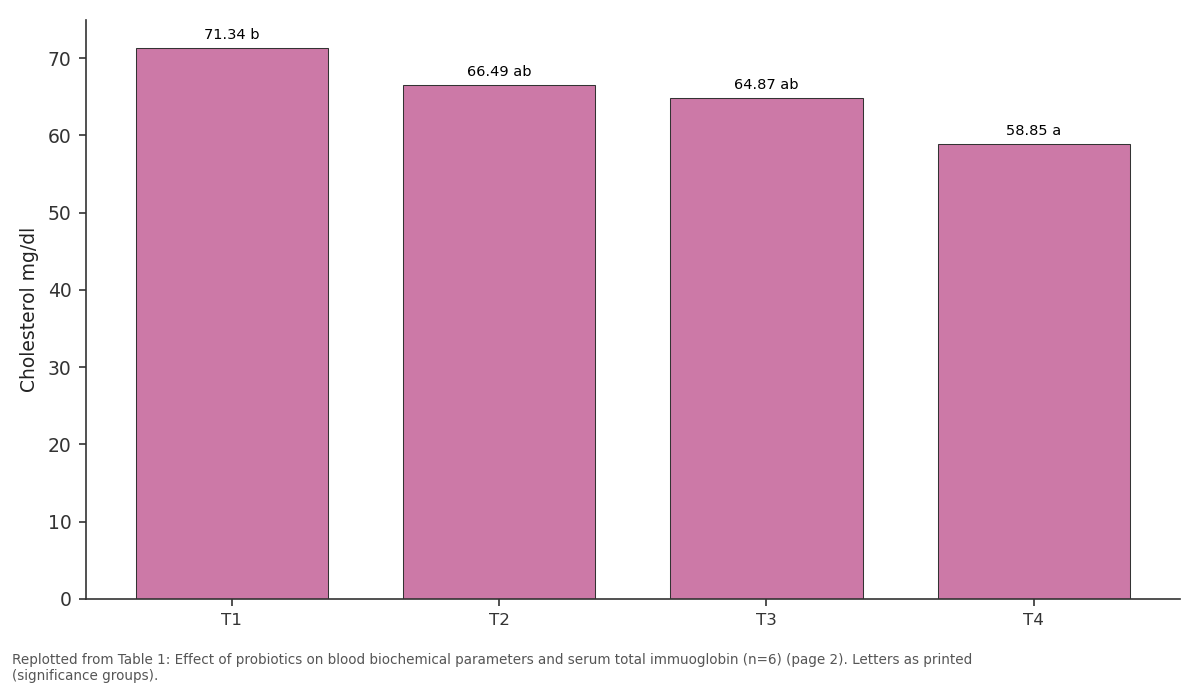
Cholesterol mg/dl: T1 vs T2 vs T3 vs T4
Replotted from Table 1 (page 2) of the original paper. Every bar is the paper's own table value.
View source evidence ↗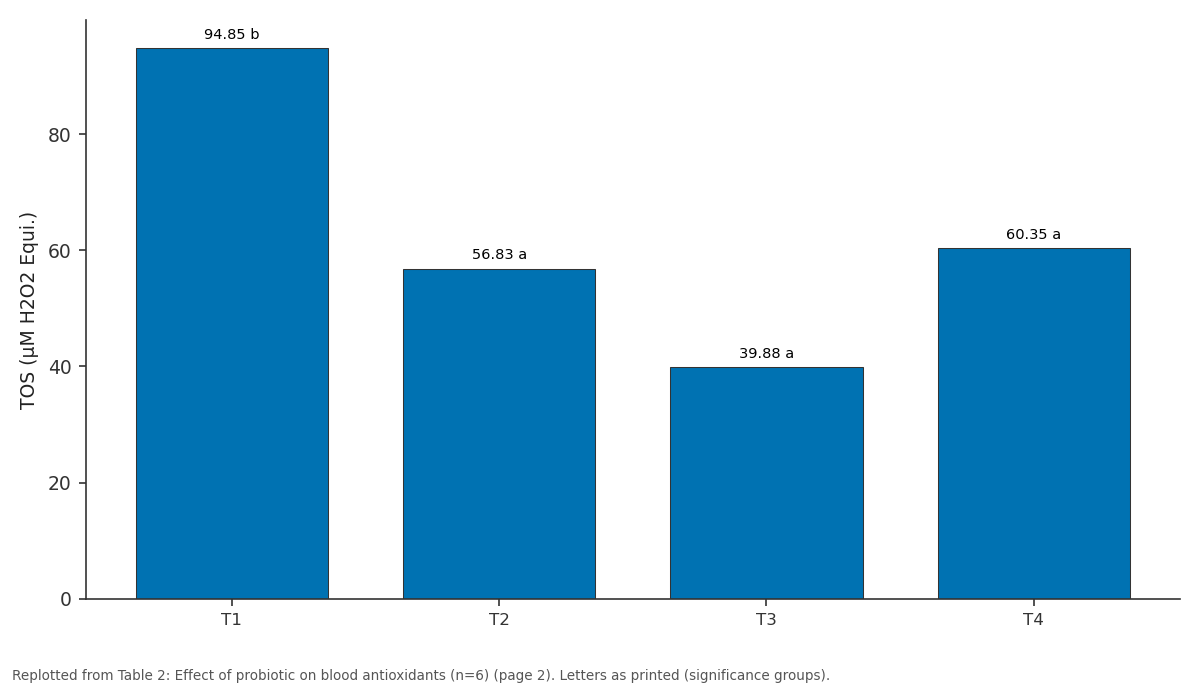
TOS (µM H2O2 Equi.): T1 vs T2 vs T3 vs T4
Replotted from Table 2 (page 2) of the original paper. Every bar is the paper's own table value.
View source evidence ↗Figures & tables
From the original paper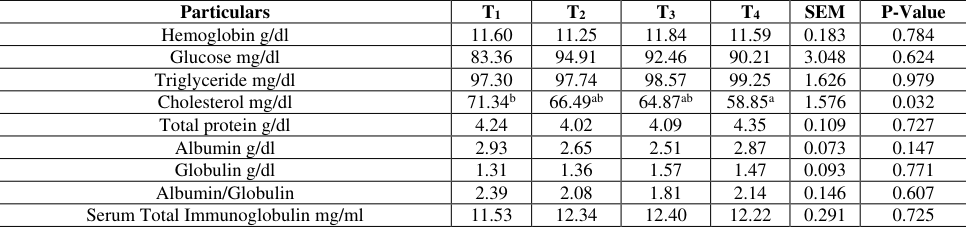 Table 1
 Table 2
Introduction
Probiotics are defined as monocultures or mixed cultures of live microorganisms; when consumed, they exert a beneficial influence on animal health by quantitative and qualitative effects on the intestinal microflora or even modification of the immune system (FAO/ WHO, 2001; Reid, 2016) [6,11] . Probiotic are reported as an alternative to antibiotic for growth promotion. Raising rabbits in an intensive system can cause many environmental and physiological stresses, mainly during the weaning period. The establishment of healthy, stable and diverse digestive tract microflora is of great significance for rabbits to resist intestinal diseases. Proper function of the mucosa-associated immune system relies on the presence of intestinal bacteria. The use of probiotics had many potential benefits such as modified host metabolism, immune-stimulation, anti-inflammatory reactions, exclusion and killing of pathogens in the intestinal tract, reduced bacterial contamination on processed broiler carcasses, enhanced nutrient absorption and performance, and ultimately decreased human health risk (Edens, 2003; Patil et al., 2015) [2,11] . This study was conducted to assess the effect of probiotics feeding on various blood parameters of rabbit.
Materials and Methods
The present study was conducted to evaluate the effect of probiotic supplementation in rabbit feed in terms of biochemical, immunological and antioxidant parameters of blood, in weaned rabbits. A total 60 number of weaned (28 days old) Soviet Chinchilla male and female rabbits with nearly similar initial live body weight were used for the study. The rabbits were divided into four groups (T1, T2, T 3 , and T 4 groups) with fifteen (8 males + 7 females) rabbits in each group. The feeding experiments on weaned rabbits was carried out for 60 days at the Central Sheep and Wool Research Institute, Avikanagar (Rajasthan, India).
Rabbits were housed individually under similar housing and management conditions in wire mesh cages (180 × 240 × 180 mm) inside an asbestos-roofed animal shed. The diets were given in pelleted form and ad libitum throughout the trials. The pellet feed for the T 1 group was not supplemented with probiotics while the pellet feed for groups T 2 , T 3 , and T 4 was supplemented with Lactobacillus plantarum (Lp), Saccharomyces cerevisiae (Sc), and combination of Lactobacillus plantarum and Saccharomyces cerevisiae (Lp+Sc) respectively. The freshly cultured broth media of individual probiotics was incorporated as 100 milliliters per kilogram of feed during the pellet feed formulation. Pellets were assessed for respective microbial populations (10 6 CFU/g Pellet) 0, 7 and 15 days interval. Blood samples were collected from the animals on the final day of experimental feeding by heart puncture into tubes containing anticoagulant (sodium heparin) or without anticoagulant for different analyses. The blood samples were transported to the laboratory in an ice bath. Serum was harvested from whole blood after clotting at 37 o C for 4 h followed by centrifugation at 500×g for 20 min. Serum was stored at -20 o C until further analysis. After centrifugation the supernatant (i.e. serum) was made in two aliquots; one for serum enzymes and another for total protein, cholesterol, albumin, and serum glucose estimation. All the estimations were done in duplicate. All the blood biochemical parameters were estimated by using Accurex Biomedical Pvt Ltd, India. Total immunoglobulin in serum sample was estimated by zinc turbidity method (Mc Ewan and Fisher, 1970) [8] . For the estimation of blood antioxidant enzyme activity blood was centrifuged at 2000 rpm for 10 min. After that plasma was removed from centrifuge tube and then 1 ml of chilled normal saline was added in the sediment and again it was centrifuged at 2000 rpm for 20 min at 4 °C, after that supernatant along with buffy coat was removed and again 1 ml of chilled normal saline was added. Same step was repeated for 3 times. After removal of supernatant, equal amount of normal saline was added in the tube as much it contained sediment and was mixed well. Lastly hemolysate was made by adding 200 µl RBC suspension into 1800 µl EDTA stabilizing solution (2.7 mM, pH-7 EDTA and 0.7 mM beta-mercaptoethanol). Hemolysate was kept in -20 °C for further analysis. The total antioxidant capacity (TAC), total oxidative status (TOS) and oxidative stress index were determined manually following the procedures described by Erel ( 2004) [4] and Erel (2005) [5] . Superoxide dismutase activity was determined manually following the procedure described by Marklund and Marklund (1974) [9] . The experimental data's were analyzed using ANOVA using SPSS-16 software. The Significance of mean values among different dietary treatments were tested by Tukey's test. Results of blood biochemical parameters were presented in Table 1. The findings of this study revealed no effect of probiotics supplementation on blood components including hemoglobin, serum glucose, triglyceride, total protein, albumin, globulin, and ratio of albumin and globulin. However, cholesterol level was affected (p≤0.05). The cholesterol-lowering effect was found in the probiotics supplemented groups (T2, T 3 , and T 4 ) as compared to the noprobiotics supplemented group (T 1 ). Results of total immunoglobulin were insignificant numerical increased in probiotic supplemented groups compared with the noprobiotic group. Abdel-Azeem et al. (2009) [1] reported that cholesterol content in serum blood were reduced significantly (p≤0.01 or 0.05) for rabbits fed a diet containing 400 mg Bioplus 2B/kg feed as compared to the other groups. El-Shafei et al. (2019) [3] also reported a similar result of cholesterol-lowering effect and increase serum immunoglobulin effect in probiotics supplemented groups. The results showed that, all probiotics supplemented groups recorded non-significant differences in total antioxidant capacity (TAC). Significant (p≤0.05) differences were observed in total oxidative status (TOS), super oxide dismutase (SOD) activity and oxidative stress index (OSI).
| Particulars | T1 | T2 | T3 | T4 | SEM | P-Value |
|---|---|---|---|---|---|---|
| Hemoglobin g/dl | 11.60 | 11.25 | 11.84 | 11.59 | 0.183 | 0.784 |
| Glucose mg/dl | 83.36 | 94.91 | 92.46 | 90.21 | 3.048 | 0.624 |
| Triglyceride mg/dl | 97.30 | 97.74 | 98.57 | 99.25 | 1.626 | 0.979 |
| Cholesterol mg/dl | 71.34b | 66.49ab | 64.87ab | 58.85a | 1.576 | 0.032 |
| Total protein g/dl | 4.24 | 4.02 | 4.09 | 4.35 | 0.109 | 0.727 |
| Albumin g/dl | 2.93 | 2.65 | 2.51 | 2.87 | 0.073 | 0.147 |
| Globulin g/dl | 1.31 | 1.36 | 1.57 | 1.47 | 0.093 | 0.771 |
| Albumin/Globulin | 2.39 | 2.08 | 1.81 | 2.14 | 0.146 | 0.607 |
| Serum Total Immunoglobulin mg/ml | 11.53 | 12.34 | 12.40 | 12.22 | 0.291 | 0.725 |
Table text extracted from the original PDF; superscript letters are shown inline. The original table image is below.
View original table image
Results and Discussion
Highest TOS was reported in no-probiotics supplemented group as compared to probiotic supplemented groups. OSI was also indicated low TOS in probiotic supplemented groups. SOD activity was reported high in probiotic supplemented group than no-probiotic supplemented group. Ghoneim et al. (2016) [7] also reported microsomal SOD activity was elevated in liver, kidneys, and skeletal muscles of probiotics-fed animal. Shah et al. (2018) [12] also reported the superoxide dismutase increased (p≤0.05) in probiotic supplemented group compared to the control groups.
Figures and tables from the paper
| Parameters | T1 | T2 | T3 | T4 | SEM | P-Value |
|---|---|---|---|---|---|---|
| TAC (µM Trolox Equi.) | 3896.11 | 3443.33 | 3511.48 | 4041.11 | 136.869 | 0.352 |
| TOS (µM H2O2 Equi.) | 94.85b | 56.83a | 39.88a | 60.35a | 5.345 | 0.000 |
| OSI (Per cent) | 2.54b | 1.68a | 1.15a | 1.53a | 0.158 | 0.007 |
| SOD (U/g) | 60.13a | 79.92ab | 87.81b | 84.69b | 3.593 | 0.017 |
Table text extracted from the original PDF; superscript letters are shown inline. The original table image is below.