
Research article · 2024 · Full text
International Journal of Research in AgronomyD2 analysis and principal component analysis to assess genetic divergence in Sorghum bicolor (L.) moench for yield and its related attributes
Volume 7(1) · Pages 322–326 · DOI: 10.33545/2618060x.2024.v7.i1e.234 ↗
Research areasGenetics and Plant BreedingRice Cultivation and Yield ImprovementGenetic Mapping and Diversity in Plants and Animals
Abstract
Author-writtenThe present study was carried out during kharif 2022-23 at Crop Research Centre-1, Department of Genetics and Plant Breeding, ITM University, Gwalior (M.P.) India. The study was carried out in randomized block design in three replications to evaluate the genetic divergence in 30 sorghum genotypes for 14 characters to determine genetic diversity using D2 analysis and principal component analysis, D2 values ranged between D2 = 80.0061 and D2 = 3471544.8770 showing high genetic divergence between the genotypes, on the basis of the D2 values 30 genotypes were grouped into 7 Clusters, Cluster-I with highest 14 genotypes and Cluster-VII with least 1 genotype, inter-Cluster values ranged between D2 = 3171872.80 to D2 = 80396.26, while the intra-Cluster values ranged between D2 = 27422.98 to D2 = 2032.887 genetic divergence was recorded maximum for transpiration rate (99.1%) on the other hand principal component analysis showed Eigen values > 1 for first four principal components which altogether contributed to 77% of the total genetic divergence.
Summary
Source-checkedPlain-language reading of the full paper, prepared with AI and checked against the text. Each point links to the authors' own words.
Why it matters
- Sorghum is a critical staple crop for food security in African regions where agricultural water is scarce. View evidence ↗
- In India, where 42% of the land area is drought-prone, sorghum is highly valued and can be further improved through breeding. View evidence ↗
- Sorghum is a multipurpose crop used for dairy fodder, sugar substitutes, and biofuel production. View evidence ↗
The question
- The study aimed to assess genetic diversity in sorghum to identify variable sources for developing high-yielding varieties suitable for commercial cultivation in drought-prone areas. View evidence ↗
What they did
- The experiment took place during the kharif season of 2022-23 at the Crop Research Centre, ITM University, Gwalior, India. View evidence ↗
- Genetic divergence was analyzed using Wilk's criterion and Tocher's method to group genotypes into clusters. View evidence ↗
What they found
- The 30 genotypes were divided into 7 clusters, with Cluster-I being the largest (14 genotypes) and Cluster-VII the smallest (1 genotype). View evidence ↗
- The highest inter-cluster genetic distance was found between Cluster I and Cluster VII (D2 = 3,171,872.80). View evidence ↗
- Transpiration rate was the trait that contributed most to the genetic divergence among the genotypes, at 99.1%. View evidence ↗
- Principal component analysis identified four components with Eigen values greater than 1, which together explained 77% of the total genetic divergence. View evidence ↗
- Cluster VI exhibited the highest grain yield per plant, measuring 56.96856. View evidence ↗
- Green fodder yield per plant was highest in Cluster I (447.7171) and lowest in Cluster II (281.8267). View evidence ↗
- Dry fodder yield per plant reached its maximum in Cluster VII (187.8333) and its minimum in Cluster IV (108.9378). View evidence ↗
What it means
- The authors conclude that crossing Gird-1 and Gird-5, which showed the maximum distance, would likely produce heterotic hybrids with high variability. View evidence ↗
- The authors recommend the genotype Gird-5 for the development of drought-tolerant varieties due to its transpiration rate and stomatal count. View evidence ↗
Visual summary
3 visualsIllustrations explain the paper; charts are replotted from the paper's own table values.
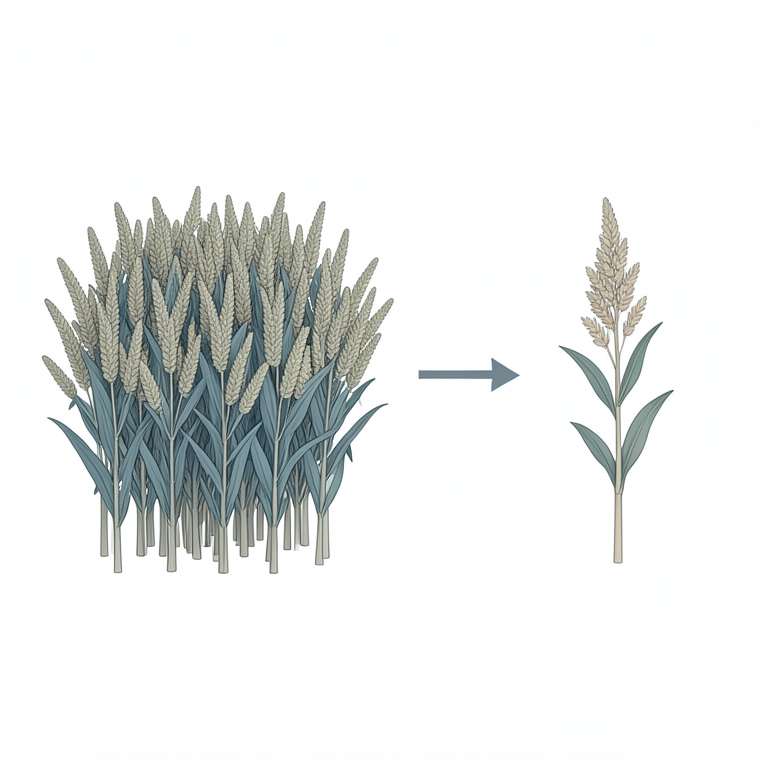
Genotype Clustering Concept
AI-generated conceptual illustration (Sorghum bicolor plants). It explains the idea and does not show study data.
View source evidence ↗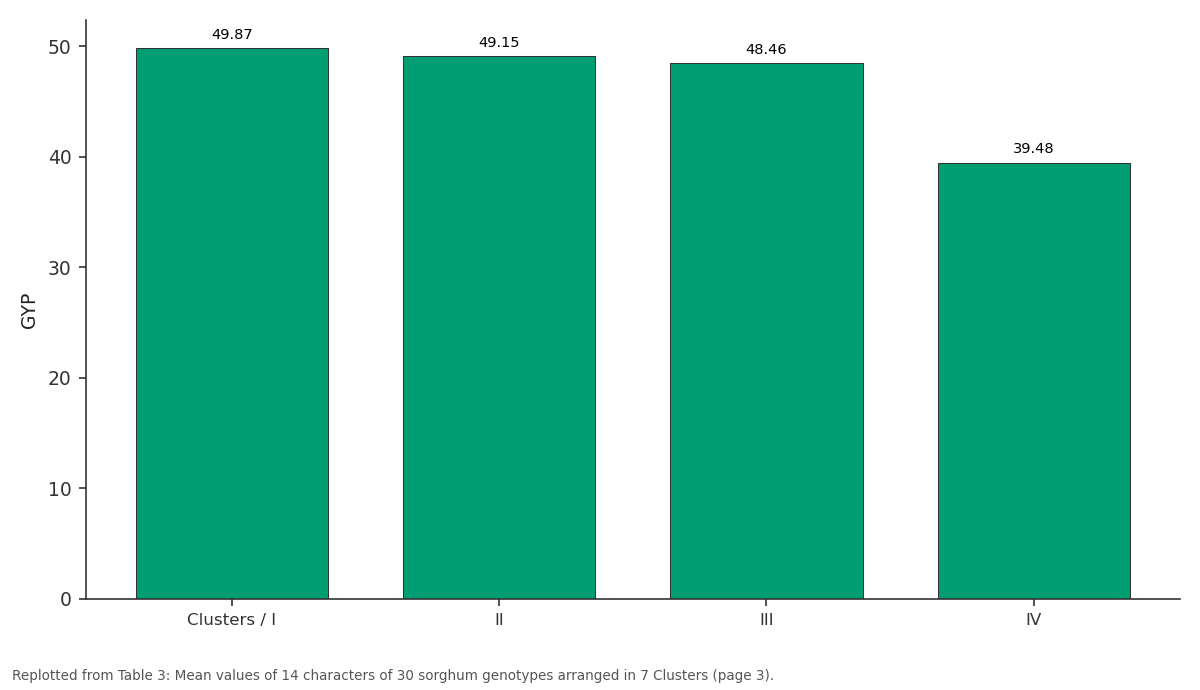
GYP: Clusters / I vs II vs III vs IV
Replotted from Table 3 (page 3) of the original paper. Every bar is the paper's own table value.
View source evidence ↗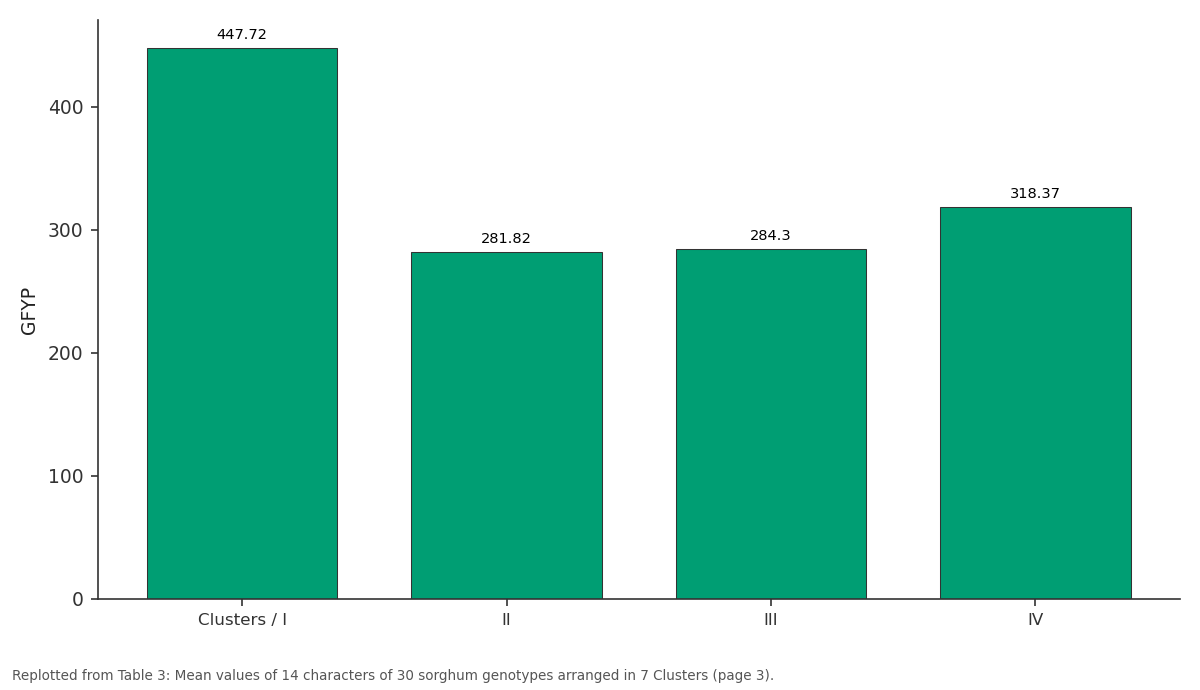
GFYP: Clusters / I vs II vs III vs IV
Replotted from Table 3 (page 3) of the original paper. Every bar is the paper's own table value.
View source evidence ↗Figures & tables
From the original paper Table 1
 Table 2
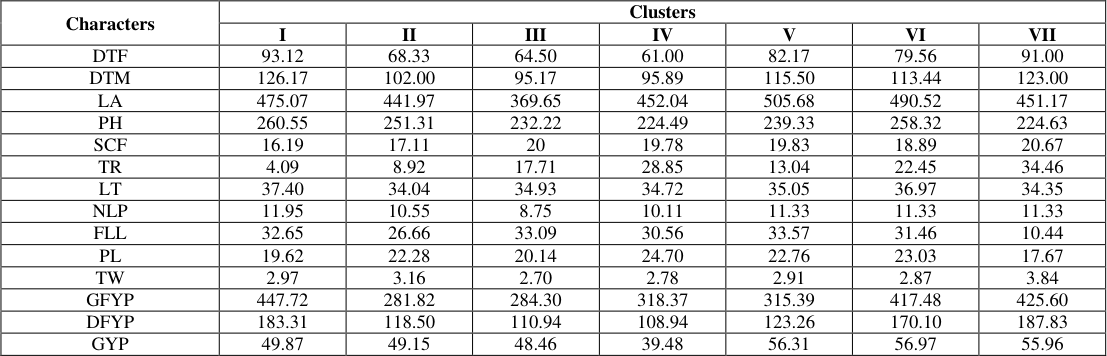 Table 3
 Table 4
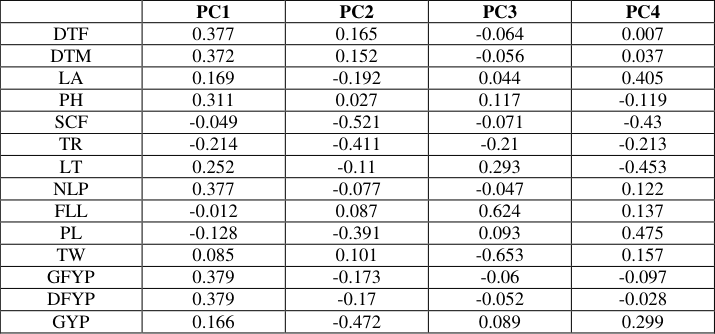 Table 5
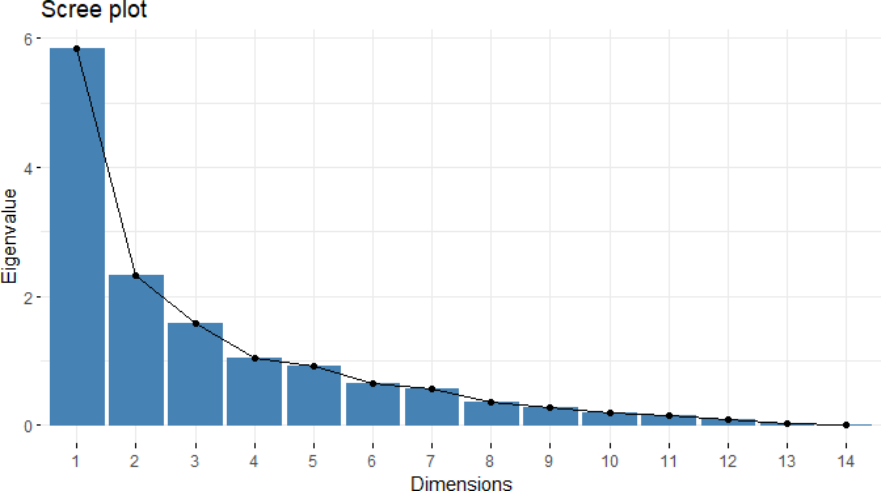 Figure 1
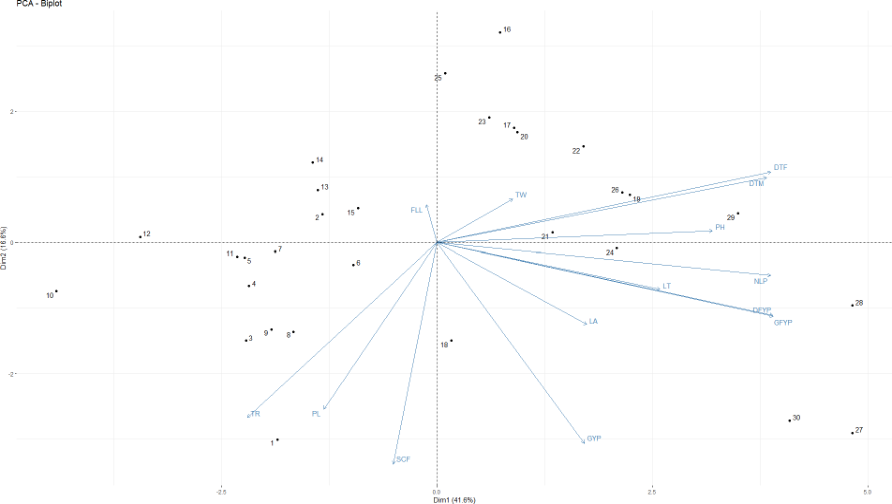 Figure 2
Introduction
Sorghum [Sorghum bicolor (L.) Moench, 2n = 2x = 20] is one of the important staple crops, in African countries which provides food security to areas where water for agriculture is a deficit commodity. For such areas importance of sorghum can be established by the fact that extensive work is being perused in the forms of breeding programs designed for sorghum in such agroclimatic zones, in the present times when 42% of India's land area is under drought crops like sorghum are natures gift to mankind, which can be further enhanced by breeding. In present India ranks sixth for sorghum production in world with a total production of 4423 thousand tons on 4584 thousand ha of area with a productivity of 1.0 tons/ha (Anonymous, 2022-2023), the ability of sorghum to tolerate drought comes from how its morphology behave when exposed to stress, in addition to it sorghum is also a multipurpose crop as it provide fodder for dairy industry and sweet sorghum varieties are potential substitute for sugar and biofuel production, also Sorghum is good substitute to fulfil the requirement of healthy staple food and fodder in dairy industry, sorghum is important crop in various aspects and should be worked on, for which we have to exploit the variability present for the crop, in the present experiment research scholar has focused on the yield and its related attributes for assessing the genetic divergence using D 2 statistics as for any crop improvement program the knowledge of genetic diversity is a prerequisite the crossing between diverse parent gives heterotic hybrids with good scale of variability which can be evaluated for selection and improvement of various characters as Diversity in germplasm is important for any breeding program, since it directly affects the potential for genetic gain through selection (Kotal et al., 2010) [1] . The principal component analysis was also conducted to differentiate the genotypes on the basis of similarities found among them for various characters as it gives us a clear view of the reason behind the grouping of various genotypes in same group. The high level of genetic diversity and characterization of accessions integrated into world collections is essential in order to classify, mange exotic germplasm, collect and ultimately utilize the different genetic improvement of the crop (Karadi and Kajjidoni, 2019) [2] .
Objective of the above study is to assess the genetic diversity in sorghum to create ample number of variable sources to exploit the variability in sorghum for development of useful sorghum varieties which can be cultivated commercially in the drought prone areas with significant yields.
Materials and Methods
The present experiment was conducted in kharif season 2022-23 at Crop Research Centre, ITM University, Gwalior (M.P.) India which falls under the Gird agroclimatic region of Madhya Pradesh, with 800-1000 mm of annual rainfall and red, light shallow soil, the experimental site is located at 26º 08' 22.6" N latitude and 78º 11' 42.9" E longitude at a height of 211.5m above sea level. It has a semi humid and subtropical climate. Sowing was done by dribbling method at a spacing of 45cm X 15cm in an area of 300 m 2 , the study was conducted in randomized block design with three replications all the characters were recorded for five plants in each replication and their average was worked out Under the study 30 sorghum genotypes were studied for characters namely Days to 50% flowering, Days to maturity, Leaf area (cm 2 ), Plant height at maturity (cm), Stomatal count/microscopic field, Transpiration rate upper surface (μgcm -1 s -1 ), Leaf temperature (ºC), Number of leaves/plant, Flag leaf length (cm), Length of panicle at maturity (cm), Test weight (g), Green fodder yield/plant (g), Dry fodder yield/plant (g) and Grain yield/plant (g) and subjected to the statistical analysis, the significance of difference between sorghum genotypes was based on wilk's (˄) criterion (Wilk, 1932) [3] following which Cluster distances were estimated and genotypes were grouped into population constellations using Tocher's method as described by Rao (1952) [4] . All the statistical analysis was estimated using free source software R Studio, version 4.2.2 package of analysis, for principal component analysis package named 'PRCOMP' was used, all the visualizations were also created using the same software.
Results and Discussion
Analysis of variance and wilk's lambda showed the genotypes being highly significant following which D 2 statistics analysis by Mahalanobis and Tocher's method was conducted on the 30 sorghum genotypes which grouped all the genotypes into 7 Clusters as mentioned below in Table-1, Cluster-I was grouped with maximum 14 members while the Cluster-VII consisted of only one genotype and Cluster-III with four members followed by which Cluster-II, Cluster-IV and Cluster-VI consisted of three members each and Cluster-V with two members. The groups with a smaller number of members are less diverse which can be because of the same ancestry from which they have been evolved. As summarized in Table - showed the maximum and minimum values for dry fodder yield per plant respectively. Grain yield per plant was maximum for Cluster VI (56.96856). it was clearly observable in the given data that Cluster I was grouped with genotypes performing at par for traits viz green fodder yield per plant, leaf temperature, number of leaves per plant, days to 50% flowering, plant height and days to maturity. transpiration rate with value of 99.1% followed by green fodder yield per plant (0.2%), days to 50% flowering, grain yield per plant (0.1%), leaf temperature, number of leaves per plant, days to maturity plant height, dry fodder yield per plant, panicle length at maturity, test weight, leaf area, stomatal count per microscopic field and flag leaf length were contributing towards divergence. Mainly principal component analysis is pursued to minimize the large complex datasets into smaller dimension interpretable results the analysis divides the number of components extracted is equal to the number of variables being analyzed. The first component can be expected to account for a large amount of the total variance. Each succeeding component accounts for progressively smaller amounts of variance (Kavithamani et al., 2019) [6] out of which Data were considered in each component with Eigen values more than 1 as per the suggestions given by Brejda et al. (2000) [5] , that is only components with eigen values > 1 was selected in the present study, as visualized Fig 1: Scree plot clearly depicts that the first four principal components should be selected out of 14, though each principal component contributed for the divergence, maximum divergence was observed for Principal component-1 (41.6%) followed by Principal component-2 (16.6%), Principal component-3 (11.3%), Principal component-4 (7.4%) as stated in Table 4, for principal component-1 characters like green fodder yield per plant, dry fodder yield per plant, number of leaves per plant, days to 50% flowering, days to maturity, plant height and leaf temperature contributed the higher factor loadings as mentioned in Table-5, similarly for principal component-2 higher factor loadings were observed for days to 50% flowering, days to maturity, test weight and flag leaf length, for principal component-3, flag leaf length, leaf temperature and plant height, for principal component-4, panicle length, leaf area, grain yield per plant and teat weight. Abraha et al. (2015) [8] on evaluating 25 sorghum genotypes through D 2 analysis and observed similar results for grain yield, biomass, stay-green and leaf area similarly Prasad and Sridhar (2019) [9] found characters like 100 seed weight. Ear length, grain yield per plant, number of leaves per plant, days to 50% flowering and days to maturity contributing for maximum divergence in 40 yellow pericarp sorghum genotypes. Principal component analysis conducted by Prasanth et al. (2021) [10] exhibited the similar results for Fresh biomass, days to flowering and plant height similarly Rohila et al. (2022) [11] for green fodder yield, dry fodder yield, and plant height Kavithamani et al. (2019) [6] for 100 seed weight and Plant height. and Gird-5 showed maximum distance between therefore hybrids between them will be a heterotic hybrid with maximum variability, higher magnitude of inter Cluster values than intra Cluster values indicated the presence of a good deal of variability within Clusters, 30 sorghum genotypes were found to be most diverse for the character; transpiration rate. On the basis of the mean values of Clusters for various characters it can be concluded that for improvement in character of green fodder yield per plant varieties namely Gird-11, Gird-21, Gird-8 can be utilized similarly for improvement in panicle length varieties like SPV-2493, CSV-17, SPV-2375 can be used, for improvement in dry fodder yield per plant, test weight, transpiration rate and stomatal count genotype Gird-5 can be utilized or we can say that Gird-5 is useful for making a drought tolerant variety. On the basis of the principal component analysis, it was concluded that characters like green fodder yield per plant, dry fodder yield per plant, days to flowering, days to maturity, plant height, grain yield per plant, leaf temperature, test weight, leaf area, number of leaves per plant were highly diverse. And it can be stated that for these characters the following genotypes can be utilized as parents in hybridization programs.
| — | PC1 | PC2 | PC3 | PC4 | PC5 | PC6 | PC7 | PC8 | PC9 | PC10 | PC11 | PC12 | PC13 | PC14 |
|---|---|---|---|---|---|---|---|---|---|---|---|---|---|---|
| Standard deviation | 2.415 | 1.526 | 1.257 | 1.021 | 0.959 | 0.798 | 0.751 | 0.603 | 0.521 | 0.431 | 0.383 | 0.299 | 0.173 | 0.08 |
| proportion of variance | 0.416 | 0.166 | 0.113 | 0.074 | 0.065 | 0.045 | 0.04 | 0.026 | 0.019 | 0.013 | 0.01 | 0.006 | 0.002 | 0.00047 |
| Cumulative proportion | 0.416 | 0.582 | 0.695 | 0.77 | 0.836 | 0.881 | 0.922 | 0.948 | 0.967 | 0.98 | 0.991 | 0.997 | 0.999 | 1 |
| Eigen values | 5.832 | 2.329 | 1.613 | 1.042 | 0.92 | 0.637 | 0.564 | 0.364 | 0.271 | 0.186 | 0.147 | 0.089 | 0.029 | 0.006 |
Table text extracted from the original PDF; superscript letters are shown inline. The original table image is below.
View original table image
Figures and tables from the paper
| S. No. | Cluster No. | No. of germplasm | Name of germplasms |
|---|---|---|---|
| 1 | I | 14 | Gird-11, Gird-21, Gird-8, Gird-31, JJ-1041, Gird-29, Gird-34, Gird-48, Gird-30, Gird-1, Gird-45, Gird-49, CSV-15, Gird-3 |
| 2 | II | 3 | SPV-2495, JJ-938, SPV-2507 |
| 3 | III | 4 | SPV-2357, SPV-2376, RVJ-1862, JJ-741 |
| 4 | IV | 3 | SPV-2493, CSV-17, SPV-2375 |
| 5 | V | 2 | SPV-2499, Gird-12 |
| 6 | VI | 3 | SPV-2501, SPV-2506, Gird-41 |
| 7 | VII | 1 | Gird-5 |
Table text extracted from the original PDF; superscript letters are shown inline. The original table image is below.
View original table image
| Cluster | I | II | III | IV | V | VI | VII |
|---|---|---|---|---|---|---|---|
| I | 1090.71 | 90040.827 | 659719.71 | 2312885.53 | 285865.119 | 1172239.48 | 3171872.8 |
| II | 2032.887 | 274371.16 | 1517203.9 | 60104.562 | 631204.99 | 2226978.39 | |
| III | 22327.78 | 525486.55 | 85919.189 | 91118.1 | 963659.55 | ||
| IV | 27422.98 | 986442.576 | 208663.52 | 80396.26 | |||
| V | 5545.897 | 309850.01 | 1568183.72 | ||||
| VI | 19041.46 | 499626.57 | |||||
| VII | 0 |
Table text extracted from the original PDF; superscript letters are shown inline. The original table image is below.
View original table image
| Characters | Clusters | — | — | — | — | — | — |
|---|---|---|---|---|---|---|---|
| I | II | III | IV | V | VI | VII | |
| DTF | 93.12 | 68.33 | 64.50 | 61.00 | 82.17 | 79.56 | 91.00 |
| DTM | 126.17 | 102.00 | 95.17 | 95.89 | 115.50 | 113.44 | 123.00 |
| LA | 475.07 | 441.97 | 369.65 | 452.04 | 505.68 | 490.52 | 451.17 |
| PH | 260.55 | 251.31 | 232.22 | 224.49 | 239.33 | 258.32 | 224.63 |
| SCF | 16.19 | 17.11 | 20 | 19.78 | 19.83 | 18.89 | 20.67 |
| TR | 4.09 | 8.92 | 17.71 | 28.85 | 13.04 | 22.45 | 34.46 |
| LT | 37.40 | 34.04 | 34.93 | 34.72 | 35.05 | 36.97 | 34.35 |
| NLP | 11.95 | 10.55 | 8.75 | 10.11 | 11.33 | 11.33 | 11.33 |
| FLL | 32.65 | 26.66 | 33.09 | 30.56 | 33.57 | 31.46 | 10.44 |
| PL | 19.62 | 22.28 | 20.14 | 24.70 | 22.76 | 23.03 | 17.67 |
| TW | 2.97 | 3.16 | 2.70 | 2.78 | 2.91 | 2.87 | 3.84 |
| GFYP | 447.72 | 281.82 | 284.30 | 318.37 | 315.39 | 417.48 | 425.60 |
| DFYP | 183.31 | 118.50 | 110.94 | 108.94 | 123.26 | 170.10 | 187.83 |
| GYP | 49.87 | 49.15 | 48.46 | 39.48 | 56.31 | 56.97 | 55.96 |
Table text extracted from the original PDF; superscript letters are shown inline. The original table image is below.
View original table image
| — | PC1 | PC2 | PC3 | PC4 |
|---|---|---|---|---|
| DTF | 0.377 | 0.165 | -0.064 | 0.007 |
| DTM | 0.372 | 0.152 | -0.056 | 0.037 |
| LA | 0.169 | -0.192 | 0.044 | 0.405 |
| PH | 0.311 | 0.027 | 0.117 | -0.119 |
| SCF | -0.049 | -0.521 | -0.071 | -0.43 |
| TR | -0.214 | -0.411 | -0.21 | -0.213 |
| LT | 0.252 | -0.11 | 0.293 | -0.453 |
| NLP | 0.377 | -0.077 | -0.047 | 0.122 |
| FLL | -0.012 | 0.087 | 0.624 | 0.137 |
| PL | -0.128 | -0.391 | 0.093 | 0.475 |
| TW | 0.085 | 0.101 | -0.653 | 0.157 |
| GFYP | 0.379 | -0.173 | -0.06 | -0.097 |
| DFYP | 0.379 | -0.17 | -0.052 | -0.028 |
| GYP | 0.166 | -0.472 | 0.089 | 0.299 |
Table text extracted from the original PDF; superscript letters are shown inline. The original table image is below.
View original table image
References
9 in the original paper- Kotal BD, Das A, Choudry BK. Genetic variability and association of characters in wheat (Triticum aestivum L.). Asian J Crop Sci. 2010;2:155-160.
- Karadi A, Kajjidoni ST. Genetic diversity and principal component analysis for grain quality and productivity traits in sorghum [Sorghum bicolor (L.) Moench]. Int J Curr Microbiol App Sci. 2019;8(9):839-850.
- Brejda JJ, Moorman TB, Karlen DL, Dao TH. Identification of regional soil quality factors and indicators. I. Central and Southern High-Plains. Soil Sci Soc Am J. 2000;64:21152124.
- Kavithamani D, Yuvaraja A, Selvi B. Principal component analysis and grouping of sorghum (Sorghum bicolor L. Moench) gene pool for genetic diversity. Electronic Journal of Plant Breeding. 2019;10(4):1426-1434.
- Mahalanobis PC. On the generalized distance in statistics. Proceedings of National Institute of Sciences, India. 1936;2:49-55.
- Abraha T, Githiri SM, Kasili R, Araia W, Nyende AB. Genetic variation among sorghum (Sorghum bicolor L. Moench) landraces from Eritrea under post-flowering drought stress conditions. Am J Plant Sci. 2015;6(09):1410.
- Prasad BV, Sridhar V. Diversity Studies in Yellow Pericarp Sorghum [Sorghum bicolor (L.) Moench] Genotypes for Yield Attributes. Int J Curr Microbiol App Sci. 2019;8(12):361-366.
- Prasanth A, Premnath A, Muthurajan R. Genetic divergence study for duration and biomass traits in sorghum [Sorghum bicolor (L.) Moench]. Electronic Journal of Plant Breeding. 2021;12(1):22-27.
- Kavithamani D, Yuvaraja A, Selvi B. Principal component analysis and grouping of sorghum (Sorghum bicolor L. Moench) gene pool for genetic diversity. Electronic Journal of Plant Breeding. 2019;10(4):1426-1434.