
Research article · 2024 · Full text
International Journal of Research in AgronomyEffect of edible coatings chitosan and calcium gluconate on shelf life and quality of mango (Mangifera indica L.) cv. Banganpalli
Volume 7(1) · Pages 327–335 · DOI: 10.33545/2618060x.2024.v7.i1e.235 ↗
Research areasPostharvest Quality and Shelf Life ManagementNanocomposite Films for Food PackagingPlant Physiology and Cultivation Studies
Abstract
Author-writtenAn experiment was conducted to study the effect of edible coatings chitosan and calcium gluconate on ascorbic acid and sugars of mango (Mangifera indica L.) cv. Banganpalli at College of Horticulture-Rajendranagar, SKLTSHU, Siddipet District, Telangana. The experiment was conducted with completely randomized design including six treatments with different concentrations of edible surface coatings and observations were recorded at every three days interval up to end of shelf life. Among different treatments lowest PLW (3.65%), least browning score (4.87), spoilage% (46.98), highest firmness (8.62 kg/cm2), shelf life (17.41), highest TSS (21.86 0Brix) were recorded by T2 - dipping in 2% edible chitosan coating, followed by T1 - dipping in 1% edible chitosan and least was recorded on 3rd day of storage by T6 - control. Post-harvest coating of mango fruits with chitosan has resulted in increased shelf life and quality compared to calcium gluconate and control.
Summary
Source-checkedPlain-language reading of the full paper, prepared with AI and checked against the text. Each point links to the authors' own words.
Why it matters
- Mango is regarded as one of the most significant tropical fruits globally. View evidence ↗
- Producers and traders experience approximately 27% loss of mangoes due to poor storage, handling, or technical gaps. View evidence ↗
- Edible coatings are an innovative method used to extend the shelf life of fruits and manage ripening. View evidence ↗
The question
- The study aimed to compare the effects of chitosan and calcium gluconate edible coatings on the quality and shelf life of mangoes. View evidence ↗
What they did
- The research used a completely randomized design with six treatments: 1% chitosan, 2% chitosan, 2% calcium gluconate, combinations of both, and a control group. View evidence ↗
- Seven fruits per treatment were washed and dipped in the respective coating solutions for 10 minutes before being air-dried in the shade for 20-30 minutes. View evidence ↗
- Measurements included physiological loss in weight (PLW), fruit firmness using a penetrometer, and total soluble solids (TSS) using a digital refractometer. View evidence ↗
What they found
- The 2% chitosan coating (T2) provided the longest shelf life at 17.41 days, compared to 12.02 days for the control group. View evidence ↗
- The lowest physiological loss in weight on the 3rd day was 3.65% in the 2% chitosan treatment (T2). View evidence ↗
- The 2% chitosan coating (T2) maintained the highest fruit firmness on the 3rd day at 8.62 kg/cm². View evidence ↗
- By the 15th day, the 2% chitosan coating (T2) resulted in the lowest spoilage rate of 46.98%. View evidence ↗
- The 2% chitosan coating (T2) showed the least browning score of 4.26 on the 15th day. View evidence ↗
- On the 15th day, the highest total soluble solids (TSS) was 21.86 °Brix in the 1% chitosan treatment (T1). View evidence ↗
- The 2% chitosan coating (T2) received the best organoleptic scores for taste, texture, flavor, color, and overall acceptability. View evidence ↗
What it means
- The authors conclude that chitosan coatings increase the quality and shelf life of mangoes more effectively than calcium gluconate or no coating. View evidence ↗
- The 2% chitosan coating (T2) is identified as the most effective treatment for reducing weight loss and maximizing firmness and shelf life. View evidence ↗
Visual summary
3 visualsIllustrations explain the paper; charts are replotted from the paper's own table values.
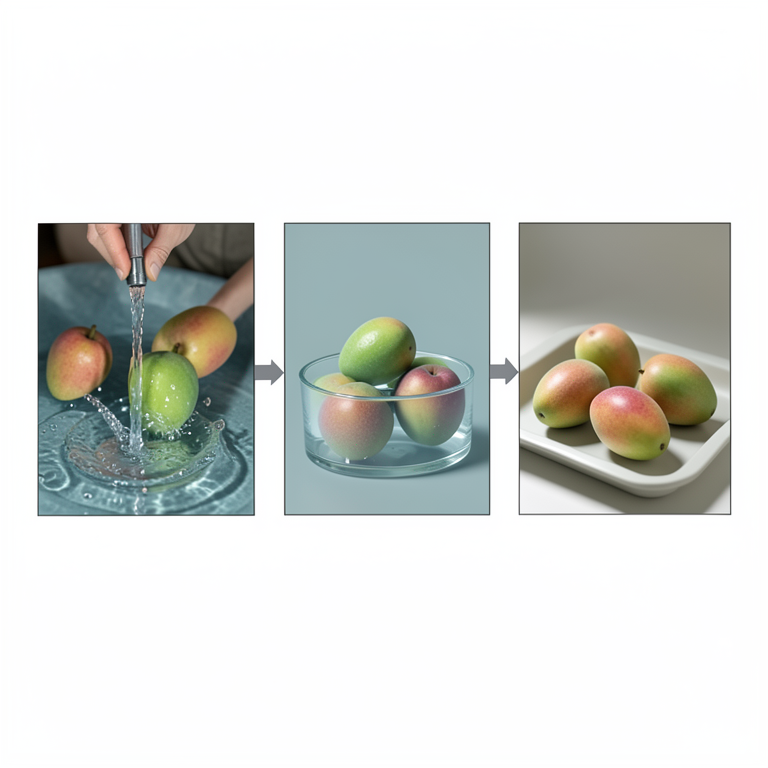
Mango Coating Process
AI-generated conceptual illustration (Banganpalli mangoes). It explains the idea and does not show study data.
View source evidence ↗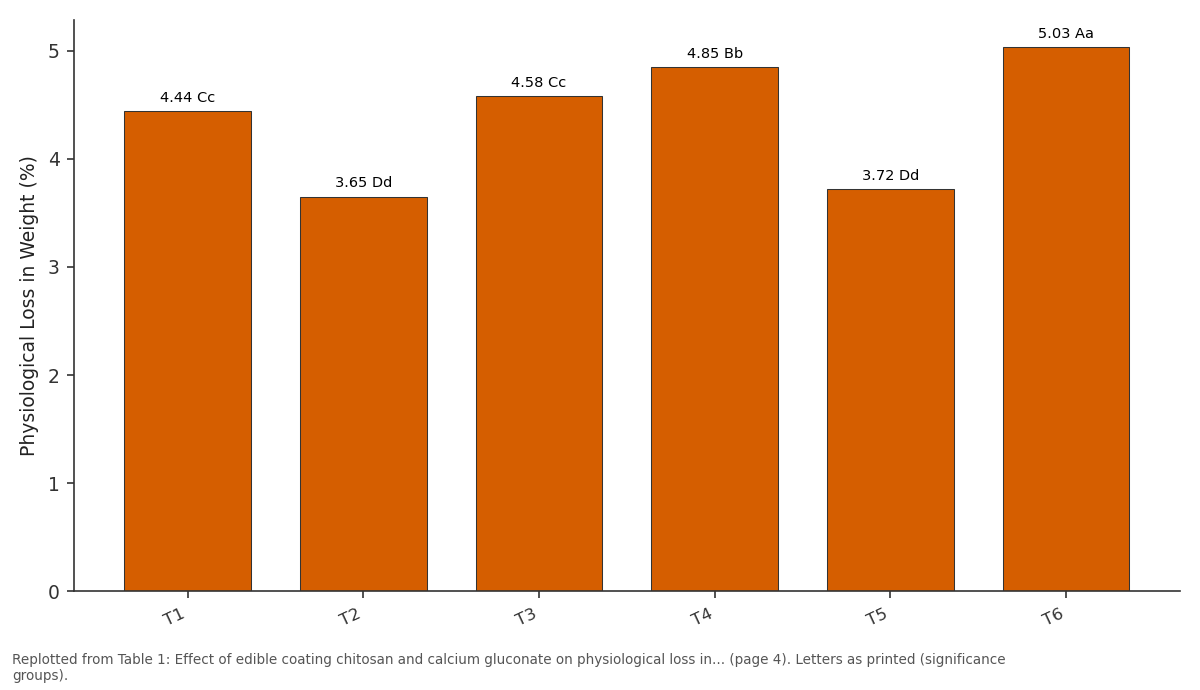
3rd Day: T1 vs T2 vs T3 vs T4 vs T5
Replotted from Table 1 (page 4) of the original paper. Every bar is the paper's own table value.
View source evidence ↗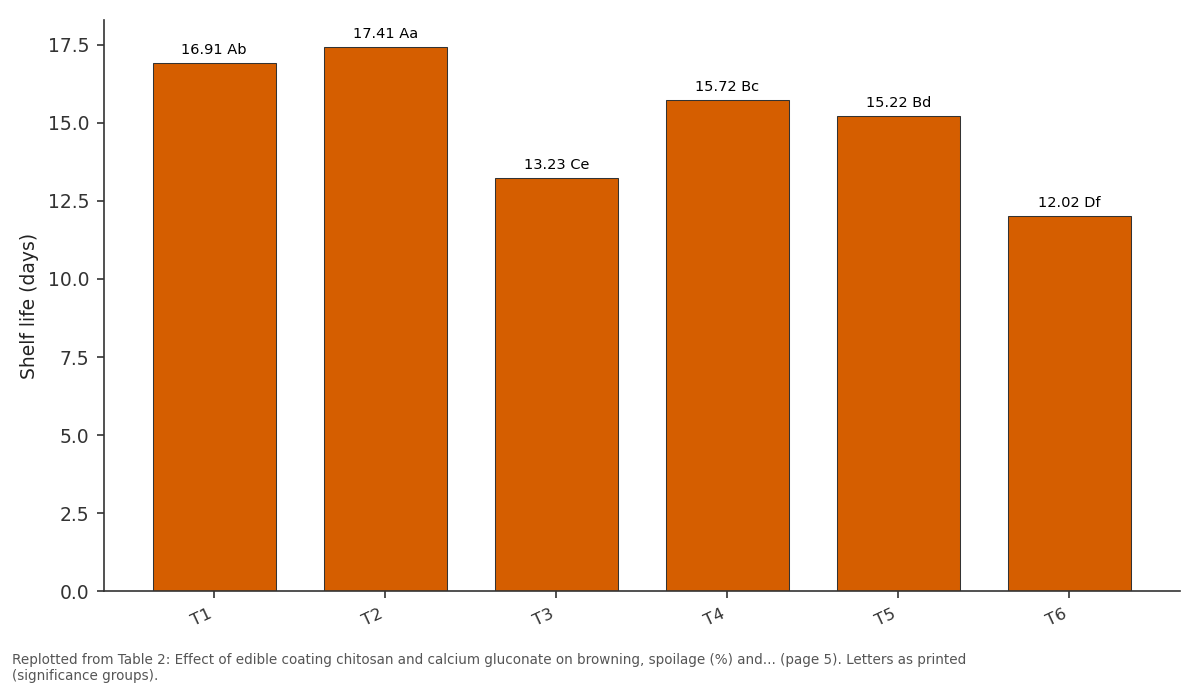
Shelf life (days): T1 vs T2 vs T3 vs T4 vs T5
Replotted from Table 2 (page 5) of the original paper. Every bar is the paper's own table value.
View source evidence ↗Figures & tables
From the original paper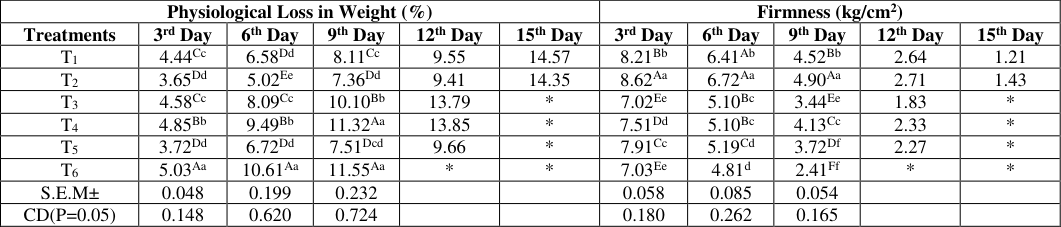 Table 1
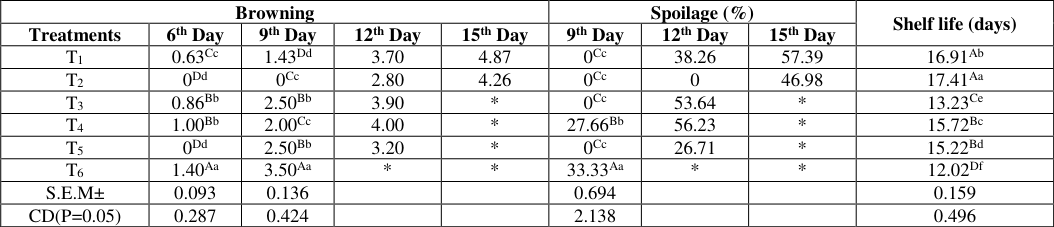 Table 2
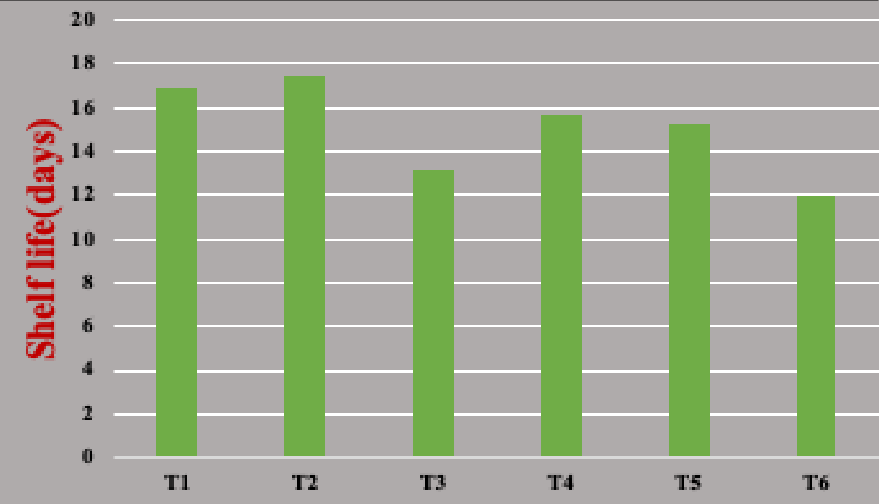 Figure 1
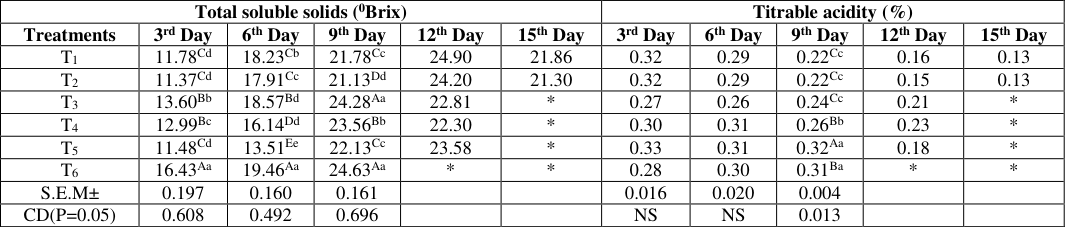 Table 3
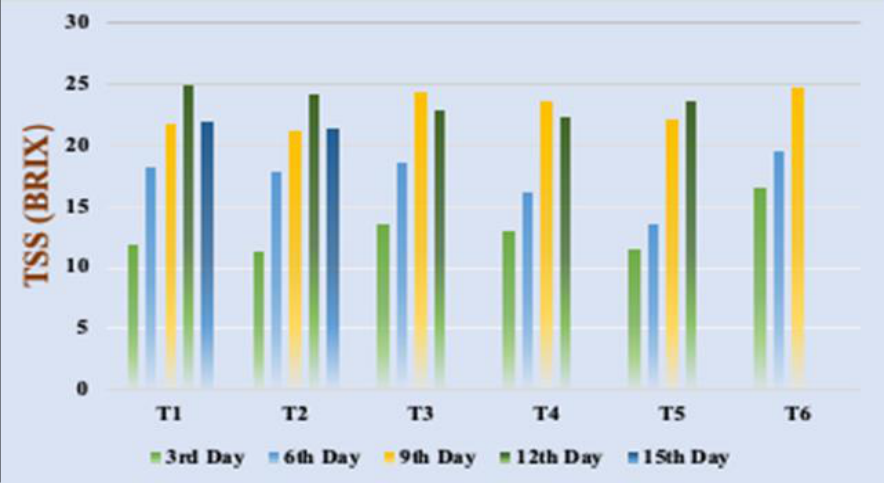 Figure 2
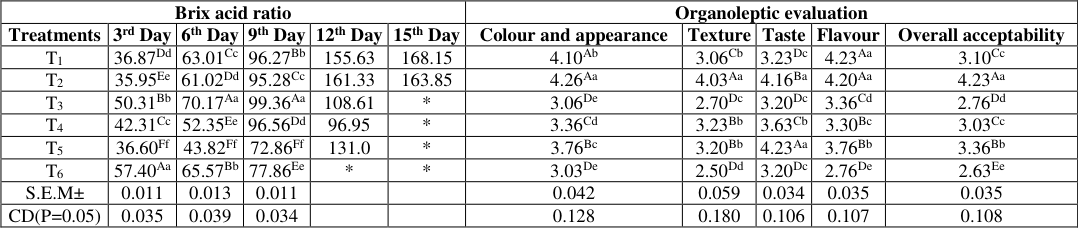 Table 4
Introduction
Mango (Mangifera indica L.) is the king of fruits belongs to the family Anacardiaceae. It is considered as one of the most important tropical fruit of the world, originated in South East Asia. Mango holds special importance in India due to its origin, attachment to culture, heritage, unique taste, exotic flavour, its nutrition and extensive cultivation and it also widely accepted by other parts of the world. It has good nutritional value and is grown in tropical and sub-tropical countries around the world. As ango is a climacteric fruit, it is necessary for us to study and have knowledge about the shelf life of mango with different treatments to decrease postharvest losses. Shelf life defines as the time period between fruit harvest and starting of fruit rot. Shelf life is a deciding factor for marketing and processing of mango. About 27% of loss has to be faced by producers and traders due to improper handling, storage or lack of technical knowledge (Zafrul et al., 2020) [27] . One of the most innovative methods which hastens fruit ripening, extends the shelf life of fruits is application of edible coatings. One of the promising fruit coating agents which is being used widely is chitosan (Fekry, 2018) [9] . Chitosan a natural is produced from chitin shells of shrimp and other crustaceans by deacetylation process. Chitosan has several advantages over other polysaccharides such as bio-degradability, bio-compatibility, and no toxicity. Chitosan and its derivatives are used for the increase of shelf life of a wide range of vegetables and fruits by impede decay. So, one of the interesting function of this biopolymer is product conservancy, because of its ability to be used as a coating material. The function of chitosan as an antimicrobial material as in ascribed to amino groups or hydrogen bonding between chitosan and extracellular polymers (Prashanth et al., 2022) [18] . As a biopolymer, chitosan has excellent film-forming properties and can form a semipermeable film on fruit which may modify the internal atmosphere, as well as decrease weight loss and shrivelling due to transpiration and improve overall fruit quality.
Gluconic acid is one of the various organic acids, gluconic acid is produced by gram-negative bacteria by phosphate solubilization. Gluconic acid and its salts (gluconates) are extensively being used in agriculture as micronutrient agents as they are chelated agents they are suitable for soil, foliar applications and drip irrigation. These micronutrient gluconates are completely assimilated by crops as they are in the form of chelates, hence they are required in lower quantities compared to inorganic compounds (Elisha et al., 2014; Prasanna et al., 2022) [8, 17] . The use of chelated particles especially chelated gluconates is more easily absorbed by plant leaves or roots as they are rich in organic matter. In the process of chelation, the positive charge of micro-nutrients is removed and allows a neutral or slightly negative charged chelated to move through the leaf and root pores more rapidly. As these plant pores are charged negatively, positively charged micronutrients get attached at the pore entrance and becomes difficult to the plant for assimilation, when chelated micronutrients are used there will be no restriction barrier as they are neutral in charge. These micronutrient chelated gluconic acid are available in different forms like calcium gluconate, potassium gluconate, magnesium gluconate, ferrous gluconate manganese gluconate, zinc gluconate and sodium gluconate. Chitosan is a proven edible coating in improving the shelf life of mango (Zhu et al., 2008 and Zafrul et al., 2020) [28,27] , research has also been done on use of calcium gluconates as edible coating in improving the quality and shelf life of guava (Fekry, 2018) [9] . In present study an effort has been made to compare chitosan and calcium gluconate as an edible surface coating to record its effect in improving shelf life and quality of mango.
Materials and Methods
The experiment was conducted at College of Horticulture, Sri Konda Laxman Telangana State Horticultural University, Rajendranagar, and Telangana during the years 2021-22 and 20122-23. Mango fruits used for research were procured from Fruit Research Station-Sangareddy, Telangana. The experiment was conducted in completely randomized design with six treatments, three replications which includes T1 -Dipping in 1% edible chitosan coating, T2 -Dipping in 2% edible chitosan coating, T3 -Dipping in 2% calcium gluconate, T4 -Dipping in 1% edible chitosan coating + 2% calcium gluconate, T5 -Dipping in 2% edible chitosan coating + 2% calcium gluconate, T6 -Control.
Preparation of chitosan solution
For preparation of 1% and 2% chitosan solution dissolve 10g of chitosan powder in 0.1M 5.74ml acetic acid and 1 litre of distilled water.
Preparation of calcium gluconate solution
For the preparation of 1% and 2% calcium gluconate solution diluting 10ml of calcium gluconate in 1 liter of distilled water (Fekry, 2018) [9] .
Method of Application of edible coatings
For each treatment, seven fruits were selected and the fruits were washed thoroughly under running tap water to remove the adherent dirt material. Fruits were treated with 1% and 2% chitosan solution for 10 minutes and then allowed to air dry for 20-30 minutes in the shade, similarly, fruits were dipped in 1% and 2% calcium gluconate solution for 10 minutes and air-dried. The analysis of the fruits was done at every 3 days intervals. 3 fruits in each treatment were undisturbed for evaluation of physiological loss in weight, spoilage and shelf life. The remaining was used for analyzing the physical and quality parameters.
The weight of the fruit was recorded on the day of analysis and subtracted from the initial weight taken at the time of harvest. The loss of weight in grams about initial weight was calculated and expressed as a percentage.
Fruit firmness at random was measured on three fruits from each replicate by measuring the penetration force with a penetrometer (Deccan Techno Corporation, 0-20 kg) equipped with a probe of 8.0 mm diameter and expressed in kg cm -2 ).
The shelf life was determined by recording the number of days the fruits remained in good condition without spoilage in each replication during storage. When the fruit reached a stage that is unsuitable for marketing, it was considered as the end of shelf life which was judged by visual scoring.
The number of fruits spoiled in replication was counted and expressed in percentage. The spoilage of fruits was determined based on the following visual observations. 1. Shrivelling of the fruits. 2. Fungal infection and subsequent rotting of fruits. 3. Over ripening and subsequent splitting of fruits. 4. Browning and discoloration of fruits.
Browning
Browning of each fruit was scored using a 5 points hedonic scale given below (Ramma, 2004; Butta et al., 1999) [23,6] . Score Description 1. No browning 2. Slight browning 3. 25% browning 4. 25-50% browning 5. 50-75% browning 6. > 75% browning
Total soluble solids (0Brix)
The percentage of total soluble solids (TSS) was determined by using a digital refractometer and expressed as percent TSS (0 Brix).
Ten grams of fruit pulp was taken and ground well and then transferred to the volumetric flask. The volume was made up to 100 ml in a volumetric flask. The contents were filtered through Whatman No.1 filter paper and an aliquot of 10 ml was taken into the conical flask to which 2-3 drops of phenolphthalein indicator was added and titrated against 0.1 N NaOH till a pink colour, as the endpoint. The titrable acidity was estimated in terms of percent citric acid (Ranganna, 1986) [24] .
Brix: Acid Ratio
The brix acid ratio was calculated by dividing the T.S.S value by the acid value (Titratable Acidity).
Organoleptic evaluation
The organoleptic characters viz., colour and appearance, texture, taste, flavour and overall acceptability of mango fruits at the end of their shelf life were evaluated on five points hedonic scale using the score card mentioned below (Ranganna, 1986) [24] .
Hedonic scale Scores
Highly acceptable 5 Acceptable 4 Fairly acceptable 3 Poorly acceptable 2 Not acceptable 1
Results and Discussion
Results and Discussion
The effect of post-harvest application of edible coating chitosan and calcium gluconate on PLW of mango in at different intervals is conferred in Table 1 was found significantly different among the treatments. It is evident from the data that there was a gradual increase in PLW from 3 rd to 15 th day of storage. The lowest (3.65%) PLW was recorded on 3 rd day and the significantly highest (14.57%) and (14.35%) PLW was recorded on 15 th day in treatment T1dipping in 1% edible chitosan coating and T2 -dipping in 2% edible chitosan coating respectively, as the days proceeded the PLW of fruits increased gradually. On 3 rd day among different treatments lowest PLW was noted by T2 -dipping in 2% edible chitosan coating (3.65%) which was significantly superior to other treatments followed by T5dipping in 2% edible chitosan coating + 2% calcium gluconate (3.72%) and highest PLW was recorded by T6 -control (5.03%) followed by T4 -dipping in 1% edible chitosan coating + 2% calcium gluconate (4.85%). On 6 th day lowest PLW was recorded by T2 -dipping in 2% edible chitosan coating (5.02%) followed by T1 -dipping in 2% edible chitosan coating (6.58%) which was on par with T5dipping in 1% edible chitosan coating + 2% calcium gluconate (6.72%) and highest PLW was noted by T6 -control (10.61%) followed by T4 -dipping in 1% edible chitosan coating + 2% calcium gluconate (9.49%). On 9 th day of storage, T2 -dipping in 2% edible chitosan coating (7.36%) recorded the least PLW which is on par with T5dipping in 2% edible chitosan coating + 2% calcium gluconate (7.51%) and T1 -dipping in 1% edible chitosan coating (8.11%) and T6 -control (11.55%) recorded the highest PLW which was on par with T4 -dipping in 1% edible chitosan coating + 2% calcium gluconate (11.32%). On 12 th day T2 -dipping in 2% edible chitosan coating (9.41%) recorded the lowest PLW followed by T1 -dipping in 1% edible chitosan coating (9.55%) and T4 -dipping in 1% edible chitosan coating + 2% calcium gluconate (13.85%) recorded the highest PLW. While T6control shows end of shelf life. On 15 th day of storage lowest PLW was recorded by T2 -dipping in 2% edible chitosan coating (14.35%) and the highest PLW was recorded by T1 -dipping in 1% edible chitosan coating (14.57%). While T3, T4 and T5 shows end of shelf life. Mango fruits coated with edible chitosan has given better results when compared with calcium gluconate. Among chitosan coated fruits 2% chitosan-coated fruits are found to be best on 1% chitosan-coated fruits as chitosan coating reduces the loss of water and carbon reserves by transpiration and respiration respectively as it acts as a barrier between atmosphere and fruit surface, which resulted in reduced loss of weight in fruits. Zafrul et al. (2020) [28] reported that weight loss in mango fruits was slow in 1.5% chitosan treated fruits, while it was fast in fruits coated with 0.75% chitosan. Fruit weight loss were found to be higher in higher concentrations of chitosan when compared to t lower concentrations of chitosan (Baviskar et al., 1995) [5] . Ali et al., 2011 revealed that there was proper maintenance of appearance and quality of fruits with decrease in moisture loss and respiration rate by application of 1.5% and 2% chitosan coatings that to the control, similar results were noted by Prashanth et al., 2022 [18] in dragon fruit.
| Physiological Loss in Weight (%) | — | — | — | — | — | Firmness (kg/cm2) | — | — | — | — |
|---|---|---|---|---|---|---|---|---|---|---|
| Treatments | 3rd Day | 6th Day | 9th Day | 12th Day | 15th Day | 3rd Day | 6th Day | 9th Day | 12th Day | 15th Day |
| T1 | 4.44Cc | 6.58Dd | 8.11Cc | 9.55 | 14.57 | 8.21Bb | 6.41Ab | 4.52Bb | 2.64 | 1.21 |
| T2 | 3.65Dd | 5.02Ee | 7.36Dd | 9.41 | 14.35 | 8.62Aa | 6.72Aa | 4.90Aa | 2.71 | 1.43 |
| T3 | 4.58Cc | 8.09Cc | 10.10Bb | 13.79 | * | 7.02Ee | 5.10Bc | 3.44Ee | 1.83 | * |
| T4 | 4.85Bb | 9.49Bb | 11.32Aa | 13.85 | * | 7.51Dd | 5.10Bc | 4.13Cc | 2.33 | * |
| T5 | 3.72Dd | 6.72Dd | 7.51Dcd | 9.66 | * | 7.91Cc | 5.19Cd | 3.72Df | 2.27 | * |
| T6 | 5.03Aa | 10.61Aa | 11.55Aa | * | * | 7.03Ee | 4.81d | 2.41Ff | * | * |
| S.E.M± | 0.048 | 0.199 | 0.232 | 0.058 | 0.085 | 0.054 | ||||
| CD(P=0.05) | 0.148 | 0.620 | 0.724 | 0.180 | 0.262 | 0.165 |
Table text extracted from the original PDF; superscript letters are shown inline. The original table image is below.
View original table image
The data pertaining to fruit firmness in Table 4.3.1 and Fig 32 revealed the effect of edible chitosan and calcium gluconate on mango fruits at different intervals have significant difference among all the treatments. It was evident from the data that there was a gradual decrease of fruit firmness from 3 rd to 15 th day of storage. The highest (8.62 kg cm -2 ) firmness was recorded on 3 rd day by T2 -dipping in 2% edible chitosan and the lowest (1.21 kg cm -2 ) and (1.43 kg cm -2 ) firmness was recorded by T -dipping in 2% edible chitosan coating and T1 -dipping in 1% edible chitosan coating respectively as the days proceeded the firmness of fruits decreased gradually. On 3 rd day among different treatments the highest firmness was observed in T2 -dipping in 2% edible chitosan coating (8.62 kg cm -2 ) followed by T1 -dipping in 1% edible chitosan (8.21 kg cm -2 ) and lowest the firmness was recorded by T3 -dipping in 2% calcium gluconate (7.02 kg cm -2 ) which was on par with T6control (7.03 kg cm -2 ). On 6 th day of storage T2 -dipping in 2% edible chitosan (6.72 kg cm -2 ) recorded the highest firmness which was on par with T1dipping in 1% edible chitosan coating (6.41 kg cm -2 ) and least firmness was recorded by T6 -control (4.81 kg cm -2 ) which was on par with T3 (5.10 kg cm -2 ), T4 (5.10 kg cm -2 ) and T5 (5.19 kg cm -2 ). On 9 th day T2 -dipping in 2% edible chitosan coating (4.90 kg cm -2 ) showed the highest firmness followed by T1dipping in 1% edible chitosan coating (4.52 kg cm -2 ) and T6control (2.41 kg cm -2 ) showed the least firmness followed by T3 -dipping in 2% calcium gluconate (3.44 kg cm -2 ). On 12 th day of storage T2 -dipping in 2% edible chitosan coating (2.71 kg cm -2 ) recorded the highest firmness followed by T1dipping in 1% edible chitosan coating (2.64 kg cm -2 ) and T3dipping in 2% calcium gluconate (1.83 kg cm -2 ) recorded the least firmness. While T6 -control shows end of shelf life. On 15 th day highest firmness was recorded by T2 -dipping in 2% edible chitosan coating (1.43 kg cm -2 ) and lowest was recorded by T1 -dipping in 1% edible chitosan coating (1.21 kg cm -2 ). While T3, T4 and T5 shown end of shelf life.
| Brix acid ratio | — | — | — | — | — | Organoleptic evaluation | — | — | — | — |
|---|---|---|---|---|---|---|---|---|---|---|
| Treatments | 3rd Day | 6th Day | 9th Day | 12th Day | 15th Day | Colour and appearance | Texture | Taste | Flavour | Overall acceptability |
| T1 | 36.87Dd | 63.01Cc | 96.27Bb | 155.63 | 168.15 | 4.10Ab | 3.06Cb | 3.23Dc | 4.23Aa | 3.10Cc |
| T2 | 35.95Ee | 61.02Dd | 95.28Cc | 161.33 | 163.85 | 4.26Aa | 4.03Aa | 4.16Ba | 4.20Aa | 4.23Aa |
| T3 | 50.31Bb | 70.17Aa | 99.36Aa | 108.61 | * | 3.06De | 2.70Dc | 3.20Dc | 3.36Cd | 2.76Dd |
| T4 | 42.31Cc | 52.35Ee | 96.56Dd | 96.95 | * | 3.36Cd | 3.23Bb | 3.63Cb | 3.30Bc | 3.03Cc |
| T5 | 36.60Ff | 43.82Ff | 72.86Ff | 131.0 | * | 3.76Bc | 3.20Bb | 4.23Aa | 3.76Bb | 3.36Bb |
| T6 | 57.40Aa | 65.57Bb | 77.86Ee | * | * | 3.03De | 2.50Dd | 3.20Dc | 2.76De | 2.63Ee |
| S.E.M± | 0.011 | 0.013 | 0.011 | 0.042 | 0.059 | 0.034 | 0.035 | 0.035 | ||
| CD(P=0.05) | 0.035 | 0.039 | 0.034 | 0.128 | 0.180 | 0.106 | 0.107 | 0.108 |
Table text extracted from the original PDF; superscript letters are shown inline. The original table image is below.
View original table image
Gradual decrease in firmness is by gradual degradation of protopectin into pectin by polygalacturonate enzyme. As firmness of fruits is directly proportional to quality of fruits, surface coating of fruits decreases the metabolic activity of fruits which in turn reduces the respiration rate and maintains the firmness of fruits. Fast decrease of firmness was found in mangoes coated with calcium gluconate and 1% chitosan. On other hand, the rate of firmness changes was slower in mango fruits coated with 2% chitosan. This firmness loss is slow in T2 -dipping in 2% edible chitosan coating because of lowest PLW by T2 i.e., (14.35 kg cm -2 ) on 15 th day of storage (table 1). Similar results were found by Zafrul et al. (2020) [28] in mangoes coated with 1% chitosan which were slower which coated with 1.5% and 2% and Prashanth et al., 2022 [18] observed a similar trend in dragon fruit that the highest firmness was observed with fruits treated with chitosan-coated with 4%. Similar results was noted in mango by Baldwin et al. (1999) [4] and table grapes by Romanazzi et al. (2009) [25] .
Browning
The data pertaining to browning of mango treated with edible coatings chitosan and calcium gluconate stored at room temperature is presented in Table 2. Browning score was given based on the scale which ranges from 1-5. Generally browning of fruits increases significantly along with the storage period. Lowest browning of fruits was recorded in T2 -dipping in 2% edible chitosan coating followed by T1dipping in 1% edible chitosan coating from 3 rd to 15 th day and highest browning of fruits was recorded in control till 9 th day after the shelf life of the control fruits ended. On 3 rd day there was no sign of browning recorded in all the treatments. On 6 th day of the storage there was no sign of browning in T2 and T5, whereas least browning was recorded in T1 -dipping in 1% edible chitosan coating (0.63) which was on par with T4 -dipping in 1% edible coating chitosan + 2% calcium gluconate (1.00) and highest browning was recorded in T6 -control (1.40). On 9 th day all treatments started showing signs of browning except T2 -dipping in 2% edible chitosan coating. Among all the treatments least browning was recorded in T4 -dipping in 1% edible coating chitosan + 2% calcium gluconate (2.00) followed by T5 (2.50) and T3 (2.50), whereas highest browning was recorded in T6 -control (3.50). On 12 th day of the storage T2 -dipping in 2% edible chitosan coating (2.80) recorded the least browning followed by T5dipping in 2% edible chitosan coating + 2% calcium gluconate (3.20) and highest browning was recorded by T4 -dipping in 1% edible coating chitosan + 2% calcium gluconate (4.00) followed by T3 -dipping in 2% calcium gluconate (3.90). While T6control fruits shows end of shelf life. On 15 th day least browning was recorded by T2 -dipping in 2% edible chitosan coating (4.26) and lowest was recorded by T1dipping in 1% edible chitosan coating (4.87). While T3, T4 and T5 shows end of shelf life. Least browning was recorded by T2 -dipping in 2% edible chitosan coating because of lowest physiological loss in weight by T2 (14.35%) and highest firmness (1.43 kg cm -2 ) on 15 th day of storage (Table 4.3.1 and 4.3.2). Fruits treated with chitosan show least browning in fruits during storage compared to other treatments (Huaqiang et al., 2004) [13] . Browning of fruits was little more in calcium gluconate coated fruits compared to chitosan, this may be due to chitosan acts a strong barrier between fruit and atmosphere which limits loss of water through evaporation and respiration which delays ripening, therefore fruit deterioration and browning delays (Hesami et al., 2021) [11] .
| Browning | — | — | — | — | Spoilage (%) | — | — | Shelf life (days) |
|---|---|---|---|---|---|---|---|---|
| Treatments | 6th Day | 9th Day | 12th Day | 15th Day | 9th Day | 12th Day | 15th Day | |
| T1 | 0.63Cc | 1.43Dd | 3.70 | 4.87 | 0Cc | 38.26 | 57.39 | 16.91Ab |
| T2 | 0Dd | 0Cc | 2.80 | 4.26 | 0Cc | 0 | 46.98 | 17.41Aa |
| T3 | 0.86Bb | 2.50Bb | 3.90 | * | 0Cc | 53.64 | * | 13.23Ce |
| T4 | 1.00Bb | 2.00Cc | 4.00 | * | 27.66Bb | 56.23 | * | 15.72Bc |
| T5 | 0Dd | 2.50Bb | 3.20 | * | 0Cc | 26.71 | * | 15.22Bd |
| T6 | 1.40Aa | 3.50Aa | * | * | 33.33Aa | * | * | 12.02Df |
| S.E.M± | 0.093 | 0.136 | 0.694 | 0.159 | ||||
| CD(P=0.05) | 0.287 | 0.424 | 2.138 | 0.496 |
Table text extracted from the original PDF; superscript letters are shown inline. The original table image is below.
View original table image
Spoilage per cent of mango fruits treated with edible coatings chitosan and calcium gluconate is presented in the Table 2. Spoilage percent increases throughout the storage period, with no signs of spoilage on 3 rd and 6 th day. On 9 th day of storage least spoilage per cent was recorded by T4 -dipping in 1% edible coating chitosan + 2% calcium gluconate (27.66%) and highest was recorded by T6 -control (33.33%). Whereas there was no symptom of spoilage on all other treatments. On 12 th day T1 -dipping in 1% edible chitosan coating (38.26%) recorded the least spoilage per cent and highest was recorded by T4 -dipping in 1% edible coating chitosan + 2% calcium gluconate (56.23%). While there was no symptom of spoilage in T2, T6 -control shows end of shelf life. On 15 th day least spoilage was recorded by T2 -dipping in 2% edible chitosan coating (46.98%) and highest was recorded by T1 -dipping in 1% edible chitosan coating (57.39%). While T3, T4 and T5 shows end of shelf life. Among all the treatments, fruits treated with chitosan reported least spoilage in storage compared to other treatments as there was no symptom of spoilage until 12 th day storage in fruits treated with chitosan, this may be due to formation of a barrier between atmosphere and fruit surface which reduces respiration rate and methylene synthesis. Present results are in close conformity with results obtained by Hesami et al. (2021) [11] in beer fruits treated with 1% chitosan and stored at 5°C which had no decay symptom until 21 days of storage. Fruits treated with chitosan reported the lowest decay in mangosteen, with increasing concentrations of chitosan there was significant decrease of decay (Efendi and harmawati. 2010) [7] .
The data related to shelf life shown in Table 2 and Fig 1 revealed the effect of edible coatings chitosan and calcium gluconate was found significantly differed among the treatments. Shelf life was significantly different for all the treatments whereas highest shelf life was recorded by T2 -dipping in 2% edible chitosan coating (17.41 days) followed by T1 -dipping in 1% edible chitosan coating (16.91 days) and lowest shelf life was recorded by T6 -control (12.02 days) followed by T3dipping in 2% calcium gluconate (13.23 days). Shelf life defines the period of fruit harvest to fruit rot.
Generally under favourable conditions fruits starts decay and fastens up under the favourable conditions, but chitosan treatment immediately after harvest slows down the transpiration and respiration of fruit which increases fruits shelf life and decreases the fruit rot. Zafrul et al., (2020) [28] revealed that extended shelf life of 10 days was recorded in mangoes coated with 2% chitosan followed by 1.5% with 9.67 days. The increased shelf life was noted in mangoes coated with the high concentration of chitosan and similar results were found by Xing et al. (2011) [26] in jujube fruits and by Hoa et al. (2022) [12] in mango. The synergistic effect of edible coating chitosan and calcium gluconate on total soluble solids is presented in the Table 3 and Fig 2 . Significant difference was found with respect to total soluble solids among all the treatments. It was evident from the data that there was gradual increase of total soluble solids from 3 rd day to 9 th day of storage and then it starts decreasing. On 3 rd day of storage lowest total soluble solids was recorded by T2 -dipping in 2% edible chitosan coating (11.37 0 Brix) which was on par with T5 -dipping in 2% edible chitosan coating + 2% calcium gluconate (11.48 0 Brix) and highest was recorded by T6 -control (12.02 0 Brix) followed by T3 -dipping in 2% calcium gluconate (13.60 0 Brix). On 6 th day T5 -dipping in 2% edible chitosan coating + 2% calcium gluconate (13.51 0 Brix) recorded least total soluble solids and highest was recorded by T6 -control (12.02 0 Brix) followed by T3 -dipping in 2% calcium gluconate (18.57 0 Brix) which was on par with T1 (18.23 0 Brix) and T2 (17.91 0 Brix). On 9 th day of storage lowest total soluble solids was recorded by T2 -dipping in 2% edible chitosan coating (21.13 0 Brix) followed by T1 -dipping in 1% edible chitosan coating (21.78 0 Brix) which was on par with T5 -dipping in 2% edible chitosan coating + 2% calcium gluconate (22.13 0 Brix) and highest total soluble solids was recorded by T6 -control (24.63 0 Brix) which was on par with T3 -dipping in 2% calcium gluconate (24.28 0 Brix). On 12 th day T1 -dipping in 1% edible chitosan coating (24.90 0 Brix) recorded the highest total soluble solids followed by T2 - dipping in 2% edible chitosan coating (24.20 0 Brix) and lowest total soluble solids was recorded by T4 -dipping in 1% edible coating chitosan + 2% calcium gluconate (22.30 0 Brix) followed by T3 -dipping in 2% calcium gluconate (22.81 0 Brix). While T6 -control shows end of shelf life. On 15 th day highest total soluble solids was recorded by T1dipping in 1% edible chitosan coating (21.86 0 Brix) and lowest was recorded by T2 -dipping in 2% edible chitosan coating (21.30 0 Brix). While T3, T4 and T5 shows end of shelf life. There was initial increase of TSS which may be due to the breaking of starch and polysaccharides into sugars and organic acids, later TSS starts declining, this decline may be due to utilization of sugars in evapotranspiration. Fruits treated with high concentration of chitosan have slow increase and decrease in TSS compared to untreated fruits (Gurjar et al., 2018) [10] . Our results were similar with Ali et al. (2011), where untreated and low concentration chitosan coated papaya fruit had significantly higher TSS compared to the fruit with higher concentrations of chitosan. Results of Aleryani et al. (2008) [1] in papaya, Baez-Sanudo et al. (2009) [3] in banana and Khalifa et al. (2016) [14] strawberry were in same conformity with ours results.
| Total soluble solids (0Brix) | — | — | — | — | — | Titrable acidity (%) | — | — | — | — |
|---|---|---|---|---|---|---|---|---|---|---|
| Treatments | 3rd Day | 6th Day | 9th Day | 12th Day | 15th Day | 3rd Day | 6th Day | 9th Day | 12th Day | 15th Day |
| T1 | 11.78Cd | 18.23Cb | 21.78Cc | 24.90 | 21.86 | 0.32 | 0.29 | 0.22Cc | 0.16 | 0.13 |
| T2 | 11.37Cd | 17.91Cc | 21.13Dd | 24.20 | 21.30 | 0.32 | 0.29 | 0.22Cc | 0.15 | 0.13 |
| T3 | 13.60Bb | 18.57Bd | 24.28Aa | 22.81 | * | 0.27 | 0.26 | 0.24Cc | 0.21 | * |
| T4 | 12.99Bc | 16.14Dd | 23.56Bb | 22.30 | * | 0.30 | 0.31 | 0.26Bb | 0.23 | * |
| T5 | 11.48Cd | 13.51Ee | 22.13Cc | 23.58 | * | 0.33 | 0.31 | 0.32Aa | 0.18 | * |
| T6 | 16.43Aa | 19.46Aa | 24.63Aa | * | * | 0.28 | 0.30 | 0.31Ba | * | * |
| S.E.M± | 0.197 | 0.160 | 0.161 | 0.016 | 0.020 | 0.004 | ||||
| CD(P=0.05) | 0.608 | 0.492 | 0.696 | NS | NS | 0.013 |
Table text extracted from the original PDF; superscript letters are shown inline. The original table image is below.
View original table image
The data shown in the Table 3 revealed that effect of edible coating chitosan and calcium gluconates on titrable acidity. Acidity of fruits decreases with the progress in the storage period. There was no significant difference among the treatments on 3 rd and 6 th day, whereas on 9 th day least acidity was recorded by both T1 -dipping in 1% edible chitosan coating (0.22%) and T2 -dipping in 2% edible chitosan coating (0.22%) and highest acidity was recorded by T5 -dipping in 2% edible chitosan coating + 2% calcium gluconate (0.32%) which was on par with T6 -control (0.31%). On 12 th day of the storage least acidity was recorded by T2 -dipping in 2% edible chitosan coating (0.15%) followed by T2 -dipping in 2% edible chitosan coating (0.16%) and highest acidity was recorded by T4dipping in 1% edible coating chitosan + 2% calcium gluconate (0.23%) followed by T3 -dipping in 2% calcium gluconate (0.21%). While T6 -control shows end of shelf life. On 15 th day highest acidity was recorded by both T1 -dipping in 1% edible chitosan coating (0.13%) and T2 -dipping in 2% edible chitosan coating (0.13%). While T3, T4 and T5 shows end of shelf life. Decrease in acidity of fruits may be due to the increase of sugars during ripening. This decrease was limited in surface coated fruits than control. Prashanth et al. (2022) [18] observed that dragon fruits treated with 4% chitosan recorded lower acidity when compared with untreated fruits. During fruit maturity there was higher amount of acidity, but as the fruits proceeds towards ripening, amount of acid will decrease. This decrease in acidity might be due to increase in the total sugar content of the fruits (Pradeep and Manu, 2018) [19] . Similar results with hight concentration of chitosan was recorded by Sinee and Anuvat (2009) [21] in banana.
Brix acid ratio
Effect of edible coating chitosan and calcium gluconate on brix acid ratio I of mango is presented in the Table 4. It is the ratio of TSS and acidity which increased with the storage period. There was significant difference among all the treatments with respect to brix acid ratio. It is evident from the data that there is an increasing trend of brix acid ratio in all the treatments from 3 rd to 15 th day of their storage period. On 3 rd day the of storage brix acid ratio was low in T2 -dipping in 2% edible chitosan coating (35.95) followed by T5 -dipping in 2% edible chitosan coating + 2% calcium gluconate (36.60) and high in T6 -control (57.40) followed by T3 -dipping in 2% calcium gluconate (50.31). On 6 th day T5 -dipping in 2% edible chitosan coating + 2% calcium gluconate (43.82) recorded the lowest brix acid ratio followed by T4 -dipping in 1% edible coating chitosan + 2% calcium gluconate (52.35) and highest was recorded by T3dipping in 2% calcium gluconate (70.17) followed by T6control (57.40). On 9 th day minimum brix acid ratio was recorded by T5dipping in 2% edible chitosan coating + 2% calcium gluconate (72.86) followed by T6 -control (77.86) and maximum brix acid ratio was recorded by T3 -dipping in 2% calcium gluconate (99.36) followed by T4 -dipping in 1% edible coating chitosan + 2% calcium gluconate (96.56) On 12 th day of the storage the least brix acid ratio was recorded by T4 -dipping in 1% edible coating chitosan + 2% calcium gluconate (96.95) followed by T3 -dipping in 2% calcium gluconate (108.61) and the highest acidity was recorded by T2dipping in 2% edible chitosan coating (161.33) followed by T1 - dipping in 1% edible chitosan. While T6 -control shows end of shelf life. On 15 th day least brix acid ratio was recorded by T2 -dipping in 2% edible chitosan coating (163.85) followed by T1 -dipping in 1% edible chitosan coating (168.15). While T3, T4 and T5 shows end of shelf life. Brix acid ratio increases as TSS increases in storage period. This increase was constant initially, but later it showed decreasing trend. Treated fruits showed slow rate of decrease over control fruits Mandal et al. (2018) [16] . Similar results were noted by Mandal et al. (2015) [15] in pineapple.
Organoleptic evaluation
Results of organoleptic evaluation of mango treated with chitosan and calcium gluconate including colour and appearance, texture, taste, flavour and overall acceptability are presented in the Table 4. Organoleptic evaluation was done by at the end of shelf life by a committee of five judges for all the treatments and 1-5 scores were given accordingly. Scores for colour, texture, taste and flavour were given by sensory evaluation whereas over acceptability scores were given by considering all the characters like colour, taste, flavour, texture, aroma etc. There was a significant difference among all the treatments with respect to colour, taste, flavour, texture and overall acceptability. Among all the treatments with respect to organoleptic evaluation T2 -dipping in 2% edible chitosan coating is recorded best score foe colour and appearance, texture, taste, flavour and overall acceptability followed by T1 -dipping in 1% edible chitosan coating and T5 -dipping in 2% edible chitosan coating + 2% calcium gluconate and lowest score was recorded by T6 -control. In case of colour and appearance T2 -dipping in 2% edible chitosan coating (4.26) recorded the highest score followed by T1 -dipping in 1% edible chitosan coating (4.10) and least score was recorded by T6 -control (3.03). T2 -dipping in 2% edible chitosan coating (4.03) recorded the maximum score with respect to texture followed by T4 -dipping in 1% edible coating chitosan + 2% calcium gluconate (3.23) which was on par with T5 (3.20) and T1 (3.06) and minimum score was recorded by T6 -control (2.50). Score of taste was recorded highest in T5 -dipping in 2% edible chitosan coating + 2% calcium gluconate (4.23) which was on par with T2 -dipping in 2% edible chitosan coating (4.16) and lowest score was recorded by T6 -control (3.20) which was on par with T3 -dipping in 2% calcium gluconate (3.20). With respect to flavour highest score was recorded by T1dipping in 1% edible chitosan coating (4.23) followed by T1dipping in 1% edible chitosan coating (4.20) and lowest score was recorded by T6 -control (2.76). T2 -dipping in 2% edible chitosan coating (4.23) recorded the maximum score with respect to overall acceptability followed by T5 -dipping in 2% edible chitosan coating + 2% calcium gluconate (3.36) and minimum score was recorded by T6 -control (2.63). These results are in conformity with the findings of Srinivasa et al. (2002) [22] who reported that mango fruits treated with 1.5% chitosan attained maximum score by the panellists in all tested parameters like colour, taste, texture and flavour even after 5 weeks of cold storage and by Ali et al. (2011) in papaya.
References
27 in the original paper- Aleryani R, Mahmud TMM, Omar SRS, Zaki ARM. Effect of calcium infiltration and chitosan coating on storage life and quality characteristics during storage of papaya (Carica papaya L.). International Journal of Agriculture and Research. 2008;3(4):296-306.
- Ali A, Zahid N, Manickam S, Siddiqui Y, Alderson PG, Maqbool M. Effectiveness of submicron chitosan dispersions in controlling anthracnose and maintaining quality of dragon fruit. Postharvest Biology Technology. 2013;86:147-153.
- Sanudo BM, Cepeda SJ, Rangel MD, Heredia JB. Extending the shelf life of bananas with 1methylcyclopropane and a chitosan-based edible coating. Journal of Science and Food Agriculture. 2009;89(14):23432349.
- Baldwin EA, Burns JK, Kazokas W, Brecht JK, Hagenmaier RD, Bender RJ, Pesis E. Effect of two edible coatings with different permanence characteristics on mango (Mangifera indica L.) ripening during storage. Postharvest Biology and Technology. 1999;17(3):215-226.
- Baviskar MR, Waskar DP, Kaulgud SN. Effect of various post-harvest treatments on shelf life and quality of beer fruits. Indian Journal of Horticulture. 1995;52(1):37-45.
- Butta JG, Moline HE, Spaulding DW, Wang C. Extending storage of fresh-cut apple using natural produce and their derivatives. Journal of Agricultural Food Chemistry. 1999;47:1-6.
- Efendi D, Hermawati H. The use of bee wax, chitosan and BAP to prolong shelf life of Mangosteen (Garcinia mangostana L.) fruit. Journal of Horticulture Indonesia. 2010;1(1).
- Elisha P, Sharma RK, Varma V. Studies on organic acidbased biotech nutrients to enhance soil organic carbon (SOC) and grain yield in Maize (Zea Mays) crop. International Journal of Science Engineering and Advance Technology. 2014;2(10):532-541.
- Fekry OM. Effect of edible coating chitosan and calcium gluconate on maintaining fruit quality and marketability of guava (Psidium guajava) fruits during storage. Middle East Journal of Applied Science. 2018;8(4):1046-1060.
- Gurjar PS, Garg N, Yadav KK, Lenka J, Shukla DK. Effect of chitosan on biochemical and microbial quality of minimally processed mango (Mangifera indica L.) cubes during storage. Indian Journal of Horticulture. 2018;75(1):130-134.
- Hesami A, Setareh K, Rahim K, Saadat S. Effect of chitosan coating and storage temperature on shelf-life and fruit quality of Ziziphus Mauritiana. International Journal of Fruit Science. 2021;21(1):509-518.
- Hoa TT, Ducamp MN, Lebrun M, Baldwin EA. Effect of different coating treatments on the quality of mango fruit. Journal of Food and Quality. 2022;25(6):471-486.
- Huaqiang D, Liangying Cheng, Jiahou T, Kunwang Z, Yueming J. Effects of chitosan coating on quality and shelf life of peeled litchi fruit. Journal of Food Engineering. 2004;64:355-358.
- Khalifa I, Barakat H, El-Mansy HA, Soliman SA. Effect of chitosan-olive oil processing residue coatings on keeping quality of cold storage strawberry (Fragaria ananasa var. Festival). Journal of Food Quality. 2016;39:504-515.
- Mandal D, Lalremruata HTK, Nautiyal BP. Effect of postharvest treatments on quality and shelf life of pineapple (Ananas comosus [L.] Merr. 'Giant Kew') fruits at ambient storage condition. International of Journal of Biology, Resource and Stress Management. 2015;6:490-496.
- Mandal D, Lalrinpuii S, Tridip KH, Amritesh CS. Effect of edible coating on shelf life and quality of local mango cv. Rangkuai of Mizoram. Research on Crops. 2018;19(3):419424.
- Kumar PN, Gouthami B, Joseph B, Reddy RA, Reddy SN, Prathiksha G, et al. Performance of gluconate and lactate based formulations on plant growth and yield attributes in Maize (Zea mays L.). International Journal of Environment and Climate Change. 2022;12(11):676-684.
- Prashanth R, Kumar KA, Rajkumar M, Aparna K. Studies on postharvest quality and shelf life of pink fleshed dragon fruit (Hylocereus spp.) coated with chitosan and stored at ambient temperature. Biological Forum -An International Journal. 2022;14(3):340-347.
- Kumar PV, Manu MM. Effect of preharvest application of different chemicals and plant growth regulators on biochemical parameters of mango (Mangifera indica L.) var. Amrapali. International Journal of Agricultural Sciences. 2018;14(1):92-96.
- Lustriane C, Fenny M, Dwivany, Veinardi S, Reza M. Effect of chitosan and chitosan-nanoparticles on postharvest quality of banana fruits. Journal of Plant Biotechnology. 2018;45:36-44.
- Sinee N, Anuvat J. Effects of edible chitosan coating on quality of fresh-cut mangoes (Falun) during storage. Natural Sciences. 2009;43:282-289.
- Srinivasa PC, Baskaran R, Ramesh MN, Prasanth KVH, Tharanathan RN. Storage studies of mango packed using bio-degradable chitosan film. European Food Research and Technology. 2002;215:504-508.
- Ramma I. Post-harvest Sulphur dioxide fumigation and low acid dip for pericarp color retention and decay prevention on litchi. Revue-Agricole-et-Sucriere-de-l-'Ile-Maurica. 2004;83(2):18-25.
- Romanazzi G, Gabler FM, Margosan D, Mackey BE, Smilanick JL. Effect of chitosan dissolved in different acids on its ability to control postharvest gray mold of table grape. Phytopathology. 2009;99:1028-1036.
- Xing Y, Xu Q, Che Z, Li X, Li W. Effects of chitosan oil coating on blue mold disease and quality attributes of jujube fruits. Food and Function. 2011;2(8):466-474.
- Zafrul H, Niaz Md, Amirul I Md, Hasibur RH Md, Kamrul H. Effect of different concentrations of chitosan on shelf life and quality of mango. Sustainability in Food and Agriculture. 2020;1(1):21-26.
- Zhu X, Wang Q, Cao J, Jiang W. Effect of chitosan coating on post-harvest quality of mango (Mangifera indica L. cv. Training) fruits. Journal of Food Processing and Preservation. 2008;32:770-784.
Cited by 1
From OpenAlex, OpenCitations and reference lists read by Scinovex
- Effectiveness of Chitosan Alone or in Composite Coating Incorporated with Calcium Gluconate and Ascorbic Acid in Prolonging the Shelf Life of Balady Lime Fruit ↗
Ahmed Adnan Mohammed, Omar Thaer Kamil, Hala el-sayed Emam, Wael Mohamed Eldeeb, Ahmed Abdelhady Rashedy · IOP Conference Series Earth and Environmental Science · 2025
Abstract Lime is regarded as one of the most important citrus fruits worldwide, but it has short shelf life. Chitosan (CHT), calcium gluconate (Ca-Glu) and ascorbic acid (ASC) may be maintain fruit quality during cold storage. So, the aim of this study was to evaluate the efficiency of CHT alone or in composite coating with Ca-Glu (0.2 or 0.4%) and…
❝ 3PDF