
Research article · 2023 · Full text
International Journal of Biology SciencesSemi-quantitative analysis of nucleic acids on agarose gels with choice of beverages as electrophoretic buffer
Volume 5(1) · Pages 53–55 · DOI: 10.33545/26649926.2023.v5.i1a.179 ↗
Research areasBiopolymer Synthesis and Applications
Abstract
Author-writtenThe pH of beverages is known to be low, and has therefore been involved in the increasing acidity incidence. In this study, to report on a rapid and cost-effective approach for nucleic acid characterization using different running buffers for agarose gel electrophoresis. Commercial DNA is used in electrophoretic analysis using a variety of beverages by optimizing its pH value. The results suggest that Royal Stag has little effect on nucleic acid research, while Peter Scot shows high concentration and sensitivity in nucleic acid characterization. Royal Stag drink has revealed that concentration, time, and voltage have little effect on nucleic acid research, although Peter Scot has reported high concentration and sensitivity in nucleic acid characterization. We conclude that this approach is simple, easy, and cost-effective compared to using TAE or TBE as running buffers in electrophoresis of the agarose gel.
Summary
Source-checkedPlain-language reading of the full paper, prepared with AI and checked against the text. Each point links to the authors' own words.
Why it matters
- Agarose gel electrophoresis is a common laboratory method used to separate DNA fragments according to their size. View evidence ↗
- The effectiveness of this technique depends on the properties of the electrophoresis buffer, including its composition, ion strength, and pH. View evidence ↗
- Beverages are known to have low pH levels, which contributes to increased acidity. View evidence ↗
The question
- The study aims to identify a fast and inexpensive method for characterizing nucleic acids by testing various beverages as running buffers for agarose gel electrophoresis. View evidence ↗
What they did
- The researchers selected several beverages from a local market in Vijayawada, India, including Antiquity, Royal Stag, Sprite, Peter Scot, and Bagpiper. View evidence ↗
- Ten milliliters of each beverage were tested for pH and then adjusted to a target pH of 8.3 using 1M HCl or NaOH. View evidence ↗
- The experiment used one microgram of commercial Salmon sperm DNA (SRL) as the loading sample, combined with a tracking dye. View evidence ↗
- Fifteen microliters of commercial DNA were loaded into each well, and electrophoresis was conducted at 50 volts for one hour. View evidence ↗
- The study used TAE buffer as a positive control and neutral pH water as a negative control for the running buffer. View evidence ↗
What they found
- The initial pH of the beverages varied, with Antiquity being the most acidic (2.44) and Royal Stag being the least acidic (4.89) among the tested drinks. View evidence ↗
- As expected, the negative control (water) showed no bands, while the positive control (TAE buffer) produced high-density bands. View evidence ↗
- Among the beverages, Peter Scot showed the highest integrated density (623,466) and area (3,674), while Antiquity showed a lower integrated density (168,869) and area (1,056). View evidence ↗
- Peter Scot exhibited a higher integrated density (623,466) and area (3,674) compared to the standard TAE buffer, which had an integrated density of 389,126.000 and an area of 2,700. View evidence ↗
What it means
- The authors conclude that using beverages as running buffers is a simple, easy, and cost-effective alternative to using standard TAE or TBE buffers. View evidence ↗
- The researchers found that Peter Scot provided higher precision and sensitivity for nucleic acid characterization than the other tested beverages. View evidence ↗
- The authors state that the method is limited in scope and may not be suitable for every type of nucleic acid characterization experiment. View evidence ↗
- The authors suggest that future research should investigate the use of this method for analyzing RNA. View evidence ↗
Visual summary
2 visualsIllustrations explain the paper; charts are replotted from the paper's own table values.
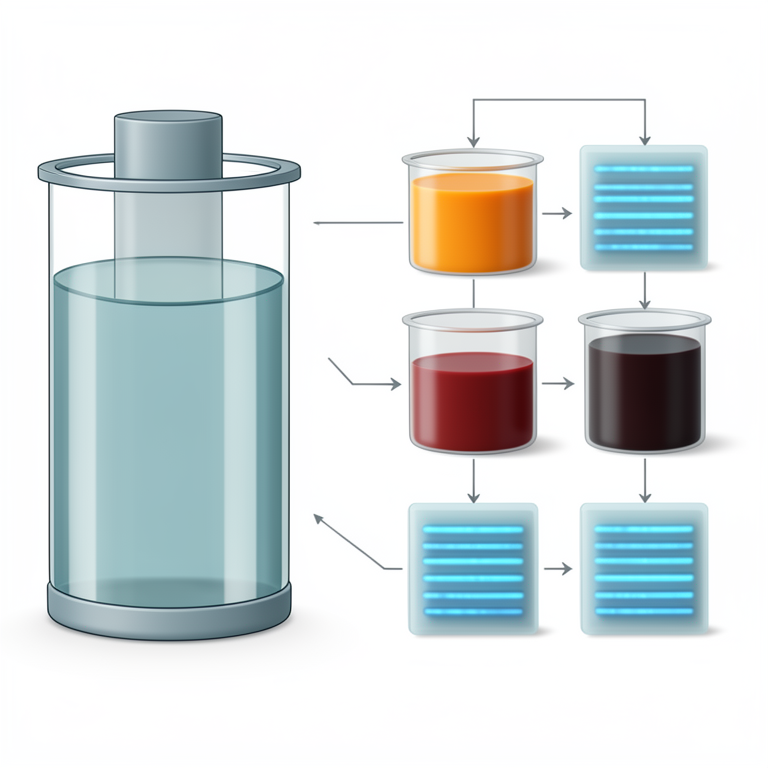
Conceptual Comparison of Buffers
AI-generated conceptual illustration (agarose gel electrophoresis setup with DNA samples and various beverage liquids). It explains the idea and does not show study data.
View source evidence ↗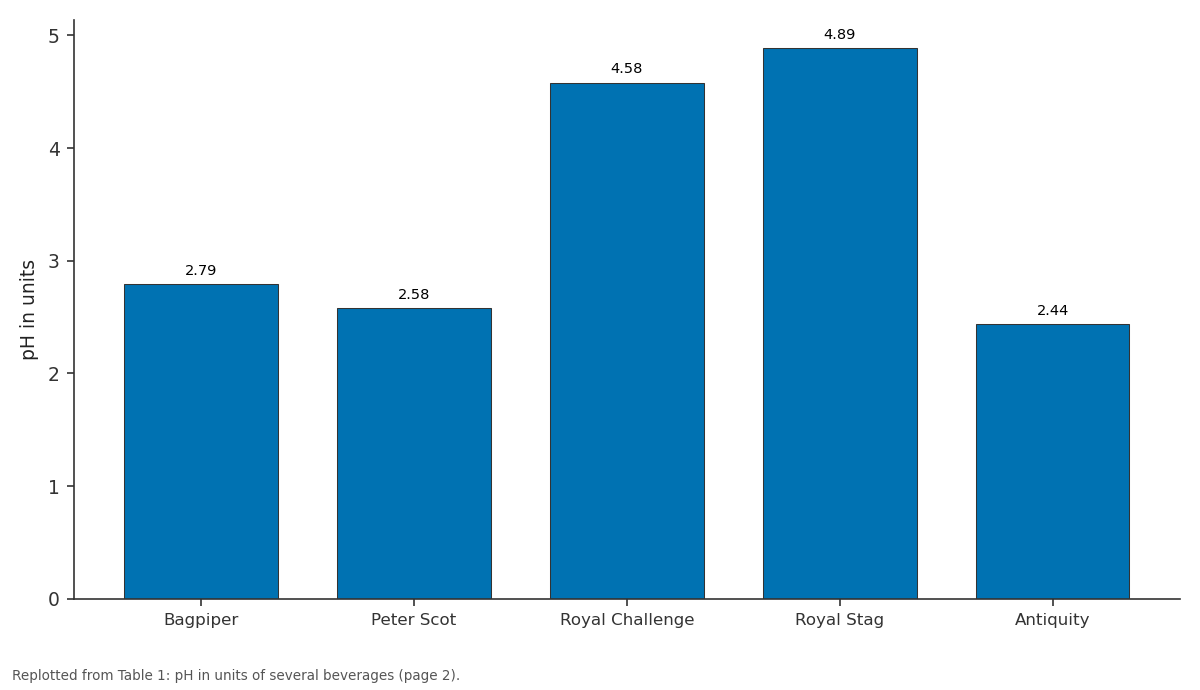
pH in units: Bagpiper vs Peter Scot vs Royal Challenge vs Royal Stag vs Antiquity
Replotted from Table 1 (page 2) of the original paper. Every bar is the paper's own table value.
View source evidence ↗Figures & tables
From the original paper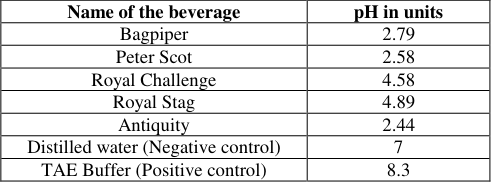 Table 1
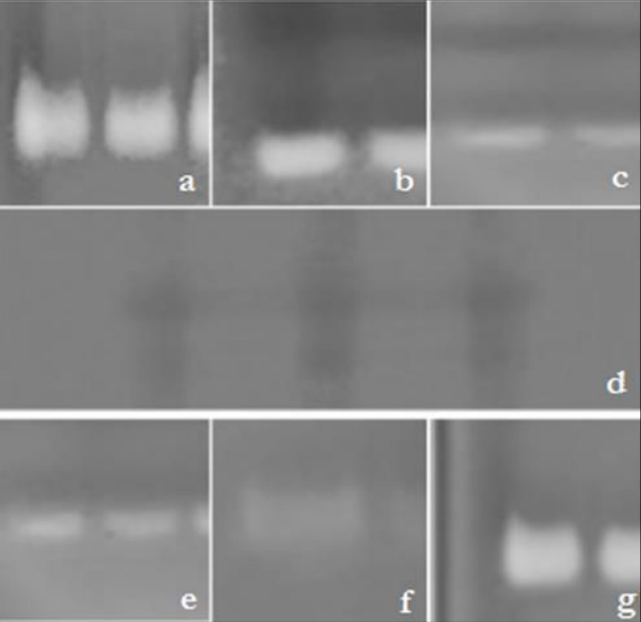 Figure 1
 Table 2
Introduction
Agarose gel electrophoresis is a widely used technique for separating DNA fragments based on their size. The gel matrix is made of agarose, a linear polysaccharide derived from seaweed, which has a high gel strength that allows for the handling of low percentage gels suitable for separating large DNA fragments [1] . The size of the pores formed by the agarose bundles in the gel matrix is determined by molecular sieving, meaning that smaller DNA fragments can pass through the pores more easily than larger fragments. The performance of agarose gel electrophoresis is influenced by the properties of the electrophoresis buffer, such as pH, ion strength, and composition [2] . The choice of buffer can affect the migration of DNA fragments, and researchers often experiment with different buffer systems to optimize their results. Positive polarity buffer systems typically work over the entire pH spectrum, whereas negative net-charge nucleic acids are delayed on the gel surface in buffer systems with negative polarity [3][4][5] . New methods have been developed to improve the resolution of agarose gel electrophoresis [6] . Multiple gradient-slab gel electrophoresis involves embedding several agarose gels with different concentrations within a single gel slab, allowing for more precise separation of DNA fragments. However, difficulties in using organic solvents with low buffer capacity can require buffer adjustments or the use of a buffer recirculation system [7] . Overall, agarose gel electrophoresis remains a widely used and versatile technique in biological sciences research [8] . With continued experimentation and development of new methods, it is likely to remain an important tool in molecular biology [9] .
Materials and Methods
Materials and Methods
Determination of pH in alcoholic beverages
Various drinks, including Bagpiper, Peter Scot, Sprite, Royal Stag, and Antiquity, were chosen from local market of Vijayawada, Andhra Pradesh, India, Ten millilitres of each sample were tested for initial pH and adjusted to typically a pH of 8.3 using either 1M NaOH or HCl.
Using milliQ water or double-distilled water, the buffer was diluted to a concentration of 100 times, then stored at 40 °C until needed [10] .
Agarose gel electrophoresis
Genie's small mini-subcell (10 x 12 cm) was used for electrophoresis of the agarose gel and used beverages as a running buffer to classify nucleic acids. One microgram of commercial DNA (Salmon sperm DNA, SRL) is used as a loading sample along with a tracking dye. Beverages as buffers were measured using a DC-300 power supply (Genei Apparatus) with length, voltage, current, and power of 300 ml. Fifteen microliters of samples were prepared, and a CCD camera (UVI-Tech, Germany) stained gel with ethidium bromide for UV photography [11] .
Quantification of gel band
Image 1.38 (http:/rsb.info.nih.gov/nih-image/) is used as a method to measure the agarose gel band strength for the analysis of gel photos. The gel is coated with ethidium bromide and tested for UV-trans illuminator band validation. Gels were put in a gel doc (UVI-Tech, Germany) and photographed. Image is used for measuring the density profile, peak height, and peak intensity or band volume of the expected molecular weight [12] .
Results and Discussion Determination of pH in beverages
Beverages are the most acidic according to American Dental Association. In fact, their acid content is in the same range as vinegar. Initial pH of all selected beverages was determined using pH meter (EuTech, Germany) after the pH sensor is calibrated as listed in Table 1. Experiment was carried out for three times to obtain more accurate results.
| Name of the beverage | pH in units |
|---|---|
| Bagpiper | 2.79 |
| Peter Scot | 2.58 |
| Royal Challenge | 4.58 |
| Royal Stag | 4.89 |
| Antiquity | 2.44 |
| Distilled water (Negative control) | 7 |
| TAE Buffer (Positive control) | 8.3 |
Table text extracted from the original PDF; superscript letters are shown inline. The original table image is below.
View original table image
Agarose gel electrophoresis
Commercial DNA of 15 ul was loaded in each well, and electrophoresis was performed at 50 volts for one hour at 50 volts. Each band contains a large quantity of DNA fragments of the same size, all of which have travelled to the same position as a group. Gel is stained with a DNAbinding dye and placed under UV light, allowing us to see the DNA present at various positions along the length of the gel. Water at neutral pH as a negative control of the reaction is used as a running buffer, while TAE buffer as a positive control. No bands were observed with water as a choice and high-density bands were observed with TAE buffer as shown in Figure 1.
Quantification of gel band
The analysis of the ECL image was performed using the public domain Image J program (developed at the National Institutes of Health and available at using the "Measure" function. http:/rsb.info.nih.gov/ij/). The results of the analysis are a value for each band that is proportional to the Integrated Density Value (IDV) of the band. All photographs have been handled in a way that prevents the loss of information as shown in Table 2.
| S. No | Label | Area | X | Y | Major | Minor | Int. Den |
|---|---|---|---|---|---|---|---|
| 1 | Bagpiper | 1548 | 81.500 | 27 | 145.561 | 13.541 | 266249 |
| 2 | Peter Scot | 3674 | 89.500 | 35 | 188.439 | 24.824 | 623466 |
| 3 | Royal Challenge | 1572 | 79.500 | 28 | 147.818 | 13.541 | 273148 |
| 4 | Red bull | 1449 | 84.500 | 25.500 | 181.669 | 10.155 | 227615 |
| 5 | Antiquity | 1056 | 93 | 29 | 198.595 | 6.770 | 168869 |
| 6 | Water | 380 | 30 | 33 | 42.878 | 11.284 | 64145 |
| 7 | TAE | 2700 | 95 | 19.500 | 203.108 | 16.926 | 389126.000 |
Table text extracted from the original PDF; superscript letters are shown inline. The original table image is below.
View original table image
Conclusion
This study suggests that the method described is not intended to replace TAE buffer, but rather to serve as a preliminary indicator of possible trends in the choice of beverages for nucleic acid characterization using agarose gel electrophoresis. The study found that Peter Scot had high precision and sensitivity compared to other beverages tested, including Bagpiper, Royal Challenge, Antiquity, and Royal Stag. However, the results may vary if more beverages were included in the study. The study also suggests that further studies could be carried out to analyze RNA as genetic material using gel electrophoresis. However, it is important to note that the method described in this study is limited in scope and may not be appropriate for all nucleic acid characterization experiments. The choice of running buffer and other experimental conditions should be carefully considered based on the specific research question and sample being analyzed. Nonetheless, the study provides some preliminary insights into the potential use of alternative running buffers for agarose gel electrophoresis in nucleic acid characterization.
References
12 in the original paper- Huang Q, Baum L, Fu WL. Simple and practical staining of DNA with Gel Red in agarose gel electrophoresis. Clinical Laboratory Journal For Clinical Laboratories and Laboratories Related. 2010 Jan 1;56(3):149.
- Vemuri PK, Talluri B, Sharma A, Akkala G, Bodiga VL. Isolation and Characterization of a LactoseBinding Lectin from Ocimum sanctum. Journal of Applied Pharmaceutical Science. 2015 Oct 28;5(10):113-117.
- Calladine CR, Collis CM, Drew HR, Mott MR. A study of electrophoretic mobility of DNA in agarose and polyacrylamide gels. Journal of molecular biology. 1991;221(3):981-1005.
- Vemuri PK, Talluri B, Panangipalli G, Kadiyala SK, Veeravalli S, Bodiga VL. Purification and Identification of 20kDa protein from Parthenium hysterophorus. International Journal of Pharmacy and Pharmacognosy Research. 2016;8(5):827-830.
- Tiselius A. Electrophoresis of serum globulin. I. Biochemical Journal. 1937;31(2):313-316.
- Rodbard D, Chrambach A. Estimation of molecular radius, free mobility, and valence using polyacrylamide gel electrophoresis. Analytical Biochemistry. 1971 Mar 1;40(1):95-134.
- Fischer SG, Lerman LS. Length-independent separation of DNA restriction fragments in two-dimensional gel electrophoresis. Cell. 1979 Jan 1;16(1):191-200.
- Theodoridis GA, Papadoyannis IN. Novel advanced approaches in sample preparation and analyte detection for bioanalysis. Current Pharmaceutical Analysis. 2006 Nov 1;2(4):385-404.
- Kumar VP, Prasanthi S, Reddy AC, Raj ND, Anudeep L. Characterization studies of thermos table alkaline phosphatase from various plant seeds. Journal of Applied Biosciences. 2010;36:2403-2408.
- Kumar Vemuri P, Veeravalli S. Expression, purification and characterization of human recombinant galectin 3 in Pichia pastoris. Iranian Journal of Biotechnology. 2014 Apr 1;12(2):3-8.
- Schneider CA, Rasband WS, Eliceiri KW. NIH Image to Image J: 25 years of image analysis. Nature Methods. 2012;9(7):671.
- Heidebrecht F, Heidebrecht A, Schulz I, Behrens SE, Bader A. Improved semi-quantitative Western blot technique with increased quantification range. Journal of Immunological Methods. 2009 Jan 30;345(1-2):4048.