
Research article · 2024 · Full text
International Journal of Advanced Biochemistry ResearchStudy of stocking density on the carcass quality parameters of broiler chicken
Volume 8(1S) · Pages 543–546 · DOI: 10.33545/26174693.2024.v8.i1sh.394 ↗
Research areasAnimal Nutrition and PhysiologyLivestock and Poultry ManagementAgricultural Practices and Plant Genetics
Abstract
Author-writtenThe study was conducted on 6 weeks age broilers at poultry unit of Livestock farm complex, College of Veterinary and Animal Science, Navania, Udaipur. The Significant effect (p≤0.05) of stocking densities on carcass traits viz., neck, back, dressing and drumstick percentage were observed. High estmean value of neck percentages were observed in D1 followed by D2 and D3 treatment groups respectively. Back weight percentage was also influenced by (p≤0.05) stocking densities and high estmean value was observed in D2 followed by D3) and D1. There was a highly (p≤0.01) significant impact of dressing percentage among all the three stocking densities. Birds reared at D2 control group stocking, density recorded the highest dressing percentage followed by D1 and D3 group respectively. Like wise significant (p≤0.05) influence of stocking density was observed on drumstick percentages. The highest percentage was found in D2 followed by D3 and lowest in D3 group respectively. However non-significant difference in thigh percentage between birds reared at D1, D2 and D3 stocking densities. Birds reared at the stocking densities of 8, 10 and 12 birds /m2did not differ in breast weight percentages, but had numerically higher value in D3 and D2 group followed by D1. Wing weight percentages was numerically higher in D2 followed by D1 and D3 though statistically insignificant. Gizzard, liver and heart (giblet) percentages were highly and significant (p≤0.01) influenced by stocking density, the high estmean gizzard weight percentages was observed in birds reared at D3 followed by control group D2 and D1 group densities. Whereas liver weight percentage was higher in D2 group followed by D3 and D1 respectively. However, in the present study, stocking density had no impact on the percentage of heart but the numerically higher value was seen in D3 group followed by D2 and D1 stocking densities.
Summary
Source-checkedPlain-language reading of the full paper, prepared with AI and checked against the text. Each point links to the authors' own words.
Why it matters
- Poultry is a critical global source of animal protein and is the second most consumed meat worldwide, representing approximately 30% of global meat production. View evidence ↗
- The profitability of broiler production depends on the ability to maximize body weight gain in the shortest possible time. View evidence ↗
- The density of birds in a given space (stocking density) significantly influences the yield of the carcass and the quality of the meat. View evidence ↗
The question
- The study aimed to investigate how different stocking densities affect various carcass quality parameters in broiler chickens. View evidence ↗
What they did
- The experiment used 120 day-old broiler chicks sourced from a commercial hatchery in Ajmer, Rajasthan. View evidence ↗
- Birds were randomly assigned to three stocking density groups for six weeks: D1 (8 birds/m²), D2 (10 birds/m², the control), and D3 (12 birds/m²), with four replications of eight chicks each. View evidence ↗
- Carcass quality was measured by weighing specific parts (neck, breast, back, wings, thighs, drumstick, and giblets) and calculating them as a percentage of the bird's live body weight. View evidence ↗
- Data were analyzed using one-way ANOVA and Duncan's Multiple Range Test, with a p-value of less than 0.05 considered statistically significant. View evidence ↗
What they found
- Neck percentage was significantly higher in the lowest density group D1 (5.65%) compared to the control D2 (4.70%) and high density D3 (4.67%). View evidence ↗
- The highest back weight percentage was found in the control group D2 (15.27%), followed by D3 (14.97%) and D1 (14.60%). View evidence ↗
- Dressing percentage was highest in the control group D2, followed by D1 (80.60%) and D2 (77.52%), with the lowest percentage in the high-density D3 group (75.60%). View evidence ↗
- Drumstick percentage was highest in the control group D2 (4.85%) and lowest in the D1 group (4.02%). View evidence ↗
- Gizzard weight percentage increased with stocking density, being highest in D3 (1.31%), followed by D2 (1.21%) and D1 (1.04%). View evidence ↗
- Liver weight percentage was highest in the control group D2 (1.83%), followed by D3 (1.73%) and D1 (1.65%). View evidence ↗
- There was no statistically significant difference in thigh weight percentages across the three stocking densities (D1: 6.40%, D2: 6.37%, D3: 6.10%). View evidence ↗
- Stocking density had no significant impact on the percentage of the heart. View evidence ↗
What it means
- The authors recommend that poultry farmers utilize low stocking densities to ensure profitability, especially when rearing birds for more than 40 days. View evidence ↗
Visual summary
3 visualsIllustrations explain the paper; charts are replotted from the paper's own table values.
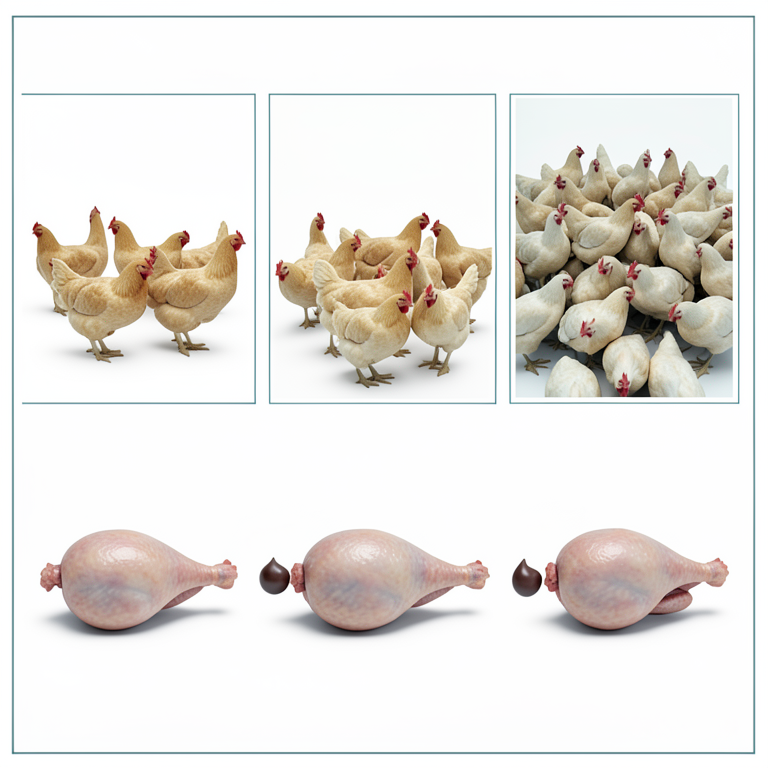
Impact of Stocking Density on Broiler Yield
AI-generated conceptual illustration (broiler chickens). It explains the idea and does not show study data.
View source evidence ↗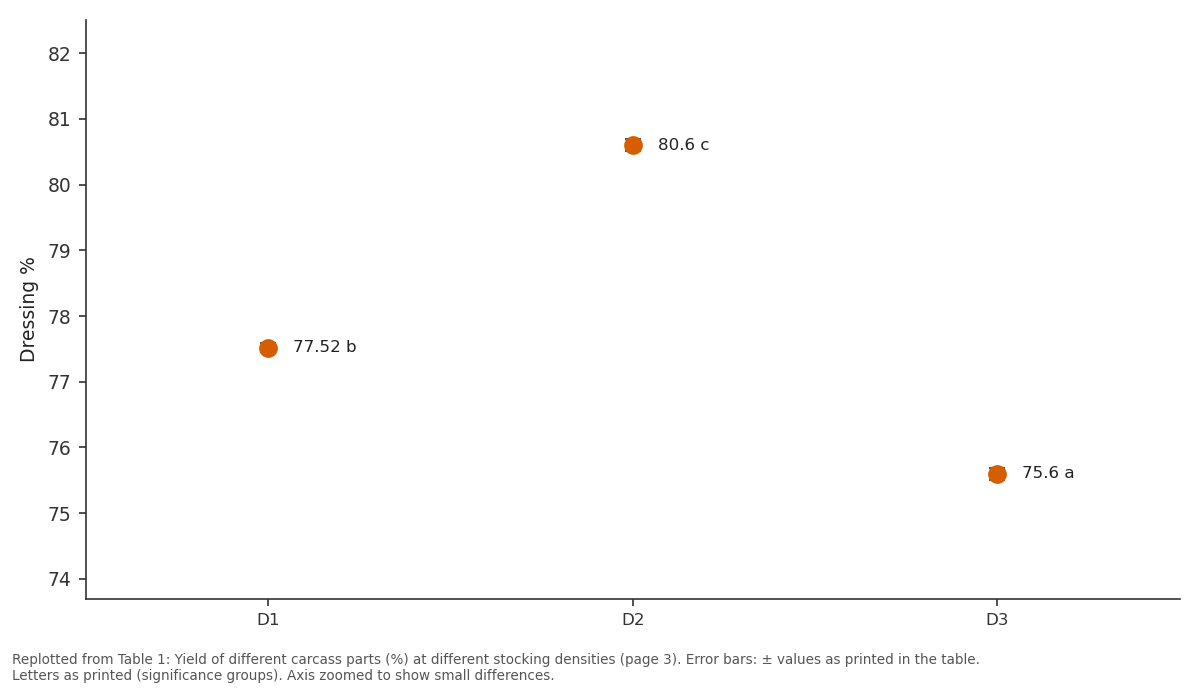
Dressing %: D1 vs D2 vs D3
Replotted from Table 1 (page 3) of the original paper. Every bar is the paper's own table value.
View source evidence ↗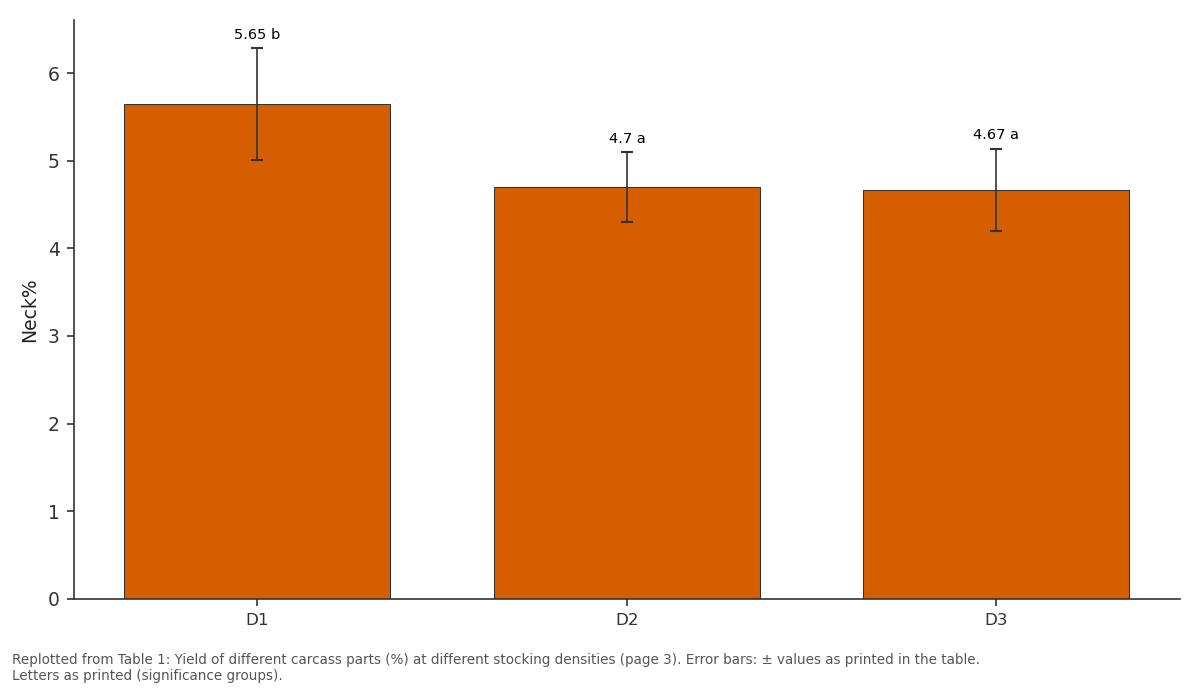
Neck%: D1 vs D2 vs D3
Replotted from Table 1 (page 3) of the original paper. Every bar is the paper's own table value.
View source evidence ↗Figures & tables
From the original paper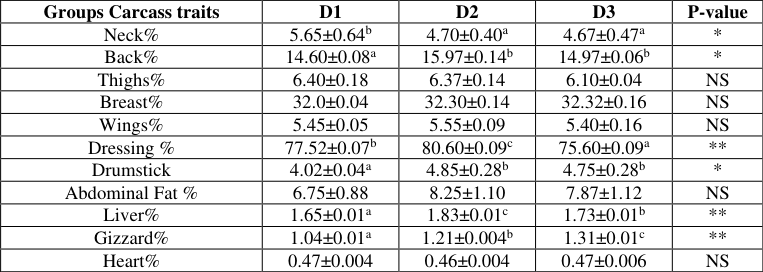 Table 1
Introduction
Poultry all over the world serve as a good source of an animal protein to most people throughout the world. Poultry is the second most widely eaten meat in the world, accounting for about 30% of meat production World Wide after pork at 38% (FAO, 2019) [3] . As per the 20 th Livestock census (2019) [7] total Poultry population in India is 851.81 million that has been increased by 16.81% than previous census. Over 45.78% increase in backyard Poultry and total backyard Poultry is 317.07 million in 2019.The total commercial Poultry is 534.74 million which has increased by 4.5%. Among the livestock sector Poultry industry contributes about 1% of national GDP and about14% of the livestock GDP (Mishra, 2020) [10] . With increasing demand for chicken egg and meat. The Poultry generation in India predicts further extension and industrialization. With the coming information in various fields of Poultry, the future difficulties won't be an obstacle and consequently observes a splendid future for Poultry production in India. The benefit in broiler production relies upon how rapidly broilers can be grown to accomplish greatest put on in body weight in least period. Therefore there is a need to produce greater quality meat and eggs in a most brief conceivable time and at the conceivable minimal effort. Providing optimum floor space, feeding and watering and space for the normal movement of birds are ideal facilities for better production. Stocking density has a marked effect on meat quality and carcass yield. As mea yield per unit of space increases with increasing density, increasing the stocking density within these systems would allow for a significant increase in economic return, even taking into account the extra feed costs incurred by rearing additional birds. [4,8] .
Materials and Methods
The experiment was conducted at Poultry Farm of Livestock Farm Complex, College of Veterinary and Animal Science, Navania, Vallabhnagar, Udaipur (Rajasthan University of Veterinary and Animal Sciences, Bikaner). One hundred and twenty (120) day old broiler chicks from a commercial hatchery in Ajmer, Rajasthan, were used for the study. In the brooding process, heat and light were provided by electrical hover brooders. The period of brooding lasted for 2 weeks. A total of 120 birds were randomly assigned to three stocking densities up to six weeks of age. Stocking densities were considered experimental design treatments. Four replications were assigned to each treatment and every replication was allocated to eight chicks D1 (8 birds/m2), D2 (10 birds/m2) which served as control, D3 (12 birds/m2). Both sexes were reared together on deep litter floor. The experimental pens, drinkers, and feeding troughs were cleaned, disinfected, and sprayed against external parasites before the commencement of experiment. During the entire experimental period, all experimental chicks were handled identically and strict hygienic measures were taken as per standard practice. On the 4th and 14th days, broiler chicks were vaccinated against Ranikhet disease (F1 strain) and Infectious Bursal Disease.
Carcass traits
After completion of experiment, two birds from each group were randomly selected, fasted for 12 hours to empty their crops and sacrificed for carcass characteristics following Halal method (Singhand Sharma, 2003) [12] . Before slaughtering body weights of the individual birds were taken carefully to obtain dressing percentage. The weights of the different carcass parts viz., neck, breast, back, wings, thighs, drumstick and giblet (heart, liver gizzard) were taken, which was later expressed as percentage of the live body weight.
Dressing yield of a bird Live weight of the bird × 100 (Magala et al., 2012) [9] .
Fresh weight of cut part or organ Final live body weight of bird × 100
Data on Carcass traits were entered into M.S. Excel and analyzed with SPSS software Version 22.0 (SPSS, 2015) [13] .
A statistical technique of one-way ANOVA was used to compare means and if the probability value was less than 0.05, the difference was pronounced statistically significant. Duncan's Multiple Range Test was used to distinguish significant (p<0.05) differences across variables (Steel et al. 1997) [14] .
Results and Discussion
Results and Discussion
Carcass traits:
The results for carcass traits are summarized in Table-1.
Neck percentage
Significant effect (P<0.05) of stocking densities on neck, back, dressing and drum stick percentages were observed.
There was a progressive reduction in neck percentage with increasing stocking density which was found to be significant. In lowest group D1 (5.65) percentages was higher followed by control group D2 (4.70) and D3 (4.67).
The findings corroborated with the Beg et al. (2011) [2] , Kumar et al. (2017) [6] and Madilindi et al. (2018) [8] who found significant effect of stocking density on neck percentages.
Back weight percentage
Back weight percentage was also influenced by (P<0.05) stocking densities and highest mean value was observed in control group D2 (15.27) followed by D3 (14.97) andD1 (14.60). The findings corroborated with the Beg et al.
(2011) [2] , Kumar et al. (2017) [6] and Madilindi et al. (2018) [8] who found significant effect of stocking density on back weight percentages.
Dressing percentage
Birds reared at D2 control group stocking density recorded the highest dressing percentage followed by D1 (80.60) than D2 (77.52) group, while those raised at D3 had the lowest (75.60). Highly (p<0.01) significant impact of stocking density was found on dressing percentage of chicken. The findings corroborated with the Beg et al. (2011) [2] , Kumar et al. ( 2017) [6] and Madilindi et al. (2018) [8] who found significant effect of stocking density on dressing, percentages.
Drum stick percentages
Like wise significant (P<0.05) influence of stocking density was observed on drum stick percentages. The highest percentage was found in control group D2 (4.85) followed by D3 (4.75) and owestin D3group (4.02) respectively. The findings corroborated with the Beg et al. (2011) [2] , Kumar et al. ( 2017) [6] and Madilindi et al. (2018) [8] who found significant effect of stocking density on drumstick percentages.
Giblet percentages
Gizzardand liver (giblet) percentages were highly and significantly (p<0.01) influenced by stocking density, the highest mean gizzard weight percentages was observed in birds reared at D3 (1.31) followed by control group D2 (1.21) and D1 group (1.04) densities (Table -1). Whereas liver weight percentage was higher in control group D2 (1.83) group followed by control groupD2 (1.73) and D1 (1.65) respectively. However, stocking density had no impact on the percentage of heart. The numerically higher value was seen in D3 (0.475) group followed by control group D2 (0.472) and D1(0.46) stocking densities. This is probably due to overcrowding, which allows birds to eat feed rapidly at high stocking densities. As a result, the gizzard grows larger or expands more quickly in order to grind larger amounts of food.
Thigh, breast and wing weight percentage
There was non-significant difference in thigh percentage between birds reared at D1 (6.40), control group D2 (6.37) and D3 (6.10) stocking densities; however, lower and intermediate group had higher percentages than those reared at the highest density. Birds reared at the stocking densities of 8, 10 and 12 birds /m2did not differ in breast weight percentages, but had numerically higher value in D3 (32.32) and D2(32.30) control group followed by D1(32.0). Wing weight percentages was numerically higher in control group D2 (5.55) followed by D1 (5.45) and D3 (5.40) though statistically insignificant. These differences could be attributed too their factor such as season in which the birds were reared, genotypes and feeding regime. The results are inagreement with the observations of Jiang et al., 2014 [5] , Adeyemo et al., 2016 [1] and Rambau et al., 2016 [11] , reported that stocking density had no significant impact on carcass traits. The lower to intermediate stocking densities (8 and 10 birds/m 2 ) resulted in significantly higher percentages of neck, back, dressing and drumstick for birds, while the higher stocking density (12birds/m2) resulted in significantly lower carcass percentage.
Conclusion
The present findings on carcass cut up parts revealed that intermediate to lower stocking densities and resulted in significantly higher percentages of neck, back, dressing and drumstick for birds, while the higher stocking density resulted insignificantly lower carcass percentage. It was concluded that at intermediate to lower stocking density more carcass yield was obtained than highe stocking density. The present study concluded that direct and proportionate correlation of increasing density with decreasing profit in all aspects of profit calculation which may strongly lead to the conclusion that 8birds/m2 followed by10 birds/m2 (lower to intermediate) stocking density is the most ideal in all aspects of broiler production. Based on the a fore mentioned findings of this study, it can be concluded that higher live body weight at lesser space increases the profitability. Poultry farmers should choose a low stocking density when it comes to profitable rearing and keeping birds for more than 40 days.
Acknowledgments
The authors acknowledge the financial support by college of veterinary and animal science, Navania, Udaipur.
Conflict of interest
There is no any conflict of interest.
Figures and tables from the paper
| Groups Carcass traits | D1 | D2 | D3 | P-value |
|---|---|---|---|---|
| Neck% | 5.65±0.64b | 4.70±0.40a | 4.67±0.47a | * |
| Back% | 14.60±0.08a | 15.97±0.14b | 14.97±0.06b | * |
| Thighs% | 6.40±0.18 | 6.37±0.14 | 6.10±0.04 | NS |
| Breast% | 32.0±0.04 | 32.30±0.14 | 32.32±0.16 | NS |
| Wings% | 5.45±0.05 | 5.55±0.09 | 5.40±0.16 | NS |
| Dressing % | 77.52±0.07b | 80.60±0.09c | 75.60±0.09a | ** |
| Drumstick | 4.02±0.04a | 4.85±0.28b | 4.75±0.28b | * |
| Abdominal Fat % | 6.75±0.88 | 8.25±1.10 | 7.87±1.12 | NS |
| Liver% | 1.65±0.01a | 1.83±0.01c | 1.73±0.01b | ** |
| Gizzard% | 1.04±0.01a | 1.21±0.004b | 1.31±0.01c | ** |
| Heart% | 0.47±0.004 | 0.46±0.004 | 0.47±0.006 | NS |
Table text extracted from the original PDF; superscript letters are shown inline. The original table image is below.
View original table image
References
12 in the original paper- Adeyemo GO, Fashola OO, Ademulegun TI. Effect of stocking density on the performance, carcass yield, and meat composition of broiler chickens. Biotechnol J Int. 2016;14(1):1-7.
- Beg MAH, Baqui MA, Sarker NR, Hossain MM. Effect of stocking density and feeding regime on the performance of broiler chicken in the summer season. Int. J Poult. Sci. 2011;10(5):365-375.
- Habibu B, Ikira NM, Buhari HU, Aluwong T, Kawu MU, Yaqub LS, et al. Effect of molasses supplementation on live weight gain, hematologic parameters, and erythrocyte osmotic fragility of broiler chickens in the hot-dry season. Int. J Vet Sci. 2014;3(4):181-188.
- Jiang Y, Xie M, Tang J, Wen ZG, Huang W, Hou SS. Effects of stocking density on growth performance, carcass traits, and foot pad lesions of White Pekin ducks. Poult Sci. 2014;93(7):1644-1648.
- Kumar F, Mir NA, Rafiq A, Singh V, Shukla V. Determinants of broiler chicken meat quality and factors affecting them: a review. J Food Sci. Tech. 2017;54(10):2997-3009.
- Livestock Census Rajasthan 2020. 20 th Livestock Census of Rajasthan. Available at: https://www.rajras.in/index.php/20th-livestock-censusof-rajasthan/. Data retrieved on 23.09.2020.
- Madilindi MA, Mokobane A, Letwaba PB, Tshilate TS, Banga CB, Rambau MD, et al. Effects of sex and stocking density on the performance of broiler chickens in a sub-tropical environment. S Afr. J Anim. Sci. 2018;48(3):459-468.
- Magala H, Kugonza DR, Kwizera H, Kyarisiima CC. Influence of management system on growth and carcass characteristics of Ugandan local chickens. J Anim. Sci. 2012; (2):558-567.
- Mishra AK. Poultry industry in India. 2020. Available at: https://baliyans.com/daily-current-affairs//poultryeditorialindustry-in-india. Data retrieved on 23.09.2020.
- Rambau MD, Mudau ML, Makhanya SD, Benyi K. Effects of stocking density and daily feed withdrawal periods on the performance of broiler chickens in a semi-arid environment. Trop Anim Health Prod. 2016;48(8):1547-1554.
- Singh G, Sharma ML. Effect of stocking density on the performance of commercial broilers. Annals Appl Bio. 2003;19:255-258.
- SPSS. Statistical package for social science. SPSS for windows (version 22.0). SPSS Inc. Chicago, USA. 2015.
Cited by 1
From OpenAlex, OpenCitations and reference lists read by Scinovex
- The effects of varying stocking densities during the first 10 days on the performance, welfare, slaughter and meat quality characteristics of broiler chickens in the subsequent period ↗
Kadir Erensoy, Musa Sarıca, Moise Noubandiguim, Numan Karaçay · Tropical Animal Health and Production · 2024
❝ 2