
Research article · 2024 · Full text
International Journal of Agriculture Extension and Social DevelopmentIncome and employment generation through dairying in Maharashtra State
Volume 7(1) · Pages 333–336 · DOI: 10.33545/26180723.2024.v7.i1e.247 ↗
Research areasLivestock Management and Performance ImprovementAgricultural Economics and PracticesAgricultural risk and resilience
Abstract
Author-writtenThe study on income and employment generated by milk producers through various operation and management of dairy activities in milk production was conducted in Vidarbha and Marathwada region of Maharashtra State. The regions were purposively selected due to low milk production and productivity compared to other region of State. During 2021-23, primary data were collected randomly selected from 410 milk producers and tabular analysis was performed. The study revealed that the overall employment generated from small, medium and large herd size category were 176.5, 254.80 and 325.31 man-days annually. The overall income generated from buffalo and crossbred cows of Rs. 55887.00 and Rs. 91426.19 annually. The milk producer maintaining local cow produced Rs.13777.80 annually. The overall income from buffalo and crossbred cow was significantly higher than local cow. The participation of men, women and childrens in different operations like bringing fodder followed by feeding recorded the highest labour utilization followed by other activities including chaff cutting grazing, giving water, cleaning cattle shed and animals, milking, marketing of milk and milk products and Health care of dairying was studied. The study clearly showed positive impact of dairying on income and employment generation in the study area.
Summary
Source-checkedPlain-language reading of the full paper, prepared with AI and checked against the text. Each point links to the authors' own words.
Why it matters
- Dairying provides a continuous source of year-round income and employment, serving as a critical livelihood asset during crises such as the COVID-19 pandemic. View evidence ↗
- In regions like Vidarbha and Marathwada, agricultural revenue and employment have been negatively impacted by uneven rainfall and recurring droughts. View evidence ↗
The question
- The study aimed to evaluate the income and employment generated by milk producers through dairy operations and management in the Vidarbha and Marathwada regions of Maharashtra. View evidence ↗
What they did
- Data were collected from randomly selected milk producers in the districts of Bhandara, Yavatmal, Nanded, and Latur. View evidence ↗
- The investigation involved a total of 410 participants, with a complete enumeration of households regarding their milch animals. View evidence ↗
- Households were categorized by herd size: Small (1-3 animals), Medium (4-5 animals), and Large (more than 6 animals). View evidence ↗
- Employment was measured by recording time spent on dairy operations and converting it into man-days based on an eight-hour workday. View evidence ↗
What they found
- Annual employment increased with herd size, with small, medium, and large categories generating 176.5, 254.80, and 325.31 man-days respectively. View evidence ↗
- Bringing fodder from the fields was the most time-consuming daily activity, requiring 0.56 hours for men and 0.65 hours for women. View evidence ↗
- Women contributed a higher proportion of the total labor used in dairying activities compared to men. View evidence ↗
What it means
- The authors conclude that dairying has a positive impact on income, employment generation, and women's empowerment in the studied regions. View evidence ↗
- Dairying serves as a financial safety net (cushion) against income shocks caused by crop failures in drought-prone areas. View evidence ↗
Visual summary
2 visualsIllustrations explain the paper; charts are replotted from the paper's own table values.
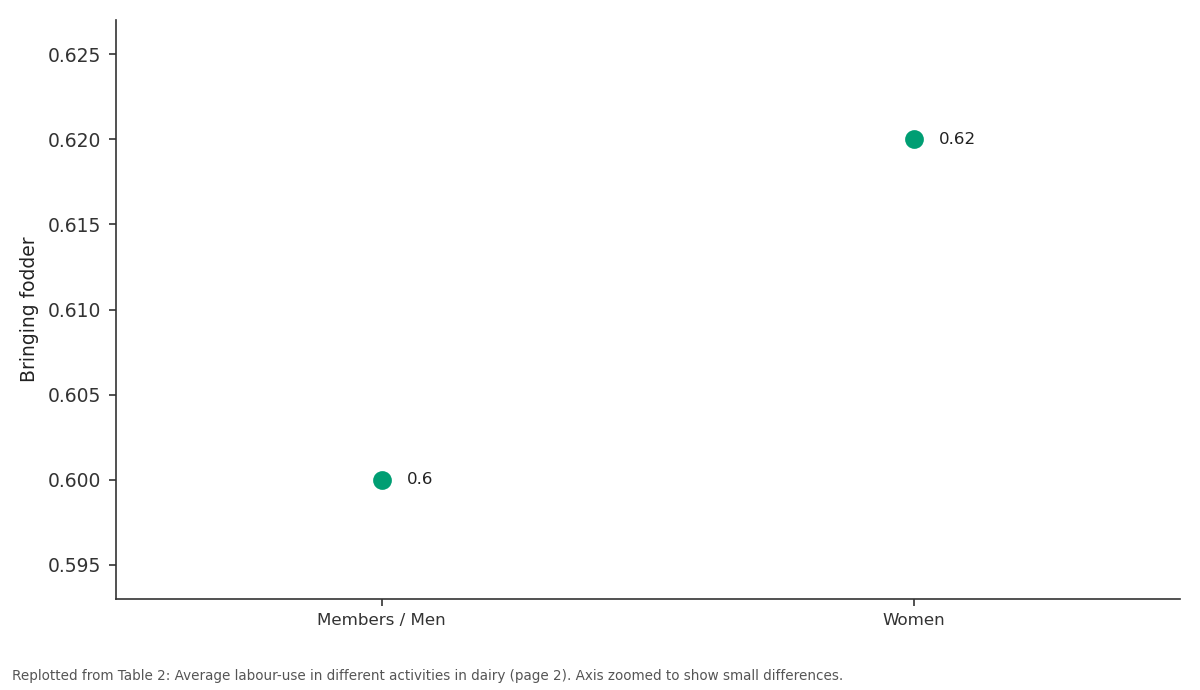
Bringing fodder: Members / Men vs Women
Replotted from Table 2 (page 2) of the original paper. Every bar is the paper's own table value.
View source evidence ↗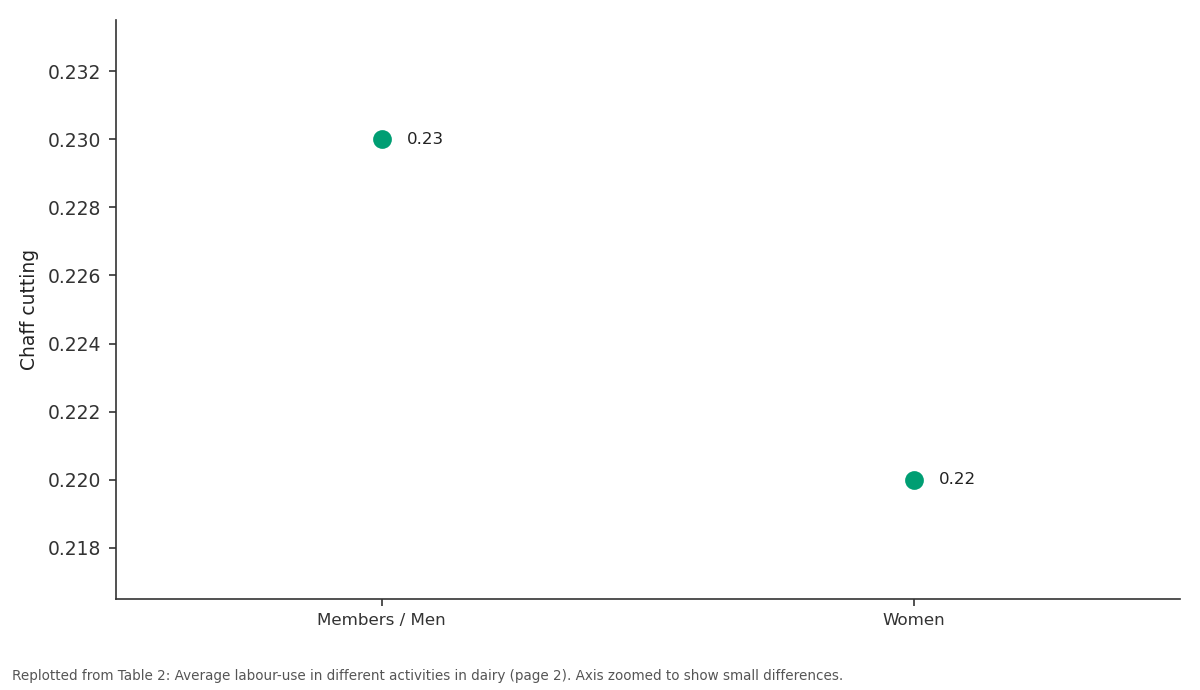
Chaff cutting: Members / Men vs Women
Replotted from Table 2 (page 2) of the original paper. Every bar is the paper's own table value.
View source evidence ↗Figures & tables
From the original paper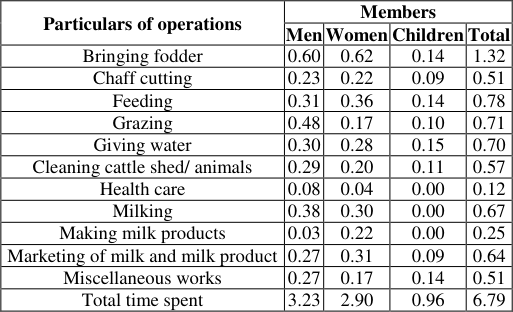 Table 2
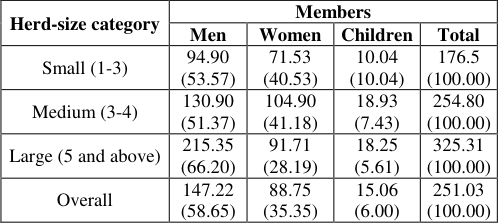 Table 1
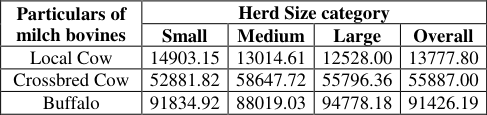 Table 3
 Table 4
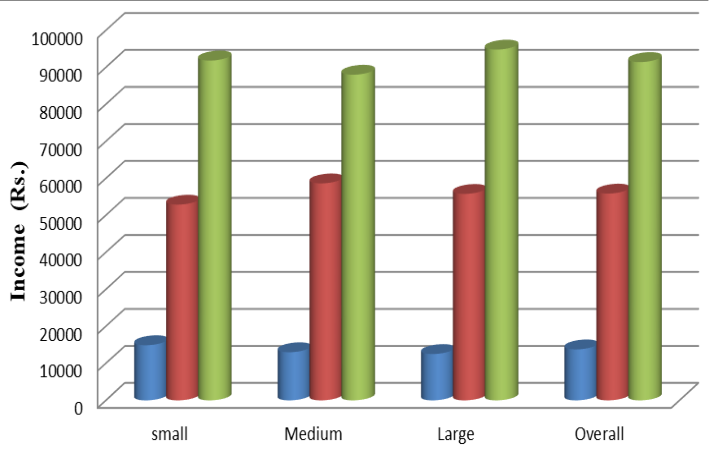 Figure 1
 Figure 2
Introduction
Dairying contribute to livelihood through generating continuous round-the-year income and employment as they used to meet their daily requirement, providing a source of natural capital assets to maintain a livelihood in times of crisis like the COVID-19 pandemic. Evidence suggests that the white revolution in India has been more successful than the green revolution. There are still many resource-poor farmers in the country that depend on rain-fed farming to make ends meet, and this is especially true in the Vidarbha and Marathwada region of Maharashtra. Recurring droughts and uneven rainfall distribution in recent years have had a negative impact on agricultural output, revenue, and employment. Human resources is a crucial input for executing various dairy tasks and accounts for approximately one-fifth of the overall cost of milk production in rural regions (Singh and Chauhan, 2015) [7] . This necessitates the participation of men, women, and children in the different operations and activities of dairy farming that generate employment. It has been analyzed and studied how milk producers with varying herd sizes utilize labour per day to accomplish a variety of operations in their dairy farming. The average yearly labour requirement in man-days for dairy farming has been estimated for the household sample of the study region. The annual employment generated by milch animals in various herd size categories and each milk cow was analyzed.
Material and Methods
The Vidarbha and Marathwada regions of Maharashtra State were chosen purposively since it has lower milk output and productivity than other regions of the state. The milk producers of Bhandara, Yavatmal, Nanded, and Latur from the Vidarbha and Marathwada regions of the Maharashtra State, were randomly selected for data collection. About 52.20 percent of milk producers are considered small, 30.98 percent medium, and 16.83 percent large in terms of the size of their herds. Two districts from Vidarbha and Marathwada region were selected for study. Two blocks were randomly selected from each district. And, from each block, three villages were chosen randomly. Accordingly, a total of 410 participants were selected for the investigation and a complete enumeration of all the households with respect to milch animals was made. All the milk producing households were classified into three herd size categories, viz., Small (1-3 milch animals), Medium (4-5 milch animals) and Large (more than 6 milch animals).
Employment Generation
Employment generation was studied with the help of tabular analysis using averages and percentages. Actual time spent by a human being in various operations of dairy farming was recorded for each household, such as Bringing fodder, Chaff cutting, Feeding, Grazing, Giving water, Cleaning cattle shed/ animals, Health care, Milking, Making milk products, Selling milk. The total time spent was converted into man-days by assuming eight working hours for a day.
1 day of women labour = 0.67 man day (3 Women = 2 men) 1 man days labour = 0.5 man days of children (4 Children = 2 men) www.extensionjournal.com
Income Generation
It was worked out by using total milk produced by the milch animal (Local Cow / Crossbred cow / Buffalo) in a year and the prevailing price of milk. Also, herd size category wise income estimated by total milk produced by herd of animal maintained by milk producer and prevailing price of milk per liter was considered for estimation of annual income calculated.
Total Income = (Total milk production) X (Prevailing price of milk per liter)
Results and Discussion Employment Generation
The study concluded that buffalo rearing was the most important in generating employment in dairy farming, followed by Crossbred cows. Producers with local cows tend to produce less milk, reducing the number of available dairy farming jobs. Women in households with a small herd size generate employment of 71.53 man days per year, while men in the same category generate 94.90 man days. At the same time, a household with a herd will generate 104.90 man-days for women and 130.90 man-days for men. The large herd size group of dairy producers generates 325.31 man-days of employment per year per household, with men contributing more (215.35) than women (91.71). The overall employment generated with an increasing trend as the number of milking animals increased. Sharma and Sharma (2004) made similar observations in their study of the semi-arid region of Rajasthan. An examination of the proportion of work done by men, women, and children within a household indicated that the proportion of work done by women in dairying activities was higher than that done by men. It was discovered that women make the most significant contribution to the labour used in the dairying activities. An examination of the utilization of family labour in various activities of dairy farm was carried out. This examination focused on men, women, and children. It was discovered that the most time spent was 0.56 hours of men and 0.65 hours of women each day in carrying fodder from the fields. This discovery was consistent with Meena's past research, which she had conducted (2008). The women spent their time in preparing dairy products such as curd, khoa, etc. was 0.22 hours per day. It was discovered that women spent an additional 0.31 hours each day selling milk because they had to personally transport their milk to milk collection facilities to sell it. It was discovered that children were involved in all dairy activities to some extent, except milking. With reference to the various species of milch bovines, the buffalo produced the highest average income from the large herd size category, which was Rs.94778.18, followed by the small and medium herd size categories, which generated Rs.91834.92 and 88019.03 respectively. It's possible that the higher milk yield and higher fat content in buffalo milk, which ultimately led to a larger revenue, as compared to other species of milch bovines. In aggregate terms, the average income from crossbred cow milk production was highest in the medium herd size group, which was around Rs 58647.72. This was followed by the large and small herd size categories, which were Rs.55796.36 and Rs.52881.82 respectively. The poor performance of local cows is reflected in the local cows' milk milk production. The income earned from small herd size category was approximately Rs 14903.15, followed by medium and large herd size category incomes of Rs 13014.61 and Rs.12528 respectively. It has also been reported by Dixit (1999), and Singh et al. that the local cow milk production has a negative net return (2004). The negative performance of local cow is reflected in the negative net returns; nonetheless, the assertion should not be made too strongly. The low milk production of these cows was a major contributor to this predicament. These animals are an integral part of the farming system as a whole thus that must be kept in mind. So, local farmers continue to raise cows for draught power and extra cash. It is not www.extensionjournal.com acceptable to just accept the low output of local animals without making any effort to improve their breeding, feeding, and management.
Acknowledgement
www.extensionjournal.com (CG). In addition, they appreciate the anonymous referee's feedback and recommendations. The authors express their sincere gratitude to the Associate Dean, College of Dairy Technology, Warud (Pusad), MAFSU-Nagpur for their gracious permission to conduct this study and for their invaluable support throughout the investigation.
Figures and tables from the paper
| Particulars of operations | Members | — | — | — |
|---|---|---|---|---|
| Men | Women | Children | Total | |
| Bringing fodder | 0.60 | 0.62 | 0.14 | 1.32 |
| Chaff cutting | 0.23 | 0.22 | 0.09 | 0.51 |
| Feeding | 0.31 | 0.36 | 0.14 | 0.78 |
| Grazing | 0.48 | 0.17 | 0.10 | 0.71 |
| Giving water | 0.30 | 0.28 | 0.15 | 0.70 |
| Cleaning cattle shed/ animals | 0.29 | 0.20 | 0.11 | 0.57 |
| Health care | 0.08 | 0.04 | 0.00 | 0.12 |
| Milking | 0.38 | 0.30 | 0.00 | 0.67 |
| Making milk products | 0.03 | 0.22 | 0.00 | 0.25 |
| Marketing of milk and milk product | 0.27 | 0.31 | 0.09 | 0.64 |
| Miscellaneous works | 0.27 | 0.17 | 0.14 | 0.51 |
| Total time spent | 3.23 | 2.90 | 0.96 | 6.79 |
Table text extracted from the original PDF; superscript letters are shown inline. The original table image is below.
View original table image
| Herd-size category | Members | — | — | — |
|---|---|---|---|---|
| Men | Women | Children | Total | |
| Small (1-3) | 94.90 (53.57) | 71.53 (40.53) | 10.04 (10.04) | 176.5 (100.00) |
| Medium (3-4) | 130.90 (51.37) | 104.90 (41.18) | 18.93 (7.43) | 254.80 (100.00) |
| Large (5 and above) | 215.35 (66.20) | 91.71 (28.19) | 18.25 (5.61) | 325.31 (100.00) |
| Overall | 147.22 (58.65) | 88.75 (35.35) | 15.06 (6.00) | 251.03 (100.00) |
Table text extracted from the original PDF; superscript letters are shown inline. The original table image is below.
View original table image
| Particulars of milch bovines | Herd Size category | — | — | — |
|---|---|---|---|---|
| Small | Medium | Large | Overall | |
| Local Cow | 14903.15 | 13014.61 | 12528.00 | 13777.80 |
| Crossbred Cow | 52881.82 | 58647.72 | 55796.36 | 55887.00 |
| Buffalo | 91834.92 | 88019.03 | 94778.18 | 91426.19 |
Table text extracted from the original PDF; superscript letters are shown inline. The original table image is below.
View original table image
| Herd Size Category of Sample household | — | — | — |
|---|---|---|---|
| Small | Medium | Large | Overall |
| 142286.92 | 237431.00 | 381857.39 | 212076.29 |
Table text extracted from the original PDF; superscript letters are shown inline. The original table image is below.
View original table image
References
9 in the original paper- Kaushik S, Rani S, Dahiya R. Entrepreneurship development of rural women through value-added dairy products. Asian Journal of Agricultural Extension, Economics & Sociology. 2021;39(5):10-15.
- Kaur S, Kaur P. Enhancing income and employment on marginal and small farms through dairying in Punjab. Indian J Dairy Sci. 2019;72(4):413-421.
- Kashish MK, Sekhon MK, Dhawan V. Impact of dairying on income and income distribution of smallholder dairy farmers in Punjab. Indian J Dairy Sci. 2017;70:781-788.
- Kumari B, Malhotra R. Impact of women dairy cooperative societies on income and employment of women in Begusarai District of Bihar. Agricultural Economics Research Review. 2016;29(2):313-318.
- Singh H, Burark SS. Income and employment generation under existing farming systems in tribaldominated Banswara district of Southern Rajasthan. Economic Affairs. 2016;61(1):119-125.
- Singh R. Impact of dairy cooperatives on income and employment in rural Meghalaya. Indian Journal of Dairy Science, 2015, 68(2).
- Raut AA, Sankhala G. Entrepreneurship among commercial dairy farmers in Maharashtra. Indian J Dairy Sci. 2014;67:6.
- Ganga, Jain DK. Impact of dairy financing through selfhelp groups on income and employment generation in Jaipur District of Rajasthan. Indian J Dairy Sci. 2012;65(4):337-341.
- Meena GL, Jain DK, Dhaka JP. Impact of dairy cooperatives on income and employment generation of milk producers in Alwar District (Rajasthan). Journal of Dairying, Foods and Home Sciences. 2009;28(1):39-42.