
Research article · 2024 · Full text
International Journal of Advanced Biochemistry ResearchStudy on changes in Haemato-biochemical parameters of pica affected camels with Mineral mixture and salt supplementation
Volume 8(1) · Pages 337–341 · DOI: 10.33545/26174693.2024.v8.i1e.374 ↗
Research areasTherapeutic Uses of Natural ElementsSoil and Environmental Studies
Abstract
Author-writtenThe present study was carried out to measure haematological and biochemical parameters changes in pica affected camels and its changes after supplementation of mineral mixture with salt in these camels. The proposed study was carried out in an organized camel herd at NRCC, Bikaner. The 18 severely pica affected camel were selected for study on the basis of clinical signs and divided into 3 groups, group A treated with mineral mixture and group B was given mineral mixture with common salt and one untreated control group (group C) to evaluate haematological and biochemical changes in different groups. Blood samples were collected every 15 days of interval up to 60 days for hematological and biochemical evaluation. The mean values of total erythrocyte count, haemoglobin, PCV, Neutrophils, total protein and globulin, that was initially low tend to increase in both treatment groups whereas lymphocyte count was decreased and were significantly similar to healthy control at 60th days in both treatment groups but remained significantly different in untreated group. However, salt treated group B has shown better improvement in haemato-biochemical values over Group A which was only on mineral mixure. The present study showed additional salt supplementation along with mineral mixture gives better results in cases of pica in terms of hamematological and biochemical parameters.
Summary
Source-checkedPlain-language reading of the full paper, prepared with AI and checked against the text. Each point links to the authors' own words.
Why it matters
- Pica in camels can lead to serious intestinal and bowel complications, including obstructions, perforations from ingesting sharp objects, and parasitic infections. View evidence ↗
- While the exact mechanism of pica is not fully understood, it is associated with protein, salt, and phosphorus deficiencies, as well as parasitism. View evidence ↗
The question
- The study aimed to evaluate the efficacy of supplementing pica-affected camels with a mineral mixture combined with salt compared to a mineral mixture alone. View evidence ↗
What they did
- Eighteen severely pica-affected camels were divided into three groups: Group A (mineral mixture), Group B (mineral mixture plus common salt), and Group C (untreated control). View evidence ↗
- For two months, Group A received 30g of mineral mixture daily, Group B received 30g of mineral mixture and 20g of common salt daily, and Group C received only basal fodder. View evidence ↗
- Blood samples were collected every 15 days over a 60-day period to evaluate haematological and biochemical changes. View evidence ↗
What they found
- At the start of the study (day 0), pica-affected camels in all groups had significantly lower red blood cell counts, haemoglobin, packed cell volume (PCV), and neutrophils than healthy controls. View evidence ↗
- After treatment, Group B (mineral mixture + salt) showed red blood cell counts, haemoglobin, PCV, and neutrophil levels that were significantly similar to those of healthy controls. View evidence ↗
- By day 60, Group A (mineral mixture only) and Group C (untreated) still had significantly lower haemoglobin, PCV, and neutrophil levels compared to healthy controls. View evidence ↗
- On day 60, serum total protein in Group B was significantly similar to healthy controls, whereas it remained significantly lower in Group A and Group C. View evidence ↗
- Both treated groups (A and B) experienced a significant increase in total protein and globulin levels compared to the untreated control group over the course of the treatment. View evidence ↗
- There were no significant changes in liver enzymes (AST, ALT, and alkaline phosphatase) regardless of treatment or pica status. View evidence ↗
What it means
- The authors conclude that supplementing pica-affected camels with both a mineral mixture and salt provides better haematological and biochemical results than using a mineral mixture alone. View evidence ↗
Visual summary
1 visualsIllustrations explain the paper; they do not show study data.
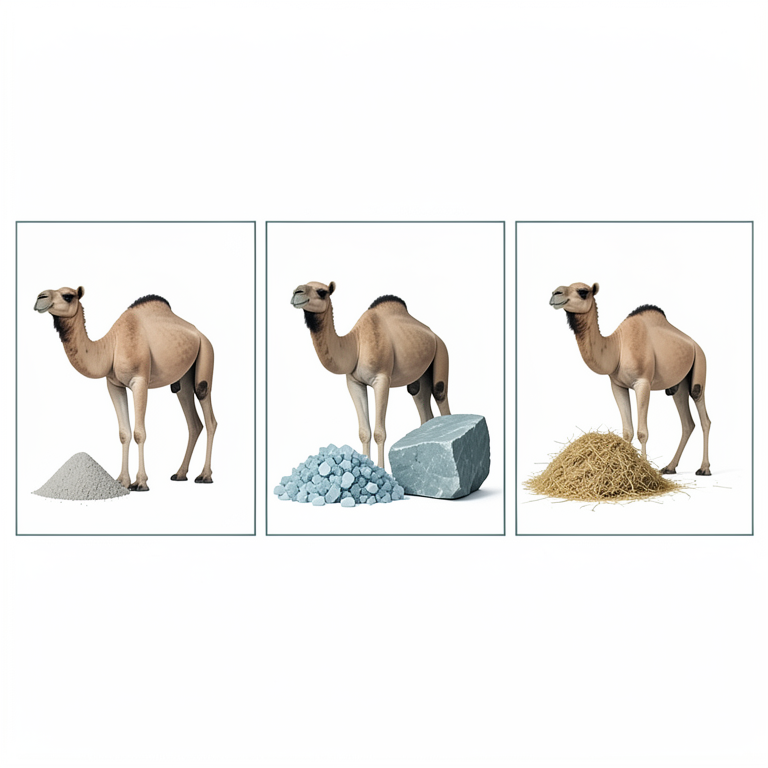
Treatment Group Comparison
AI-generated conceptual illustration (Dromedary camels). It explains the idea and does not show study data.
View source evidence ↗Figures & tables
From the original paper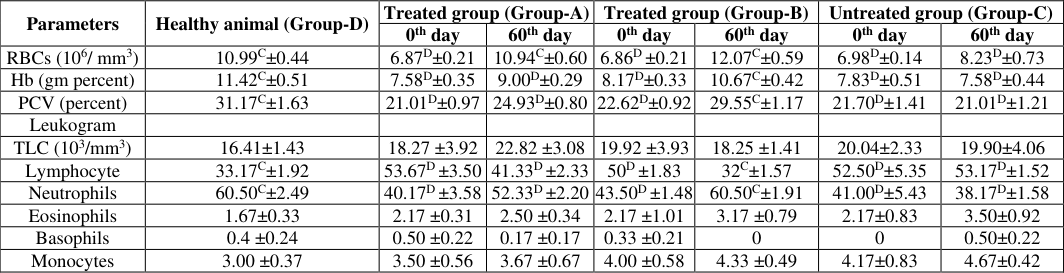 Table 1
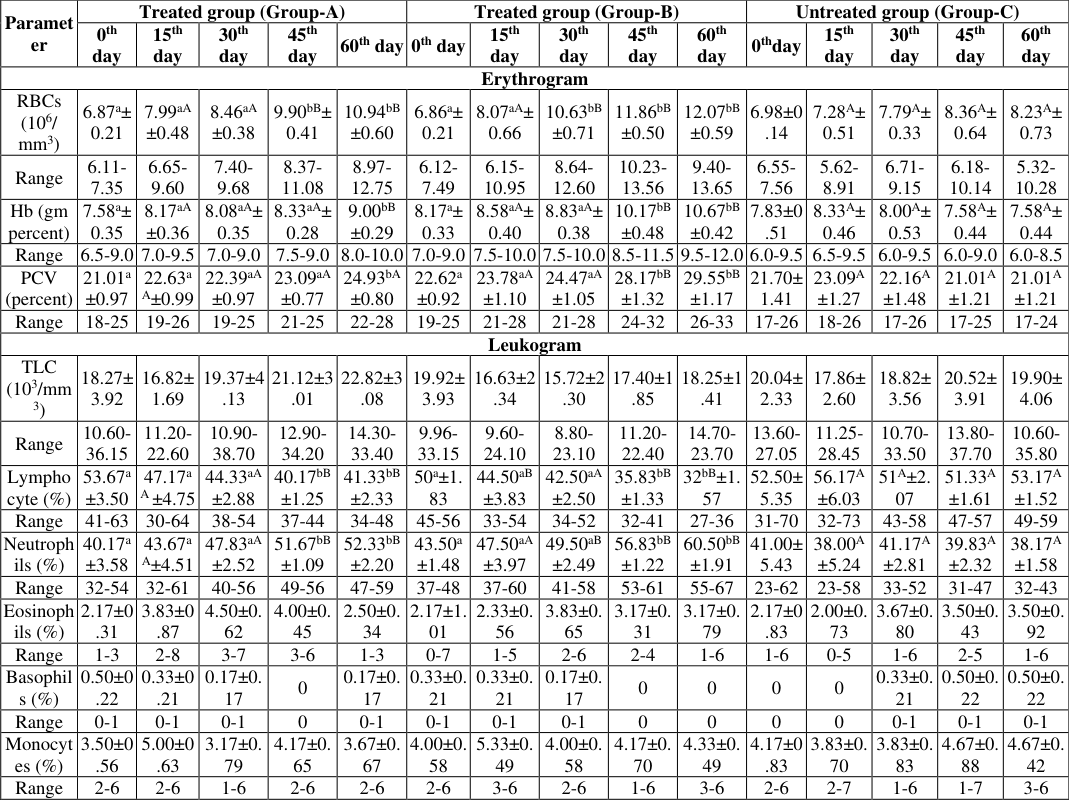 Table 2
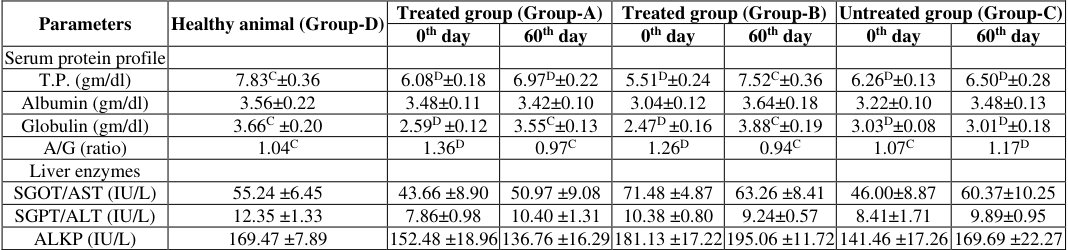 Table 3
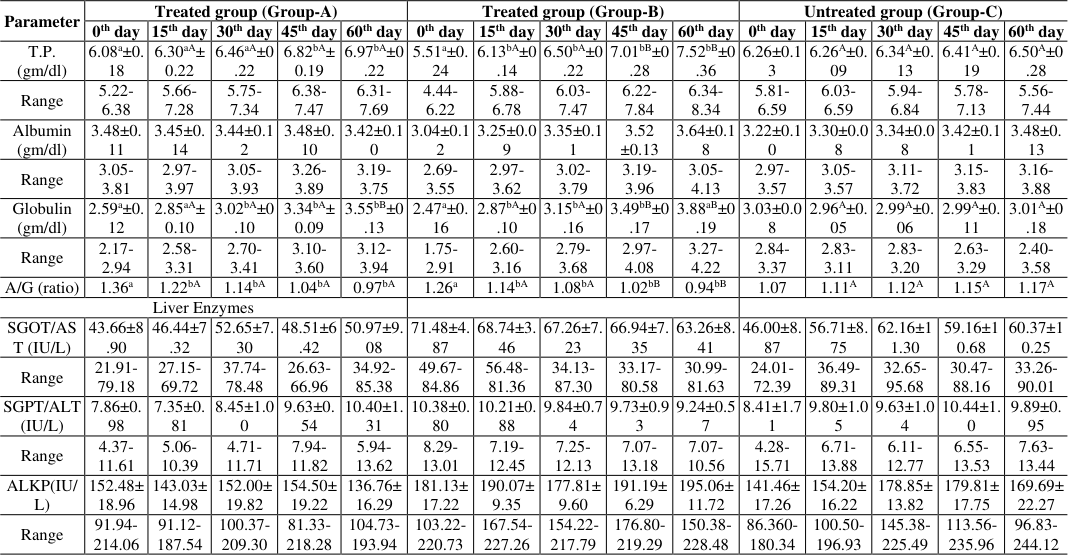 Table 4
Introduction
Camel is the most suitable mammal for use in extreme climatic conditions (Wilson, 1984; Yagil, 1985) [25,26] . Camel farming is mainly both the organised (tola keepers) and unorganised (one to few animal keepers). Farmers do not follow any scientific feeding plan and only the available feeds are being offered to the camels. Pica has potential side effects that most commonly affect the intestine and bowel. Complications can include constipation, cramping, pain, obstruction, perforation from sharp objects like rocks or gravel, contamination, and infection from soil-dwelling parasites (Firyal, 2007) [7] . Complete mechanism of pica has not been understood yet; it has been known to be associated with parasitism and deficiencies of phosphorus, salt and protein (Smith, 2015) [22] . Minerals like copper, zinc, and cobalt, has been implicated in the aetiology of pica and fleece dietary pattern in sheep (Fahmy et al., 1980) [6] . Hence, the present study has been undertaken to study the haemabiochemical changes in pica affected camels and efficacy of mineral mixture with salt supplementation compared to feeding of only mineral mixture in haematological and biochemical parameters.
Materials and Methods
In the Feeding trial experiment, 18 male camels were selected based on clinical sign and symptoms during observation and these were divided into three groups comprising six animals in each group. In this trial six animals of group-A were fed with specially designed mineral mixture daily at the rate of 30 gram per animal per day mixed with fodder for two month, six animals of group-B were fed mineral mixture 30 gram + 20 gram common salt per animal per day mixed with fodder for two month, whereas six animals of group-C were fed with same basal fodder for two months. In group-D healthy control animal were taken which were not showing any signs of pica.
To know the intensity of parasitic infections in camels, collected faecal samples were processed and examined as qualitative examination was conducted to record the gastrointestinal parasitic infections in camel population on the basis of presence/absence of eggs/cysts/oocysts in the faeces by using centrifugal floatation and sedimentation techniques (Soulsby, 1982) [24] . Two grams of strained faecal sample was mixed with ordinary water in 15 ml centrifuge tube and centrifuged for 1-2 min at 1500 RPM. The supernatant was removed and similarly two washings were given so that the colour of the faecal sample was removed. After last washing, the faecal decant at the bottom of the tube was mixed with Sheather's sugar solution and was filled up to its brim and was covered with clean coverslip. After few minutes the coverslip was then picked up gently and put over a slide for examination under low power objective (10X). For haematobiochemical examination blood samples from these 18 camels were collected from jugular vein puncture in sterile vacuutainers having ethylene diamine tetra acetic acid (EDTA) disodium salt as an anticoagulant added at the rate of 1mg/ml of blood of as recommended by Jain (1986) [10] . And simultaneously collected in another sterile vacuutainers having no anticoagulant. These vacuutainers tubes were kept in slanting position for one hour at 37 °C. Blood clots of these slants were broken and tubes were centrifuged at 3000 rpm for 15 min. The serum was harvested in small Pyrex tubes and was stored in the deep freeze at -20 °C till analysis. For haematological examination blood samples were analysed for haemoglobin, packed cell volume, total erythrocyte count, total leukocyte count and differential leukocyte count as described by Jain (1986) [10] . Biochemical analysis of serum samples was made to ascertain liver function by estimating serum total protein, albumin and globulin, alkaline phosphatase (ALKP), serum aspartate aminotransferase (SGOT) and serum alanine aminotransferase (SGPT). These were determined by the colorimetric method with kits supplied by AGD Biomedicals Private limited using Smart-Spec Plus Spectrophotometer (Bio Rad).
Results and Discussion
Results and Discussion
Faecal examination
Faecal examination of the 21 pica affected camels revealed that none of the camel was affected with heavy parasitic load. Since no heavy parasitic infestation was recorded, therefore no special deworming was under taken. Such minor recurring infestations are being taken care by the regular deworming schedule being followed at four-month interval with changing dewormers. C,D) between treated and healthy control camels differ significantly (p<0.05).
Haematological parameters
In the feeding trial experiment, significantly low in the mean value of total erythrocyte count, haemoglobin, PCV and neutrophils were recorded in the treated groups A and B and untreated group C on day 0 (p<0.05) compared to healthy control group D. Whereas significant decrease in the mean value of haemoglobin, PCV and neutrophils were also recorded in the treated group-A and C on day 60 (p<0.05) post-treatment compared to healthy control group D. In accordance with other researchers (Singh et al., 1986; Singh, 1993 and Beniwal and Singh, 2007) [19,20,4] . Decrease in total erythrocyte count found in present study in pica affected camels is conformity with (Singh et al. 1986; Singh, 1993; Beniwal and Singh, 2007; Koted, 2019) [19, 20, 4, . Decrease in PCV in pica affected camels were reported by Singh et al., 1986; Singh, 1993 and Beniwal and Singh, 2007 [19,20,4] . High post treatment values of more than 50 percent recorded in the present study is in agreement with various workers for neutrophils counts of more than 50 percent in healthy camels (Singh et al., 2000; Gorakhmal et al., 2001 and Mali, 2002) [21,9,12] .
In group B, post treatment values of total erythrocyte count, haemoglobin, PCV and neutrophils were significantly similar to healthy control group D. Significant increase in the mean value of lymphocyte count were recorded in the both treated groups A and B and untreated group C on day 0 (p<0.05) pre-treatment compared to healthy control group D. Comparative similar Hb values in the range of 8-12 gm/dl in healthy camels have been reported by other authors (Singh et al., 2000; Gorakhmal et al., 2001 and Mali, 2002) [21, 9, 12] . A comparative similar erythrocyte count in the range of 7-11x106 cell/µl has been reported in healthy camels ( [1,2,17,16,5,21,12] . Comparative similar PCV values (25-30%) in healthy camels were recorded by Rezakhani et al. (1997) [16] , Sharma (2000) [18] and Mali (2002) [12] . Whereas PCV values of more than 40 percent in healthy camels were reported by Soliman and Shaker (1967) [23] . Almost similar TLC values for healthy camels were recorded by Nassar et al. (1977) [14] Ghodrian et al. (1978) [8] Al-Ali et al. (1988) [1] Alhadrami (1997) [2] . Low TLC values in healthy camels were recorded by Dongre (2000) [5] , Sharma (2000) [18] and Mali (2002) [12] . Whereas significant increase in the mean value of lymphocyte count were also recorded in the treated group-A and C on day 60 (p<0.05) post-treatment compared to healthy control group D. In group B, post treatment values of lymphocyte count were significantly similar to healthy control group D. High lymphocytic values (>55%) in healthy camels were recorded by Soliman and Shaker (1967) [23] and Dongre (2000) [5] . [13,16,21,18,9,12] .
There was no significant difference in the total leucocyte, eosinophils, basophils and monocyte count were recorded between treated and untreated control groups either pre or post treatment. Singh (1993) [19] reported that in the pica affected camels TLC remained unaffected. Variations in the eosinophils counts from 1.2 to 4.53 percent have been reported (Dongre, 2000; Gorakhmal et al., 2001 and Mali, 2002) [5,9,12] in healthy camels. Basophils count of less than one percent in healthy camels has been reported by other workers (Rezakhani et al., 1997; Dongre, 2000; Gorakhmal et al., 2001 and Mali, 2002) [16,5,9] . In agreement to the present findings Singh (1993) [19] reported that in the pica affected camel monocyte count remained unaffected.
Biochemical parameters of the camels
C,D) between treated and healthy control camels differ significantly (p<0.05).
In feeding trail experiment, significantly low in mean±SE serum total protein and globulin were recorded in the both treated groups A and B and untreated group C on day 0 (pretreatment) compared to healthy control group D. A/G ratio of treated group A and B and was significantly increased compared to healthy control group D on day 0. Mean serum total protein was recorded significant decrease in the treated group-A and untreated group C on day 60 (post-treatment) compared to healthy control group D (p<0.05) whereas in group B it was significantly similar with healthy control group D. A/G ratio of treated group A and B was significantly similar to healthy control group D on day 60 whereas A/G ratio of untreated group C was significantly increase compared to healthy control group D on day 60. Liver enzymes and albumin protein showed no significant difference in both the treated (groups A and B) and untreated control (group C) on day 0 and 60 (pre and posttreatment) compared to healthy control group D. In healthy camels, similar serum globulin concentrations of 3.41±0.18 (2.78-3.94) gm/dl were reported by Rathod (2006) [15] , whereas high globulin concentrations of 4.66±0.16 (3.72-5.31) gm/dl were reported by Dongre (2000) [5] . Koted (2019) [11] recorded decrease in total protein and globulin levels in the pica affected camels as compared to treated and healthy camels. There was significant increase in the mean total protein and globulin in the treated group-A and B on various stages of 15 days interval evaluation post treatment compared to group-C untreated control camels and within group comparison to pre-treatment. Whereas, no significant difference in the mean albumin value and A/G ratio either within or between the treated and untreated control groups was recorded. But within treatment group-A significant decrease in A/G ratio was observed on various stages of 15 days interval evaluation post treatment compared to day 0. There was significant decrease in the mean A/G ratio in the treated group-B on various stages of 15 days interval evaluation post treatment compared to day 0 and compared to group-C untreated control camels. (p≤0.05).
In the present study, lymphocytosis with compensatory neutropenia and decrease in total protein and globulin suggests compromised immunity in pica affected camels. A:G ratio was significantly low in both the treatment groups, which was either because of only increase in globulin concentrations or corresponding decrease in albumin concentrations shows rectification of compromised immunity in the treated groups.
No significant difference in AST, ALT and alkaline phosphatase concentrations were recorded in both pretreatment vs. post treatment and treated vs. untreated control groups. Aytekin et al. (2011) [3] found no change in ALT and AST concentrations between pica affected and nonaffected horses.
Conclusion
Haematological examination of pica affected camels revealed low level of erythrocyte count, haemoglobin concentration and packed cell volume. Differential leucocytic counts revealed lymphocytosis and neutropenia in the pica affected camels. Significant decrease in total protein and globulin levels were recorded in the pica affected camels. A:G ratio becoming low in both the treatment groups, either because of only increase in globulin concentrations or corresponding decrease in albumin concentrations shows rectification of compromised immunity in the treated groups. In the untreated control group, A: G ratio was comparatively higher. Liver function tests (SGOT, SGPT and ALKP) reflect no liver damage in pica affected camels. These became normal by supplementation mineral mixture and salt and there was significantly improvement in animals treated with mineral mixture with salt supplementation. Based on haematobiochemical parameters, effect of additional salt supplementation with mineral supplementation in the pica affected camels was found better.
Figures and tables from the paper
| Parameters | Healthy animal (Group-D) | Treated group (Group-A) | — | Treated group (Group-B) | — | Untreated group (Group-C) | — |
|---|---|---|---|---|---|---|---|
| 0th day | 60th day | 0th day | 60th day | 0th day | 60th day | ||
| RBCs (106/ mm3) | 10.99C±0.44 | 6.87D±0.21 | 10.94C±0.60 | 6.86D ±0.21 | 12.07C±0.59 | 6.98D±0.14 | 8.23D±0.73 |
| Hb (gm percent) | 11.42C±0.51 | 7.58D±0.35 | 9.00D±0.29 | 8.17D±0.33 | 10.67C±0.42 | 7.83D±0.51 | 7.58D±0.44 |
| PCV (percent) | 31.17C±1.63 | 21.01D±0.97 | 24.93D±0.80 | 22.62D±0.92 | 29.55C±1.17 | 21.70D±1.41 | 21.01D±1.21 |
| Leukogram | |||||||
| TLC (103/mm3) | 16.41±1.43 | 18.27 ±3.92 | 22.82 ±3.08 | 19.92 ±3.93 | 18.25 ±1.41 | 20.04±2.33 | 19.90±4.06 |
| Lymphocyte | 33.17C±1.92 | 53.67D ±3.50 | 41.33D ±2.33 | 50D ±1.83 | 32C±1.57 | 52.50D±5.35 | 53.17D±1.52 |
| Neutrophils | 60.50C±2.49 | 40.17D ±3.58 | 52.33D ±2.20 | 43.50D ±1.48 | 60.50C±1.91 | 41.00D±5.43 | 38.17D±1.58 |
| Eosinophils | 1.67±0.33 | 2.17 ±0.31 | 2.50 ±0.34 | 2.17 ±1.01 | 3.17 ±0.79 | 2.17±0.83 | 3.50±0.92 |
| Basophils | 0.4 ±0.24 | 0.50 ±0.22 | 0.17 ±0.17 | 0.33 ±0.21 | 0 | 0 | 0.50±0.22 |
| Monocytes | 3.00 ±0.37 | 3.50 ±0.56 | 3.67 ±0.67 | 4.00 ±0.58 | 4.33 ±0.49 | 4.17±0.83 | 4.67±0.42 |
Table text extracted from the original PDF; superscript letters are shown inline. The original table image is below.
View original table image
| Paramet er | Treated group (Group-A) | — | — | — | — | Treated group (Group-B) | — | — | — | — | Untreated group (Group-C) | — | — | — | — |
|---|---|---|---|---|---|---|---|---|---|---|---|---|---|---|---|
| 0th day | 15th day | 30th day | 45th day | 60th day | 0th day | 15th day | 30th day | 45th day | 60th day | 0thday | 15th day | 30th day | 45th day | 60th day | |
| Erythrogram | |||||||||||||||
| RBCs (106/ mm3) | 6.87a± 0.21 | 7.99aA ±0.48 | 8.46aA ±0.38 | 9.90bB± 0.41 | 10.94bB ±0.60 | 6.86a± 0.21 | 8.07aA± 0.66 | 10.63bB ±0.71 | 11.86bB ±0.50 | 12.07bB ±0.59 | 6.98±0 .14 | 7.28A± 0.51 | 7.79A± 0.33 | 8.36A± 0.64 | 8.23A± 0.73 |
| Range | 6.11- 7.35 | 6.65- 9.60 | 7.40- 9.68 | 8.37- 11.08 | 8.97- 12.75 | 6.12- 7.49 | 6.15- 10.95 | 8.64- 12.60 | 10.23- 13.56 | 9.40- 13.65 | 6.55- 7.56 | 5.62- 8.91 | 6.71- 9.15 | 6.18- 10.14 | 5.32- 10.28 |
| Hb (gm percent) | 7.58a± 0.35 | 8.17aA ±0.36 | 8.08aA± 0.35 | 8.33aA± 0.28 | 9.00bB ±0.29 | 8.17a± 0.33 | 8.58aA± 0.40 | 8.83aA± 0.38 | 10.17bB ±0.48 | 10.67bB ±0.42 | 7.83±0 .51 | 8.33A± 0.46 | 8.00A± 0.53 | 7.58A± 0.44 | 7.58A± 0.44 |
| Range | 6.5-9.0 | 7.0-9.5 | 7.0-9.0 | 7.5-9.0 | 8.0-10.0 | 7.0-9.0 | 7.5-10.0 | 7.5-10.0 | 8.5-11.5 | 9.5-12.0 | 6.0-9.5 | 6.5-9.5 | 6.0-9.5 | 6.0-9.0 | 6.0-8.5 |
| PCV (percent) | 21.01a ±0.97 | 22.63a A±0.99 | 22.39aA ±0.97 | 23.09aA ±0.77 | 24.93bA ±0.80 | 22.62a ±0.92 | 23.78aA ±1.10 | 24.47aA ±1.05 | 28.17bB ±1.32 | 29.55bB ±1.17 | 21.70± 1.41 | 23.09A ±1.27 | 22.16A ±1.48 | 21.01A ±1.21 | 21.01A ±1.21 |
| Range | 18-25 | 19-26 | 19-25 | 21-25 | 22-28 | 19-25 | 21-28 | 21-28 | 24-32 | 26-33 | 17-26 | 18-26 | 17-26 | 17-25 | 17-24 |
| Leukogram | |||||||||||||||
| TLC (103/mm 3) | 18.27± 3.92 | 16.82± 1.69 | 19.37±4 .13 | 21.12±3 .01 | 22.82±3 .08 | 19.92± 3.93 | 16.63±2 .34 | 15.72±2 .30 | 17.40±1 .85 | 18.25±1 .41 | 20.04± 2.33 | 17.86± 2.60 | 18.82± 3.56 | 20.52± 3.91 | 19.90± 4.06 |
| Range | 10.60- 36.15 | 11.20- 22.60 | 10.90- 38.70 | 12.90- 34.20 | 14.30- 33.40 | 9.96- 33.15 | 9.60- 24.10 | 8.80- 23.10 | 11.20- 22.40 | 14.70- 23.70 | 13.60- 27.05 | 11.25- 28.45 | 10.70- 33.50 | 13.80- 37.70 | 10.60- 35.80 |
| Lympho cyte (%) | 53.67a ±3.50 | 47.17a A ±4.75 | 44.33aA ±2.88 | 40.17bB ±1.25 | 41.33bB ±2.33 | 50a±1. 83 | 44.50aB ±3.83 | 42.50aA ±2.50 | 35.83bB ±1.33 | 32bB±1. 57 | 52.50± 5.35 | 56.17A ±6.03 | 51A±2. 07 | 51.33A ±1.61 | 53.17A ±1.52 |
| Range | 41-63 | 30-64 | 38-54 | 37-44 | 34-48 | 45-56 | 33-54 | 34-52 | 32-41 | 27-36 | 31-70 | 32-73 | 43-58 | 47-57 | 49-59 |
| Neutroph ils (%) | 40.17a ±3.58 | 43.67a A±4.51 | 47.83aA ±2.52 | 51.67bB ±1.09 | 52.33bB ±2.20 | 43.50a ±1.48 | 47.50aA ±3.97 | 49.50aB ±2.49 | 56.83bB ±1.22 | 60.50bB ±1.91 | 41.00± 5.43 | 38.00A ±5.24 | 41.17A ±2.81 | 39.83A ±2.32 | 38.17A ±1.58 |
| Range | 32-54 | 32-61 | 40-56 | 49-56 | 47-59 | 37-48 | 37-60 | 41-58 | 53-61 | 55-67 | 23-62 | 23-58 | 33-52 | 31-47 | 32-43 |
| Eosinoph ils (%) | 2.17±0 .31 | 3.83±0 .87 | 4.50±0. 62 | 4.00±0. 45 | 2.50±0. 34 | 2.17±1. 01 | 2.33±0. 56 | 3.83±0. 65 | 3.17±0. 31 | 3.17±0. 79 | 2.17±0 .83 | 2.00±0. 73 | 3.67±0. 80 | 3.50±0. 43 | 3.50±0. 92 |
| Range | 1-3 | 2-8 | 3-7 | 3-6 | 1-3 | 0-7 | 1-5 | 2-6 | 2-4 | 1-6 | 1-6 | 0-5 | 1-6 | 2-5 | 1-6 |
| Basophil s (%) | 0.50±0 .22 | 0.33±0 .21 | 0.17±0. 17 | 0 | 0.17±0. 17 | 0.33±0. 21 | 0.33±0. 21 | 0.17±0. 17 | 0 | 0 | 0 | 0 | 0.33±0. 21 | 0.50±0. 22 | 0.50±0. 22 |
| Range | 0-1 | 0-1 | 0-1 | 0 | 0-1 | 0-1 | 0-1 | 0-1 | 0 | 0 | 0 | 0 | 0-1 | 0-1 | 0-1 |
| Monocyt es (%) | 3.50±0 .56 | 5.00±0 .63 | 3.17±0. 79 | 4.17±0. 65 | 3.67±0. 67 | 4.00±0. 58 | 5.33±0. 49 | 4.00±0. 58 | 4.17±0. 70 | 4.33±0. 49 | 4.17±0 .83 | 3.83±0. 70 | 3.83±0. 83 | 4.67±0. 88 | 4.67±0. 42 |
| Range | 2-6 | 2-6 | 1-6 | 2-6 | 2-6 | 2-6 | 3-6 | 2-6 | 1-6 | 3-6 | 2-6 | 2-7 | 1-6 | 1-7 | 3-6 |
Table text extracted from the original PDF; superscript letters are shown inline. The original table image is below.
View original table image
| Parameters | Healthy animal (Group-D) | Treated group (Group-A) | — | Treated group (Group-B) | — | Untreated group (Group-C) | — |
|---|---|---|---|---|---|---|---|
| 0th day | 60th day | 0th day | 60th day | 0th day | 60th day | ||
| Serum protein profile | |||||||
| T.P. (gm/dl) | 7.83C±0.36 | 6.08D±0.18 | 6.97D±0.22 | 5.51D±0.24 | 7.52C±0.36 | 6.26D±0.13 | 6.50D±0.28 |
| Albumin (gm/dl) | 3.56±0.22 | 3.48±0.11 | 3.42±0.10 | 3.04±0.12 | 3.64±0.18 | 3.22±0.10 | 3.48±0.13 |
| Globulin (gm/dl) | 3.66C ±0.20 | 2.59D ±0.12 | 3.55C±0.13 | 2.47D ±0.16 | 3.88C±0.19 | 3.03D±0.08 | 3.01D±0.18 |
| A/G (ratio) | 1.04C | 1.36D | 0.97C | 1.26D | 0.94C | 1.07C | 1.17D |
| Liver enzymes | |||||||
| SGOT/AST (IU/L) | 55.24 ±6.45 | 43.66 ±8.90 | 50.97 ±9.08 | 71.48 ±4.87 | 63.26 ±8.41 | 46.00±8.87 | 60.37±10.25 |
| SGPT/ALT (IU/L) | 12.35 ±1.33 | 7.86±0.98 | 10.40 ±1.31 | 10.38 ±0.80 | 9.24±0.57 | 8.41±1.71 | 9.89±0.95 |
| ALKP (IU/L) | 169.47 ±7.89 | 152.48 ±18.96 | 136.76 ±16.29 | 181.13 ±17.22 | 195.06 ±11.72 | 141.46 ±17.26 | 169.69 ±22.27 |
Table text extracted from the original PDF; superscript letters are shown inline. The original table image is below.
View original table image
| Parameter | Treated group (Group-A) | — | — | — | — | Treated group (Group-B) | — | — | — | — | Untreated group (Group-C) | — | — | — | — |
|---|---|---|---|---|---|---|---|---|---|---|---|---|---|---|---|
| 0th day | 15th day | 30th day | 45th day | 60th day | 0th day | 15th day | 30th day | 45th day | 60th day | 0th day | 15th day | 30th day | 45th day | 60th day | |
| T.P. (gm/dl) | 6.08a±0. 18 | 6.30aA± 0.22 | 6.46aA±0 .22 | 6.82bA± 0.19 | 6.97bA±0 .22 | 5.51a±0. 24 | 6.13bA±0 .14 | 6.50bA±0 .22 | 7.01bB±0 .28 | 7.52bB±0 .36 | 6.26±0.1 3 | 6.26A±0. 09 | 6.34A±0. 13 | 6.41A±0. 19 | 6.50A±0 .28 |
| Range | 5.22- 6.38 | 5.66- 7.28 | 5.75- 7.34 | 6.38- 7.47 | 6.31- 7.69 | 4.44- 6.22 | 5.88- 6.78 | 6.03- 7.47 | 6.22- 7.84 | 6.34- 8.34 | 5.81- 6.59 | 6.03- 6.59 | 5.94- 6.84 | 5.78- 7.13 | 5.56- 7.44 |
| Albumin (gm/dl) | 3.48±0. 11 | 3.45±0. 14 | 3.44±0.1 2 | 3.48±0. 10 | 3.42±0.1 0 | 3.04±0.1 2 | 3.25±0.0 9 | 3.35±0.1 1 | 3.52 ±0.13 | 3.64±0.1 8 | 3.22±0.1 0 | 3.30±0.0 8 | 3.34±0.0 8 | 3.42±0.1 1 | 3.48±0. 13 |
| Range | 3.05- 3.81 | 2.97- 3.97 | 3.05- 3.93 | 3.26- 3.89 | 3.19- 3.75 | 2.69- 3.55 | 2.97- 3.62 | 3.02- 3.79 | 3.19- 3.96 | 3.05- 4.13 | 2.97- 3.57 | 3.05- 3.57 | 3.11- 3.72 | 3.15- 3.83 | 3.16- 3.88 |
| Globulin (gm/dl) | 2.59a±0. 12 | 2.85aA± 0.10 | 3.02bA±0 .10 | 3.34bA± 0.09 | 3.55bB±0 .13 | 2.47a±0. 16 | 2.87bA±0 .10 | 3.15bA±0 .16 | 3.49bB±0 .17 | 3.88aB±0 .19 | 3.03±0.0 8 | 2.96A±0. 05 | 2.99A±0. 06 | 2.99A±0. 11 | 3.01A±0 .18 |
| Range | 2.17- 2.94 | 2.58- 3.31 | 2.70- 3.41 | 3.10- 3.60 | 3.12- 3.94 | 1.75- 2.91 | 2.60- 3.16 | 2.79- 3.68 | 2.97- 4.08 | 3.27- 4.22 | 2.84- 3.37 | 2.83- 3.11 | 2.83- 3.20 | 2.63- 3.29 | 2.40- 3.58 |
| A/G (ratio) | 1.36a | 1.22bA | 1.14bA | 1.04bA | 0.97bA | 1.26a | 1.14bA | 1.08bA | 1.02bB | 0.94bB | 1.07 | 1.11A | 1.12A | 1.15A | 1.17A |
| Liver Enzymes | |||||||||||||||
| SGOT/AS T (IU/L) | 43.66±8 .90 | 46.44±7 .32 | 52.65±7. 30 | 48.51±6 .42 | 50.97±9. 08 | 71.48±4. 87 | 68.74±3. 46 | 67.26±7. 23 | 66.94±7. 35 | 63.26±8. 41 | 46.00±8. 87 | 56.71±8. 75 | 62.16±1 1.30 | 59.16±1 0.68 | 60.37±1 0.25 |
| Range | 21.91- 79.18 | 27.15- 69.72 | 37.74- 78.48 | 26.63- 66.96 | 34.92- 85.38 | 49.67- 84.86 | 56.48- 81.36 | 34.13- 87.30 | 33.17- 80.58 | 30.99- 81.63 | 24.01- 72.39 | 36.49- 89.31 | 32.65- 95.68 | 30.47- 88.16 | 33.26- 90.01 |
| SGPT/ALT (IU/L) | 7.86±0. 98 | 7.35±0. 81 | 8.45±1.0 0 | 9.63±0. 54 | 10.40±1. 31 | 10.38±0. 80 | 10.21±0. 88 | 9.84±0.7 4 | 9.73±0.9 3 | 9.24±0.5 7 | 8.41±1.7 1 | 9.80±1.0 5 | 9.63±1.0 4 | 10.44±1. 0 | 9.89±0. 95 |
| Range | 4.37- 11.61 | 5.06- 10.39 | 4.71- 11.71 | 7.94- 11.82 | 5.94- 13.62 | 8.29- 13.01 | 7.19- 12.45 | 7.25- 12.13 | 7.07- 13.18 | 7.07- 10.56 | 4.28- 15.71 | 6.71- 13.88 | 6.11- 12.77 | 6.55- 13.53 | 7.63- 13.44 |
| ALKP(IU/ L) | 152.48± 18.96 | 143.03± 14.98 | 152.00± 19.82 | 154.50± 19.22 | 136.76± 16.29 | 181.13± 17.22 | 190.07± 9.35 | 177.81± 9.60 | 191.19± 6.29 | 195.06± 11.72 | 141.46± 17.26 | 154.20± 16.22 | 178.85± 13.82 | 179.81± 17.75 | 169.69± 22.27 |
| Range | 91.94- 214.06 | 91.12- 187.54 | 100.37- 209.30 | 81.33- 218.28 | 104.73- 193.94 | 103.22- 220.73 | 167.54- 227.26 | 154.22- 217.79 | 176.80- 219.29 | 150.38- 228.48 | 86.360- 180.34 | 100.50- 196.93 | 145.38- 225.49 | 113.56- 235.96 | 96.83- 244.12 |
Table text extracted from the original PDF; superscript letters are shown inline. The original table image is below.
View original table image
References
18 in the original paper- Al-Ali AK, Husayni HA, Power DM. A comprehensive biochemical analysis of blood of the camel (Camelus dromedarius). Comp Biochem Physiol. 1988;1:35-37.
- Alhadrami GA. Comparative haematology in the camel calf and adult racing camel (Camelus dromedarius). J Camel Pract Res. 1997;4:13.
- Aytekin I, Onmaz AC, Aypak SU, Gunes V, Kucuk O. Changes in serum minerals concentration, biochemical and hematological parameters in horses with pica. Biol Trace Elem Res. 2011;139(3):301-307.
- Beniwal BS, Singh RP. Haemato-biochemical changes in camels suffering from pica. Ann Agri. Bio Res. 2007;12:83-86.
- Fahmy F, Amer AA, Abd-el-Aziz H, Abd-el-Roaf M. Wool as an effective tool of some deficiency diseases. Assiut Vet Med J. 1980;7(13/14):262-270.
- Firyal S. Pica (depraved appetite; allotrophagia) in domestic extension article animals and man. Pak Vet J. 2007;27(4):208-210.
- Ghodrian I, Nowrouzian I, Schels HF. A study of some haematological parameters in the Iranian camel. Trop Anim Health Prod. 1978;10(2):109-110.
- Gorakhmal, Suchitra Sena D, Kumar R, Sahani MS. Haematological and mineral profile of Bactrian and dromedary camels. Indian J Anim. Sci. 2001;71(2):1162-1163.
- Jain NC. Schalm's Veterinary Haematology, 4 th edn. Lea and Febiger, Philadelphia. 1986. p. 15-81, 356-404.
- M.V. Sc. Thesis, submitted to RAJUVAS, Bikaner. 2019.
- Mali MM. Clinico-therapeutic studies on gastrointestinal disorder in camels (Camelus dromedarius). M.V.Sc. thesis submitted to RAU, Bikaner. 2002.
- Musa BE, Mukhtar AM. Studies on normal haemogram and some blood electrolyte in camels (Camelus dromedaries). Sudan J Vet Sci. Anim. Husb. 1982;23:38-43.
- Nassar SM, Mansour SA, Lofti LA. Influence of sex on the normal blood picture of adult Egyptian camel (Camelus dromedarius). Assiut Vet Med J. 1977;4:4350.
- Rezakhani A, Nazifi HS, Maghrebi MG. Studies on normal haematological and biochemical parameter of Turkmen camel in Iran. J Camel Pract Res. 1997;4(1):41-44.
- Salaheldin Abdel Gadir E, Wahabi AA, Idris OF. A note on haematology of Sudanese camels. Paper presented at the workshop on "Camels." Khartoum, Sudan. IFS Provensial report. 1979;6:384-354.
- Singh KP, Malik KS, Sarup S. Haemato-biochemical studies in camel suffering from pica. Indian J Vet Med. 1986;6:79-81.
- Singh R, Mishra BP, Suchitra Sena D, Sahani MS. Biochemical attributes of the double humped camel of Ladakh. Indian J Anim. Sci. 2000;70(1):54-55.
- Soliman MK, Shaker M. Cytological and biochemical studies on the blood of adult She camel. Indian Vet J. 1967;44:989-995.