
Research article · 2024 · Full text
International Journal of Agriculture Extension and Social DevelopmentDevelopment of a scale to measure the attitude of beneficiaries towards entrepreneurship development programmes
Volume 7(1) · Pages 436–441 · DOI: 10.33545/26180723.2024.v7.i1f.244 ↗
Research areasEntrepreneurship Studies and Influences
Abstract
Author-writtenThis paper narrates the entire methodology adopted for developing a scale to measure the attitude of beneficiaries towards entrepreneurship development programmes. The Likert’s summated rating method was used to construct the scale. A comprehensive list of 100 statements was developed by thoroughly reviewing the literature and expert consultation. These items were subjected to a relevancy test by sending it for expert content evaluation. Based on the relevancy percentage (RP), relevancy weightage (RW) and mean relevancy score (MRS), 72 items were screened out for item analysis. The scale was administered to 32 beneficiaries of various entrepreneurship programmes. The internal consistency check using Cronbach’s alpha was used to ensure the reliability of the proposed scale, and a value of 0.84 was obtained, indicating higher reliability. The scale developed finally consists of 20 statements, of which 14 are positive and six are negative. The standardized scale has practical applicability in measuring the attitude of beneficiaries towards entrepreneurship development programmes.
Summary
Source-checkedPlain-language reading of the full paper, prepared with AI and checked against the text. Each point links to the authors' own words.
Why it matters
- Micro, small, and medium enterprises (MSMEs) are globally recognized as essential drivers for poverty alleviation and economic growth. View evidence ↗
- Agricultural entrepreneurship specifically supports rural livelihoods by boosting productivity and creating jobs through technological innovation and crop diversification. View evidence ↗
- The attitude of beneficiaries is critical because it influences how they respond to incentives and challenges, which in turn affects the success of entrepreneurship development programmes (EDPs). View evidence ↗
The question
- The study aimed to create and validate a standardized scale to measure the attitudes of beneficiaries toward entrepreneurship development programmes. View evidence ↗
What they did
- The researchers used Likert's summated rating method to construct the attitude scale. View evidence ↗
- An initial pool of 100 statements was generated through expert consultation and a thorough review of existing literature. View evidence ↗
- Content validation involved a relevancy test where 32 valid responses from a group of experts were used to evaluate the initial statements. View evidence ↗
- The scale was pilot-tested by collecting responses from 32 non-respondents. View evidence ↗
What they found
- Following the relevancy test (based on RP, RW, and MRS), 72 of the original 100 statements were selected for further analysis. View evidence ↗
- The final scale demonstrated high reliability with a Cronbach's alpha value of 0.84. View evidence ↗
- The internal consistency of the scale was categorized as 'good' based on the calculated alpha value of 0.84. View evidence ↗
What it means
- The authors conclude that the developed scale is reliable and valid for measuring beneficiary attitudes toward EDPs using a five-point continuum. View evidence ↗
- The authors suggest that the scale should be validated in other populations to improve its general applicability. View evidence ↗
Visual summary
1 visualsIllustrations explain the paper; they do not show study data.

Scale Development Pipeline
AI-generated conceptual illustration (A conceptual pipeline of document filtration). It explains the idea and does not show study data.
View source evidence ↗Figures & tables
From the original paper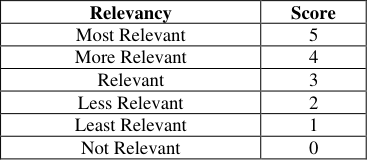 Table 1
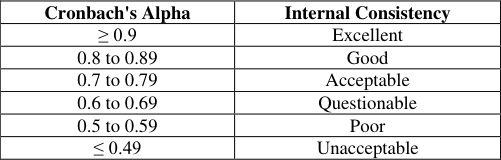 Table 2
 Table 3
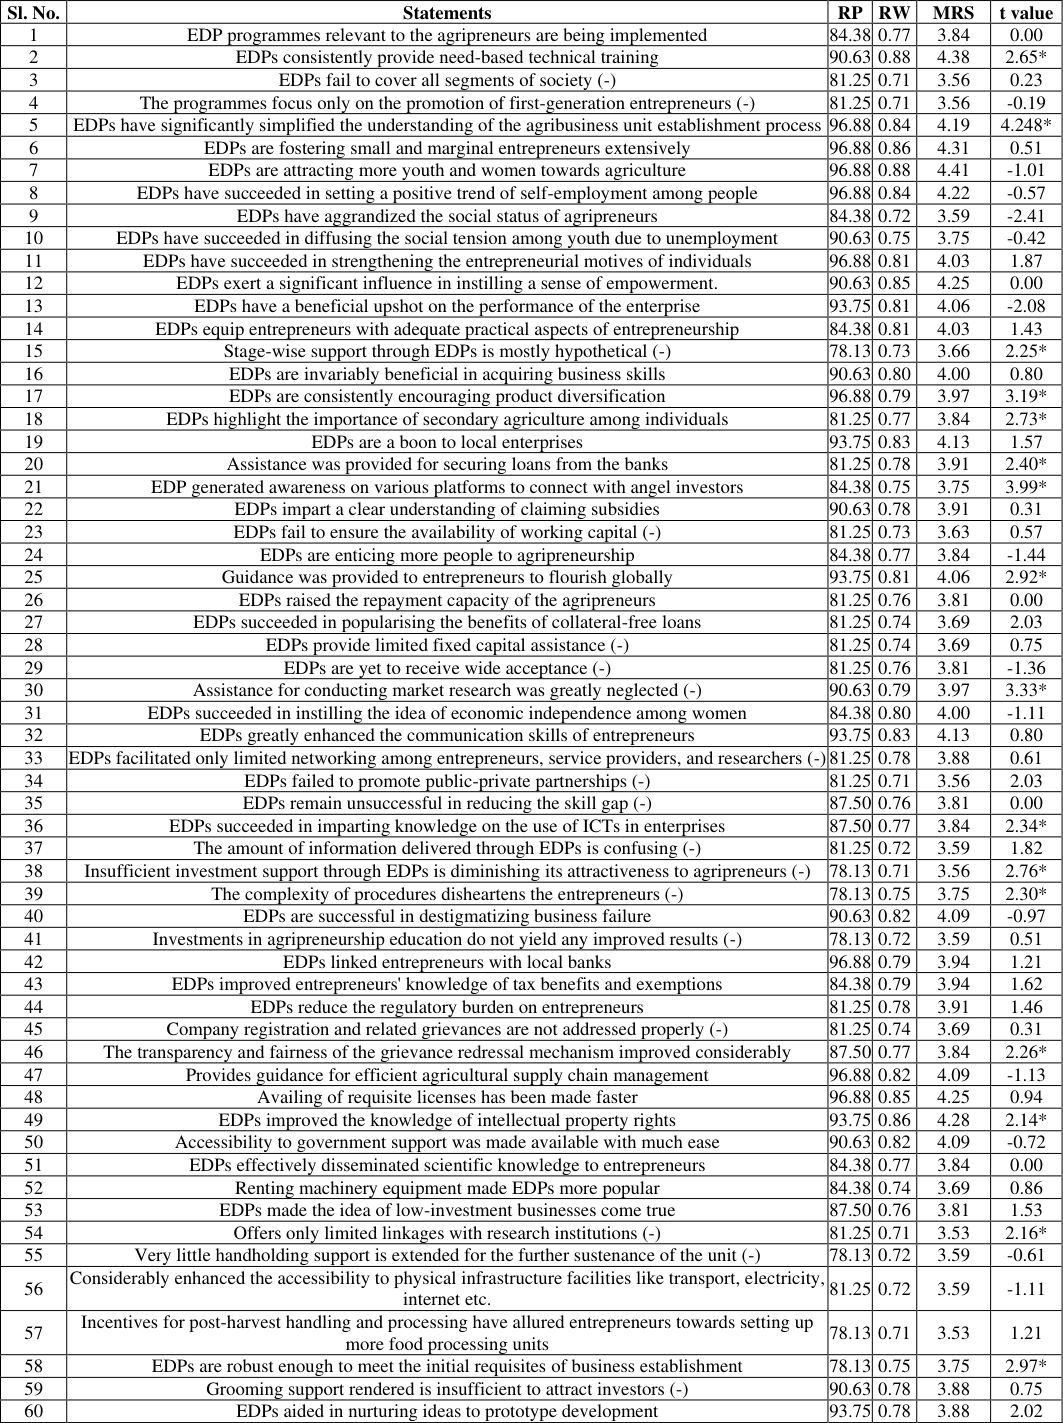 Table 4
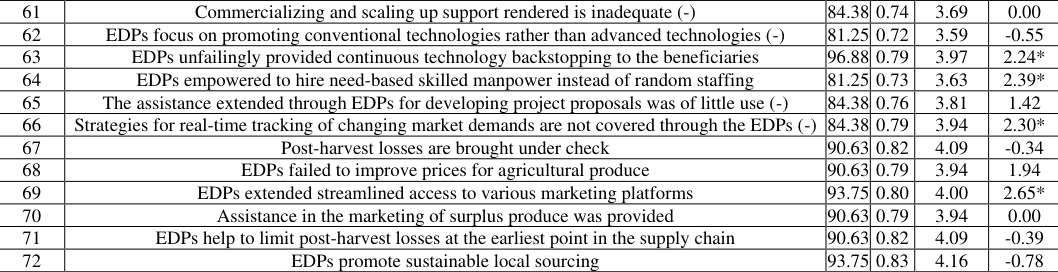 Table 5
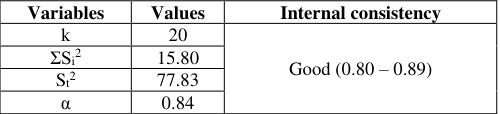 Table 5
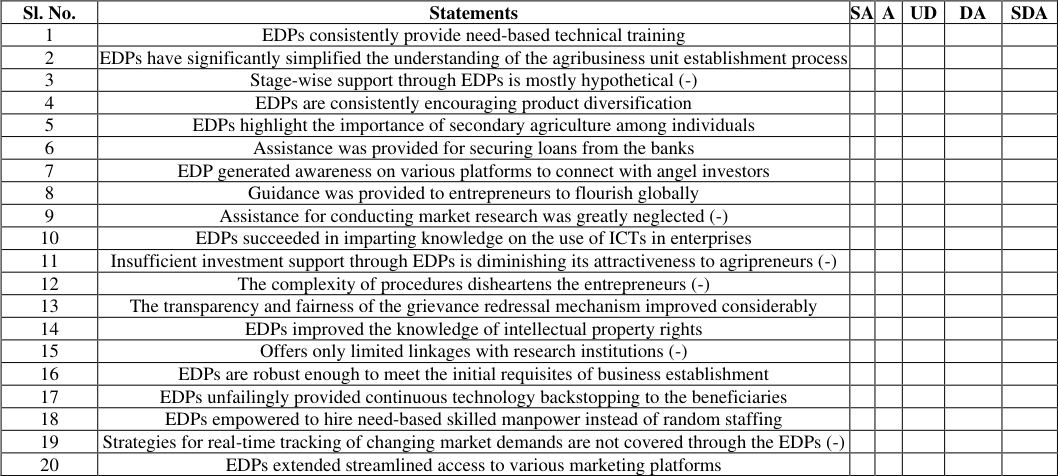 Table 6
Introduction
Across the world, the establishment of micro, small, and medium enterprises (MSMEs) is recognized as a key driver for economic development, transformative growth, and a means to alleviate poverty (UNDESA, 2020) [1] . Studies worldwide identify entrepreneurship as the most important strategy in creating jobs, boosting income, and fostering sustainable development, especially in economies that are slightly behind their modern industrial counterparts (Ayat, 2020) [2] . Entrepreneurship plays a vital role in economic and social development, particularly in the field of agriculture. Innovative agri-entrepreneurship enhances market dynamics, diversifies crops, and introduces technologies, boosting productivity. This not only generates jobs but also sustains rural communities and livelihoods (Pan et al., 2017) [3] . Recognizing the significance of entrepreneurship development policymakers including international organizations like the United Nations and its agencies like the International Fund for Agriculture Development (IFAD), are increasingly investing in entrepreneurship development in developing and underdeveloped countries to spur their economic and social progress (UN Ghana, 2017) [4] . Similarly, to foster entrepreneurship and to nurture and sharpen the entrepreneurial qualities of budding entrepreneurs, numerous entrepreneurship development programmes (EDPs) are being organized by various agencies in India. As a result, Kerala, a small southern state of this sub-continent is witnessing a surge in entrepreneurial activities especially in agriculture and allied sectors. Kerala, popular for its unique model of development was also a pioneer in formulating its entrepreneurship policy way back in 2014 (KSUM, 2018) [5] . Entrepreneurship promotion is high on the agenda of the key designated actors like the Kerala State Industrial Development Corporation (KSIDC), Small Farmers Agribusiness Consortium (SFAC), incubation centres of Kerala Agricultural University, Startup Mission, and the National Bank for Agriculture and Rural Development (NABARD). From 2016-17 to 2020-21, among the micro, small and medium enterprise (MSME) units operating in Kerala, those engaged in the agriculture and food sector alone recorded a growth rate of 6.70 percent compared to the negative growth rate of all other sectors as well to the overall negative growth rate of seven percent (KSPB, 2022) [6] . EDPs by design are supposed to help farmers transform into successful entrepreneurs in agriculture (hereafter termed agripreneurs). However, this purpose would not be served if the trainees were not provided with the necessary support after training. They must be given orientation on the support that could be provided through different institutions. It is also important to devise effective linkages to make them available at appropriate times. Agripreneurs require not only training, but also access to land, financial, technological, infrastructural, and other essential support to start a business and sustain it successfully (Daniela et al., 2015; www.extensionjournal.com Dobrodomova et al., 2020; Thephavanh, 2023) [7,9] . It has been observed that any robust entrepreneurial ecosystem would ensure this support mechanism effectively. EDPs should also build up the trust of entrepreneurs in the reliability and efficiency of the support providing agencies, The increasing reliance of entrepreneurs on government agencies is an indication of the trust of people in the reliability of public systems (Eesley and Lee, 2022) [10] . The efforts of the government to boost agripreneurship should necessarily influence the attitude of entrepreneurs towards agri-entrepreneurship development programmes. Since attitude influences an individual's choice of action and responses to challenges, incentives, and rewards (Tripathi, 2015) [11] , a seemingly positive shift in the attitude of the beneficiaries of EDPs should lead to the overall success of the entrepreneurship drive. Analysis of entrepreneurs' attitude towards EDPs would also act as valuable input for the policymakers to assess the needs of the beneficiaries and the effectiveness of implemented programmes. High positive attitude may indicate that the programmes have achieved their intended outcomes, while negative attitudes may point towards a need for further reform or modification. Considering the importance of measuring attitude in determining the effectiveness of EDPs, the present research work intended to develop and validate an attitude scale for measuring the attitude of beneficiaries towards EDPs. This scale can be used to evaluate the attitude of beneficiaries towards different types of support provided through EDPs.
Materials and Methods
Attitude has been defined as the degree of positive or negative affect associated with some psychological object (Thurstone, 1946) [12] . It is the degree of positive or negative feeling, opinion, action, and belief associated with some psychological object. In this study, attitude is operationally defined as the degree of positive or negative feelings of the beneficiaries towards various aspects of entrepreneurship development programmes implemented through various public sector institutions in Kerala. We have used the summated rating scale, which is the most popular scale preferred by researchers for developing the scale to measure attitude towards entrepreneurship development. The steps followed in the construction of Likert's type scale are as follows (Garai et al., 2021; Mukherjee et al., 2018) [13] & [14] .
Item generation or collection of statements from
different sources Item generation is an imperative step in the development stage of an instrument (Hinkin, 1995) [15] . A pool of items which are relevant and reflective of the attitude being investigated was gathered through an exhaustive literature review, examination of government orders, description of schemes, and expert consultation.
Editing of statements
After the preparation of statements, each statement was checked and edited to reduce ambiguity using various informal criteria for editing statements to be used in the construction of attitude scales (Thurstone and Chave, 1929; Edwards and Kilpatrick, 1948; Edwards, 1969) [16,18] .
Relevancy test
The selected statements were sent to experts or judges through personal contact and Google forms with a request to check the relevancy of each statement on a six-point continuum viz. 'most relevant' to 'not relevant' (Table 1). Based on the scores given and the suggestions made by the experts, modifications were made and statements were selected.
| Relevancy | Score |
|---|---|
| Most Relevant | 5 |
| More Relevant | 4 |
| Relevant | 3 |
| Less Relevant | 2 |
| Least Relevant | 1 |
| Not Relevant | 0 |
Table text extracted from the original PDF; superscript letters are shown inline. The original table image is below.
View original table image
Selection of items
The responses of the judges were tabulated and analysed to work out "Relevancy percentage (RP)," "Relevancy weightage (RW)" and "Mean relevancy score (MRS)" for all the statements, based on which the statements were selected. The methods of estimation of these values are explained below.
Relevancy percentage (RP):
It was worked out by summing up the scores of the 'most relevant,' 'more relevant' and 'relevant' categories which were converted into percentages
Relevancy weightage (RW):
It is the ratio of actual score obtained to the maximum possible obtainable score by each respondent.
Mean relevancy score (MRS):
It was obtained by the standard formula
Pilot study
A pilot study was done by collecting the responses of a group of non-respondents employing the selected statements, on a five-point continuum ranging from 'strongly agree' to 'strongly disagree' with a score of 5, 4, 3, 2, and 1, respectively for positive statements and reverse scores for negative statements.
Item analysis
Each item or statement was analysed for its suitability to be included in the final scale. For this purpose, 't -value' method was used. The frequency distribution of scores based on the response to all the statements was considered. www.extensionjournal.com
The steps to be followed to calculate the t-value (Edwards, 1969) [18] are as follows: The value of "t" is a measure of the extent to which a given statement differentiates between high and low criterion groups. As a crude and approximate rule of thumb, statements with "t" value equal to or greater than 1.75 are considered for inclusion in the scale. This value indicates that the average response of the high and low-criterion groups to a statement differ significantly.
Reliability testing of the scale
Reliability of a scale is a statistical measure of the reproducibility of the instrument (Litwin, 1995) [19] and can be equated with its stability, consistency, and dependability. Internal consistency is a widely used method of testing for reliability (Polit and Hungler, 1995) [20] and Cronbach's alpha' (or 'coefficient alpha') is considered as the best estimate of measuring the internal consistency (Nunally, 1967) [21] . It is calculated using the formula.
Where, α -Cronbach's alpha kthe number of items S i 2 -the sum of variance of every item S t 2 -the variance of the total scale As a rule of thumb, a Cronbach's alpha of 0.70 to 0.79 is considered acceptable for a scale for research use and a value more than 0.79 is considered good (Table 2) (Mohd Arof et al., 2018) [22] .
| Cronbach's Alpha | Internal Consistency |
|---|---|
| ≥ 0.9 | Excellent |
| 0.8 to 0.89 | Good |
| 0.7 to 0.79 | Acceptable |
| 0.6 to 0.69 | Questionable |
| 0.5 to 0.59 | Poor |
| ≤ 0.49 | Unacceptable |
Table text extracted from the original PDF; superscript letters are shown inline. The original table image is below.
View original table image
Validity of the scale
The validity of a scale is the accuracy with which an instrument measures what it is intended to measure. The contents of this attitude scale were derived through an exhaustive literature review covering all relevant aspects and considering the opinion of concerned subject matter specialists. All the scale construction steps were carefully followed.
Administration of the scale
The final standardized scale would measure the attitude of beneficiaries towards entrepreneurship development programmes. The scale can be administered on a five-point continuum ranging from, "Strongly agree, Agree, Undecided, Disagree and Strongly disagree" with scores 5 to 1 for positive statements and vice versa for negative statements. According to the scores obtained through the summated rating approach, the agripreneurs were categorized into different categories based on their attitude towards EDPs using mean and standard deviation (SD) (Table 3).
| Sl. No. | Criteria | Category |
|---|---|---|
| 1 | < Mean - SD | Low |
| 2 | Mean - SD to Mean + SD | Medium |
| 3 | > Mean + SD | High |
Table text extracted from the original PDF; superscript letters are shown inline. The original table image is below.
View original table image
Results and Discussion
Results and Discussion
Collection and editing of statements
After a thorough literature review, expert consultation, and going through the guidelines of various entrepreneurship development programmes 100 statements relevant enough to measure the attitude of agripreneurs were framed. Editing and screening were done following the 14 principles for framing the statements for attitude scale construction.
Relevancy test
For the content validation, the 100 statements selected were sent to 50 experts through personal contact and Google forms. Out of which 36 experts responded, of which 4 were incomplete and therefore eliminated; and finally, only 32 forms were considered for the relevancy test. Based on the response made, the relevancy percentage (RP), relevancy weightage (RW) and mean relevancy score (MRS) were calculated for all the 100 statements. The calculated value of RP, RW and MRS was found in the range of 71.88 to 96.88; 0.68 to 0.88; and 3.53 to 4.41 percentages respectively. The statements with RP ≥ 78. 13, RW ≥ 0.72 and MRS ≥ 3.53 were considered for final selection. By this process out of the total 100 statements, 72 statements were selected and a questionnaire was prepared (Table 4). www.extensionjournal.com
| Sl. No. | Statements | RP | RW | MRS | t value |
|---|---|---|---|---|---|
| 1 | EDP programmes relevant to the agripreneurs are being implemented | 84.38 | 0.77 | 3.84 | 0.00 |
| 2 | EDPs consistently provide need-based technical training | 90.63 | 0.88 | 4.38 | 2.65* |
| 3 | EDPs fail to cover all segments of society (-) | 81.25 | 0.71 | 3.56 | 0.23 |
| 4 | The programmes focus only on the promotion of first-generation entrepreneurs (-) | 81.25 | 0.71 | 3.56 | -0.19 |
| 5 | EDPs have significantly simplified the understanding of the agribusiness unit establishment process | 96.88 | 0.84 | 4.19 | 4.248* |
| 6 | EDPs are fostering small and marginal entrepreneurs extensively | 96.88 | 0.86 | 4.31 | 0.51 |
| 7 | EDPs are attracting more youth and women towards agriculture | 96.88 | 0.88 | 4.41 | -1.01 |
| 8 | EDPs have succeeded in setting a positive trend of self-employment among people | 96.88 | 0.84 | 4.22 | -0.57 |
| 9 | EDPs have aggrandized the social status of agripreneurs | 84.38 | 0.72 | 3.59 | -2.41 |
| 10 | EDPs have succeeded in diffusing the social tension among youth due to unemployment | 90.63 | 0.75 | 3.75 | -0.42 |
| 11 | EDPs have succeeded in strengthening the entrepreneurial motives of individuals | 96.88 | 0.81 | 4.03 | 1.87 |
| 12 | EDPs exert a significant influence in instilling a sense of empowerment. | 90.63 | 0.85 | 4.25 | 0.00 |
| 13 | EDPs have a beneficial upshot on the performance of the enterprise | 93.75 | 0.81 | 4.06 | -2.08 |
| 14 | EDPs equip entrepreneurs with adequate practical aspects of entrepreneurship | 84.38 | 0.81 | 4.03 | 1.43 |
| 15 | Stage-wise support through EDPs is mostly hypothetical (-) | 78.13 | 0.73 | 3.66 | 2.25* |
| 16 | EDPs are invariably beneficial in acquiring business skills | 90.63 | 0.80 | 4.00 | 0.80 |
| 17 | EDPs are consistently encouraging product diversification | 96.88 | 0.79 | 3.97 | 3.19* |
| 18 | EDPs highlight the importance of secondary agriculture among individuals | 81.25 | 0.77 | 3.84 | 2.73* |
| 19 | EDPs are a boon to local enterprises | 93.75 | 0.83 | 4.13 | 1.57 |
| 20 | Assistance was provided for securing loans from the banks | 81.25 | 0.78 | 3.91 | 2.40* |
| 21 | EDP generated awareness on various platforms to connect with angel investors | 84.38 | 0.75 | 3.75 | 3.99* |
| 22 | EDPs impart a clear understanding of claiming subsidies | 90.63 | 0.78 | 3.91 | 0.31 |
| 23 | EDPs fail to ensure the availability of working capital (-) | 81.25 | 0.73 | 3.63 | 0.57 |
| 24 | EDPs are enticing more people to agripreneurship | 84.38 | 0.77 | 3.84 | -1.44 |
| 25 | Guidance was provided to entrepreneurs to flourish globally | 93.75 | 0.81 | 4.06 | 2.92* |
| 26 | EDPs raised the repayment capacity of the agripreneurs | 81.25 | 0.76 | 3.81 | 0.00 |
| 27 | EDPs succeeded in popularising the benefits of collateral-free loans | 81.25 | 0.74 | 3.69 | 2.03 |
| 28 | EDPs provide limited fixed capital assistance (-) | 81.25 | 0.74 | 3.69 | 0.75 |
| 29 | EDPs are yet to receive wide acceptance (-) | 81.25 | 0.76 | 3.81 | -1.36 |
| 30 | Assistance for conducting market research was greatly neglected (-) | 90.63 | 0.79 | 3.97 | 3.33* |
| 31 | EDPs succeeded in instilling the idea of economic independence among women | 84.38 | 0.80 | 4.00 | -1.11 |
| 32 | EDPs greatly enhanced the communication skills of entrepreneurs | 93.75 | 0.83 | 4.13 | 0.80 |
| 33 | EDPs facilitated only limited networking among entrepreneurs, service providers, and researchers (-) | 81.25 | 0.78 | 3.88 | 0.61 |
| 34 | EDPs failed to promote public-private partnerships (-) | 81.25 | 0.71 | 3.56 | 2.03 |
| 35 | EDPs remain unsuccessful in reducing the skill gap (-) | 87.50 | 0.76 | 3.81 | 0.00 |
| 36 | EDPs succeeded in imparting knowledge on the use of ICTs in enterprises | 87.50 | 0.77 | 3.84 | 2.34* |
| 37 | The amount of information delivered through EDPs is confusing (-) | 81.25 | 0.72 | 3.59 | 1.82 |
| 38 | Insufficient investment support through EDPs is diminishing its attractiveness to agripreneurs (-) | 78.13 | 0.71 | 3.56 | 2.76* |
| 39 | The complexity of procedures disheartens the entrepreneurs (-) | 78.13 | 0.75 | 3.75 | 2.30* |
| 40 | EDPs are successful in destigmatizing business failure | 90.63 | 0.82 | 4.09 | -0.97 |
| 41 | Investments in agripreneurship education do not yield any improved results (-) | 78.13 | 0.72 | 3.59 | 0.51 |
| 42 | EDPs linked entrepreneurs with local banks | 96.88 | 0.79 | 3.94 | 1.21 |
| 43 | EDPs improved entrepreneurs' knowledge of tax benefits and exemptions | 84.38 | 0.79 | 3.94 | 1.62 |
| 44 | EDPs reduce the regulatory burden on entrepreneurs | 81.25 | 0.78 | 3.91 | 1.46 |
| 45 | Company registration and related grievances are not addressed properly (-) | 81.25 | 0.74 | 3.69 | 0.31 |
| 46 | The transparency and fairness of the grievance redressal mechanism improved considerably | 87.50 | 0.77 | 3.84 | 2.26* |
| 47 | Provides guidance for efficient agricultural supply chain management | 96.88 | 0.82 | 4.09 | -1.13 |
| 48 | Availing of requisite licenses has been made faster | 96.88 | 0.85 | 4.25 | 0.94 |
| 49 | EDPs improved the knowledge of intellectual property rights | 93.75 | 0.86 | 4.28 | 2.14* |
| 50 | Accessibility to government support was made available with much ease | 90.63 | 0.82 | 4.09 | -0.72 |
| 51 | EDPs effectively disseminated scientific knowledge to entrepreneurs | 84.38 | 0.77 | 3.84 | 0.00 |
| 52 | Renting machinery equipment made EDPs more popular | 84.38 | 0.74 | 3.69 | 0.86 |
| 53 | EDPs made the idea of low-investment businesses come true | 87.50 | 0.76 | 3.81 | 1.53 |
| 54 | Offers only limited linkages with research institutions (-) | 81.25 | 0.71 | 3.53 | 2.16* |
| 55 | Very little handholding support is extended for the further sustenance of the unit (-) | 78.13 | 0.72 | 3.59 | -0.61 |
| 56 | Considerably enhanced the accessibility to physical infrastructure facilities like transport, electricity, internet etc. | 81.25 | 0.72 | 3.59 | -1.11 |
| 57 | Incentives for post-harvest handling and processing have allured entrepreneurs towards setting up more food processing units | 78.13 | 0.71 | 3.53 | 1.21 |
| 58 | EDPs are robust enough to meet the initial requisites of business establishment | 78.13 | 0.75 | 3.75 | 2.97* |
| 59 | Grooming support rendered is insufficient to attract investors (-) | 90.63 | 0.78 | 3.88 | 0.75 |
| 60 | EDPs aided in nurturing ideas to prototype development | 93.75 | 0.78 | 3.88 | 2.02 |
Table text extracted from the original PDF; superscript letters are shown inline. The original table image is below.
View original table image
Data collection and item analysis
Data were collected from 32 non-respondents. Their responses were marked on a five-point continuum from 'strongly agree' to 'strongly disagree' with a score of 5, 4, 3, 2, and 1, respectively for the positive statement and reverse for the negative statements. The selection of items for the final scale was done after calculating the t-value. Twenty statements with a t-value greater than 2.03 were selected and included in the attitude scale, which included 14 positive and six negative statements (Table 6).
Standardization of the scale
The developed scale was further standardized by establishing its reliability and validity. Cronbach's alpha was found to be 0.84, which is considered as good (Table 5). The content validity of the statements was established through expert consultation during the scale development stage.
| Variables | Values | Internal consistency |
|---|---|---|
| k | 20 | Good (0.80 – 0.89) |
| ΣSi2 | 15.80 | |
| St2 | 77.83 | |
| α | 0.84 |
Table text extracted from the original PDF; superscript letters are shown inline. The original table image is below.
View original table image
| 61 | Commercializing and scaling up support rendered is inadequate (-) | 84.38 | 0.74 | 3.69 | 0.00 |
|---|---|---|---|---|---|
| 62 | EDPs focus on promoting conventional technologies rather than advanced technologies (-) | 81.25 | 0.72 | 3.59 | -0.55 |
| 63 | EDPs unfailingly provided continuous technology backstopping to the beneficiaries | 96.88 | 0.79 | 3.97 | 2.24* |
| 64 | EDPs empowered to hire need-based skilled manpower instead of random staffing | 81.25 | 0.73 | 3.63 | 2.39* |
| 65 | The assistance extended through EDPs for developing project proposals was of little use (-) | 84.38 | 0.76 | 3.81 | 1.42 |
| 66 | Strategies for real-time tracking of changing market demands are not covered through the EDPs (-) | 84.38 | 0.79 | 3.94 | 2.30* |
| 67 | Post-harvest losses are brought under check | 90.63 | 0.82 | 4.09 | -0.34 |
| 68 | EDPs failed to improve prices for agricultural produce | 90.63 | 0.79 | 3.94 | 1.94 |
| 69 | EDPs extended streamlined access to various marketing platforms | 93.75 | 0.80 | 4.00 | 2.65* |
| 70 | Assistance in the marketing of surplus produce was provided | 90.63 | 0.79 | 3.94 | 0.00 |
| 71 | EDPs help to limit post-harvest losses at the earliest point in the supply chain | 90.63 | 0.82 | 4.09 | -0.39 |
| 72 | EDPs promote sustainable local sourcing | 93.75 | 0.83 | 4.16 | -0.78 |
Table text extracted from the original PDF; superscript letters are shown inline. The original table image is below.
View original table image
Administration of the scale
The final standardized scale which would measure the attitude of beneficiaries towards entrepreneurship development programmes consisted of 20 statements (14 positive statements and six negative statements). The scale can be administered on a five-point continuum ranging from, "strongly agree, agree, undecided, disagree and strongly disagree" with scores 5 to 1 for positive statements and vice versa for negative statements (Table 6). EDPs are consistently encouraging product diversification 5
EDPs highlight the importance of secondary agriculture among individuals 6
Assistance was provided for securing loans from the banks 7 EDP generated awareness on various platforms to connect with angel investors 8
Guidance was provided to entrepreneurs to flourish globally 9
Assistance for conducting market research was greatly neglected (-) 10
EDPs succeeded in imparting knowledge on the use of ICTs in enterprises 11
Insufficient investment support through EDPs is diminishing its attractiveness to agripreneurs (-) 12
The complexity of procedures disheartens the entrepreneurs (-) 13 The transparency and fairness of the grievance redressal mechanism improved considerably 14
EDPs improved the knowledge of intellectual property rights 15
Offers only limited linkages with research institutions (-) 16 EDPs are robust enough to meet the initial requisites of business establishment 17
EDPs unfailingly provided continuous technology backstopping to the beneficiaries 18
EDPs empowered to hire need-based skilled manpower instead of random staffing 19
Strategies for real-time tracking of changing market demands are not covered through the EDPs (-) 20
EDPs extended streamlined access to various marketing platforms *SA-Strongly Agree, A-Agree, UD-undecided, DA-Disagree, SDA-Strongly Disagree
Conclusion
The results obtained indicate that the developed scale meets the requirements of reliability and validity and it can be administered on a five-point continuum ranging from 'strongly agree' to 'strongly disagree' to measure the attitude of the beneficiaries of entrepreneurship development programmes towards such programmes. It is suggested to validate the scale in other populations to enhance its use and applicability.
Acknowledgement
www.extensionjournal.com Single Girl Child (SVSGC) Fellowship. This article is largely an outcome of the author's doctoral work sponsored by UGC and conducted at the Kerala Agricultural University. However, the responsibility for the facts stated, opinions expressed and the conclusions drawn is entirely that of the author.
References
23 in the original paper- UNDESA (United Nations Department of Economic and Social Affairs). Exploring youth entrepreneurship. 2020, 44p. [Internet]. Available from: https://sustainabledevelopment.un.org/content/documen ts/26070Youth_Entrepreneurship_23Mar20v2_1.pdf. [Accessed on 05 January 2024].
- Ayat FA. The role of entrepreneurship in agricultural development. J Organ Behav Res. 2020;5. [Internet]. Available from: https://odad.org/article/the-role-ofentrepreneurship-in-agricultural-development. [Accessed on 04 January 2024].
- Pan Y, Zhang S, Zhang M. The impact of entrepreneurship of farmers on agriculture and rural economic growth: Innovation-driven perspective. Innov Green Dev. 2024;3(1). [Internet]. Available from: https://doi.org/10.1016/j.igd.2023.100093. [Accessed on 06 January 2024].
- UN Ghana (United Nations Ghana). Turning Farming into Business through Agricultural Skills and Entrepreneurship Training. 2017. [Internet]. Available from: https://ghana.un.org/en/16050-turning-farmingbusiness-through-agricultural-skills-andentrepreneurship-training [Accessed on 04 January 2024].
- KSUM (Kerala Startup Mission). Kerala Startup Ecosystem Report. 2018. [Internet]. Available from: https://issuu.com/inc42/docs/kerala_startup_report_201
- Accessed on 29 December 2023].
- KSPB (Kerala State Planning Board). Ease of Entrepreneurship in Agriculture: Reforms in Policy and Administration. Agriculture Division, Thiruvananthapuram, 2022.
- Daniela B, Giacomo C, Riccardo F, Maurizio S. Promoting entrepreneurship in the agri-food industry: Policy insights from a pan-European public-private consortium. Ind Innov. 2015;22(8):753-784. [Internet]. Available from: https://doi.org/10.1080/13662716.2015.1113860. [Accessed on 03 January 2024].
- Dobrodomova L, Dzhoraev V, Tutaeva L, Voroshilova L, Dmitrieva. The problems of developing infrastructure that ensures the economic security of small businesses in the agricultural sector (on the example of the Orenburg region). In: XIII Int Sci Pract Conf "State and Prospects for the Development of Agribusiness -INTERAGROMASH 2020" E3S Web Conf. 2020;175.
- Thephavanh M, Philp JNM, Nuberg I, Denton M, Larson S. Perceptions of the institutional and support environment amongst young agricultural entrepreneurs in Laos. Sustainability. 2023;15:4219. [Internet]. Available from: https://doi.org/10.3390/su15054219. [Accessed on 02 January 2024].
- Eesley C, Lee YS. In institutions we trust? Trust in Government and the allocation of entrepreneurial intentions. Organ Sci. 2022;1-25. [Internet]. Available from: https://news.nd.edu/assets/467628/eesley_yong_2022_o rsc.2022.1583.pdf. [Accessed on 04 January 2024].
- Tripathi H. Construction of an attitude scale to measure attitude of M.Ed students of Govt. IASE, Bikaner towards incorporation of e-learning in teaching-learning process. Int J Arts Hum Manage Stud. 2015;01(10):6472.
- Thurstone LL. Comment. Am J Sociol. 1946;52:39-50.
- Garai S, Reddy AK, Maiti S. Likert's summated rating scale. In: Maiti S, Garai R, Mohammad A, Kadian KA, editors. Psychometric Scale Construction Techniques: Basics to Advances. Edn 1, Karnal: ICAR-National Dairy Research Institute, 2021.
- Mukherjee A, Singh P, Satyapriya, Rakshit S, Burman RR. Development and standardization of scale to measure farmer's attitude towards Farmers' Producer Company. Indian J Extension Educ. 2018;54(4):84-90.
- Hinkin TR. A review of scale development practices in the study of organizations. J Manag. 1995;21(5):967988.
- Thurstone LL, Chave EJ. The Measurement of Attitude. University of Chicago Press, Chicago, 1929.
- Edwards AL, Kilpatrick FP. A technique for the construction of attitude scales. J Appl Psychol. 1948;32:374-384.
- Edwards AL. Techniques of Attitude Scale Construction. Vakils, Feffer & Simons Inc, New York, 1969.
- Litwin MS. How to Measure Survey Reliability and Validity. Sage Publications, California, 1995.
- Polit DF, Hungler BP. Nursing Research Principles and Methods. Edn 5, JB Lippincott Co, Philadelphia, 1995.
- Nunally JO. Psychometric Theory. McGraw Hill, New York, 1967.
- Mohd Arof KZ, Ismail S, Saleh AL. Contractor's performance appraisal system in the Malaysian construction industry: Current practice, perception and understanding. Int J Eng Technol. 2018;7(3.9):46-51.