
Research article · 2020 · Full text
International Journal of Agriculture and NutritionGenetic analysis and segregation pattern of yield and its components in F3 generation of pumpkin (Cucurbita moschata Duch ex. poir)
Volume 2(2) · Pages 55–58 · DOI: 10.33545/26646064.2020.v2.i2a.131 ↗
Research areasAdvances in Cucurbitaceae Research
Abstract
Author-writtenTen non-reciprocal F, hybrids involving five parental lines of pumpkin were evaluated for yield and its components to assess the genetic variation, heritability, genetic advance and segregation pattern. Moderate GCV and PCV were recorded for number of seed for fruit, number of fruits per vine, number of branches per vine, vine length and fruit weight while low GCV and PCV volumes observed for days to first male and female flower opening. Among the traits, fruit weight, yield per vine, vine length, number of fruits per vine recorded high heritability coupled with moderate genetic advance as per cent of mean indicated that the additive genes govern these characters and selection will be effective for improvement of such traits. The cross CM-45 X CM-12 depicted more percentage of Total Transgressive Segregants (TTS) and Specific Transgressive Segregants (STS) for fruit weight and yield per vine. Based on segregation pattern it can be deduced that the crosses CM-14 X CM-12 in respect of fruits per vine and CM-45 X CM-12 in respect of yield per vine are highly desirable and can be utilized to obtain high yielding genotypes in future generations.
Summary
Source-checkedPlain-language reading of the full paper, prepared with AI and checked against the text. Each point links to the authors' own words.
Why it matters
- Pumpkin is a widely grown vegetable valued for its high nutritional content. View evidence ↗
- Because pumpkin is monoecious and cross-pollinated, it exhibits significant variability in both qualitative and quantitative traits. View evidence ↗
- Understanding segregation patterns helps breeders identify superior plants, but this specific information is currently lacking for pumpkin. View evidence ↗
The question
- The study aimed to determine the variability, heritability, genetic advance, and segregation patterns for yield and its related components in pumpkin using partial diallel crosses. View evidence ↗
What they did
- The experiment used five parental lines (CM-45, CM-14, CM-12, TPT-Local, and CM-64) and 10 F3 hybrids, grown in a randomized block design with three replications. View evidence ↗
What they found
- Moderate genotypic and phenotypic coefficients of variation (GCV and PCV) were found for fruit weight, vine length, and fruit number, while flowering days showed low variation. View evidence ↗
- High heritability and high genetic advance were observed for yield per vine, fruit weight, vine length, seed number, branch number, and fruit number. View evidence ↗
- Traits like flowering days and the node of first female flower appearance showed high heritability but low genetic advance, suggesting non-additive gene effects. View evidence ↗
- The CM-14 X CM-12 cross achieved the highest mean number of fruits per vine at 2.4 Kg, exceeding its parents (1.97 and 2.33 Kg). View evidence ↗
- The CM-15 X CM-12 cross produced the highest mean yield per vine at 12.62 kg, compared to parental means of 5.60 and 10.66 kg. View evidence ↗
- The CM-45 x CM-12 cross showed the highest percentages of Total Transgressive Segregants (TTS) and Significantly Transgressive Segregants (STS) for both yield per vine and fruit weight. View evidence ↗
What it means
- The authors conclude that CM-14 X CM-12 (for fruit number) and CM-45 X CM-12 (for yield per vine) are the most desirable crosses for developing high-yielding pumpkin genotypes. View evidence ↗
Visual summary
3 visualsIllustrations explain the paper; charts are replotted from the paper's own table values.
Experimental Layout
AI-generated conceptual illustration (pumpkin plants (Cucurbita moschata)). It explains the idea and does not show study data.
View source evidence ↗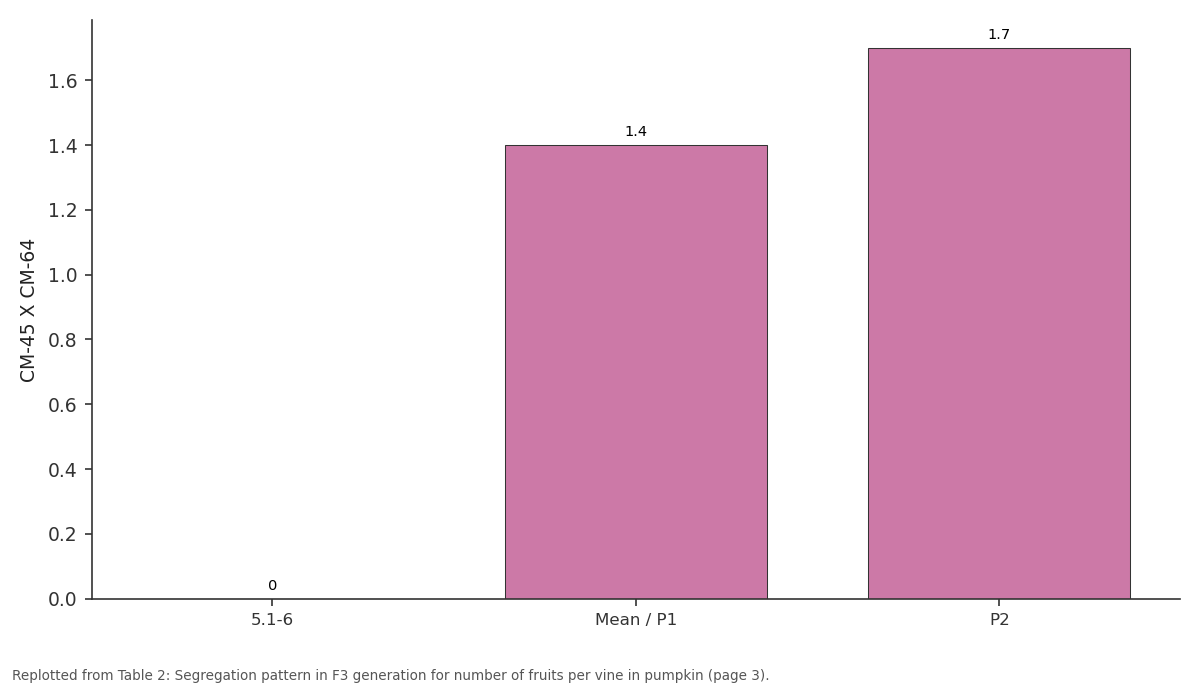
CM-45 X CM-64: 5.1-6 vs Mean / P1 vs P2
Replotted from Table 2 (page 3) of the original paper. Every bar is the paper's own table value.
View source evidence ↗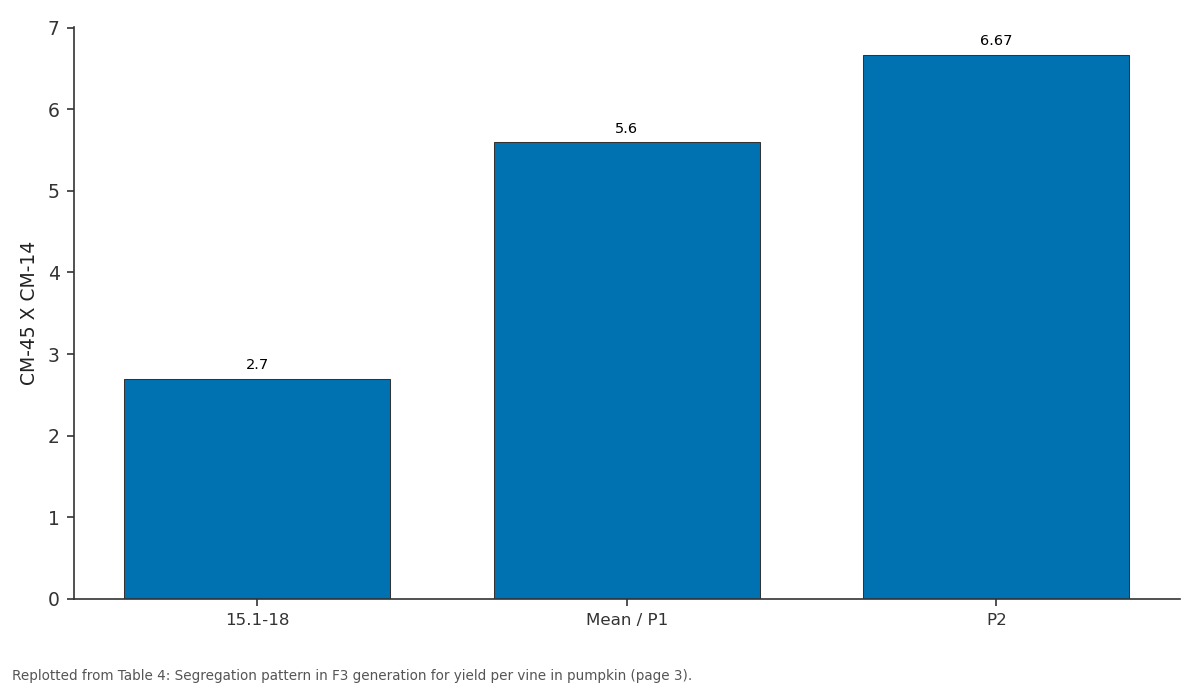
CM-45 X CM-14: 15.1-18 vs Mean / P1 vs P2
Replotted from Table 4 (page 3) of the original paper. Every bar is the paper's own table value.
View source evidence ↗Figures & tables
From the original paper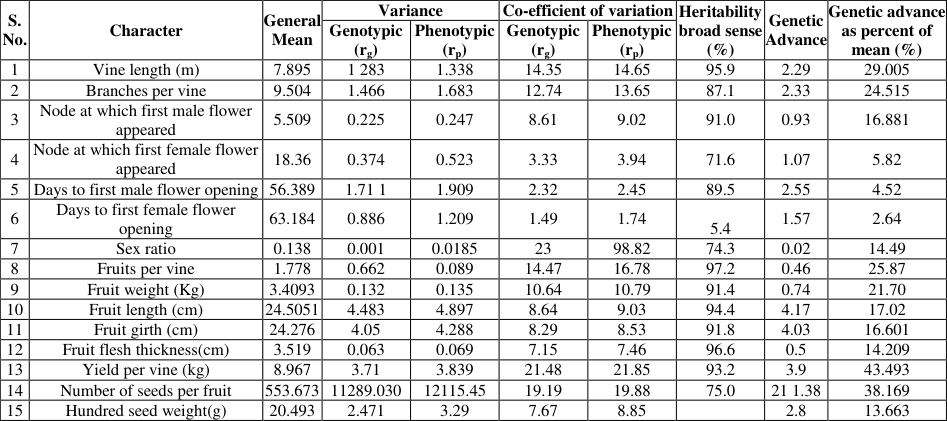 Table 1
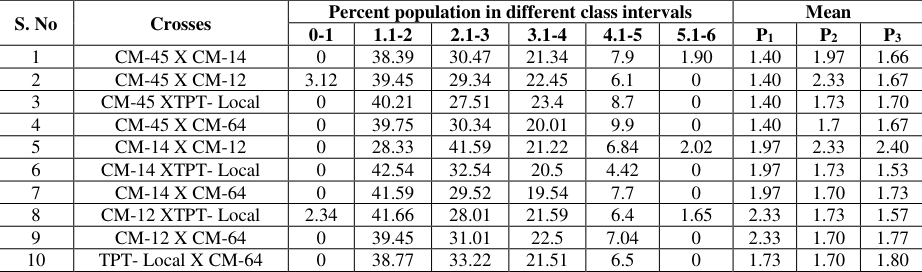 Table 2
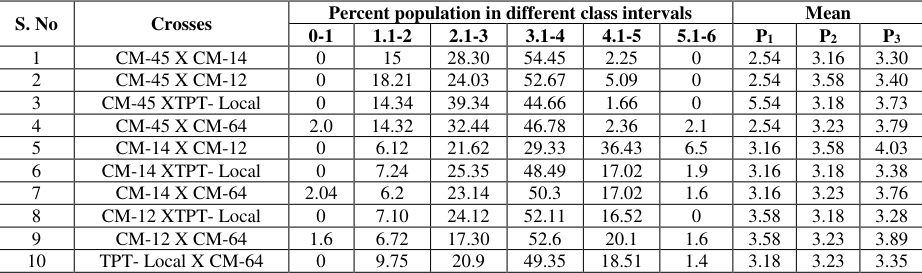 Table 3
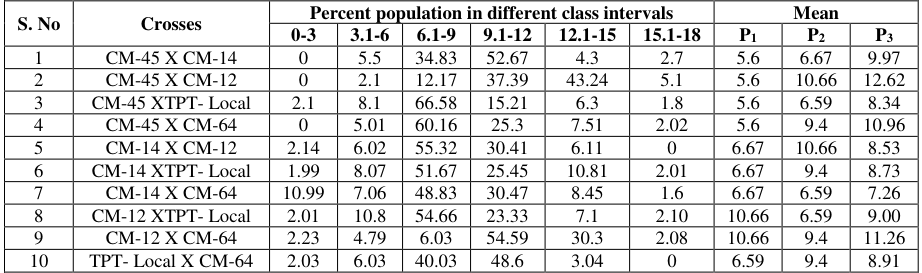 Table 4
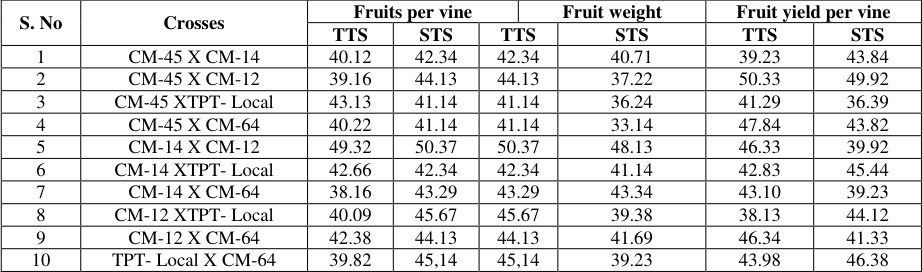 Table 5
Introduction
Pumpkin (Cucurbita moschata Duch ex. poir) is one of the popular cucurbitaceous vegetables widely grown in our country due to its high nutritive value. Pumpkin being a monoecious and cross-pollinated crop, offers a wide range of variability for both qualitative and quantitative characters. A thorough knowledge on genetic parameter viz., variability, heritability and genetic advance will provide information for formulation of systematic breeding strategy to improve any crop. The segregation pattern of crosses throw light on genetic width of the crosses which helps breeder to identify the superior individual plants. Such information pertaining to pumpkin is lacking. Therefore, the present investigation was carried out with a set of partial diallel crosses to find out the variability, heritability, genetic advance and segregation pattern in yield and its components of pumpkin.
Materials and Methods
The experimental material consisting of 10 F3 and five parents viz., CM-45, CM-14, CM-12, TPT-Local and CM-64 were grown in a randomized block design with three replications. Twenty-four plants for each cross and twelve plants for each parent were raised in each replication. Two healthy vigorous seedlings were maintained per pit with a spacing of 2m X 2 m respectively. Data was collected on all plants in each replication for fifteen characters viz., vine length, branches per vine, node at first male flower appearance node at first female flower appearance, days to first male flower opening days to first female flower opening, sex ratio, number of fruits per vine, fruit weight, fruit length, fruit girth, fruit flesh thickness, yield per vine, number of seeds per fruit and hundred seed weight. The phenotypic and genotypic coefficients of variation were calculated as per Burton (1952) [1] . Heritability and expected genetic advance as per cent of mean were estimated according to Lush (1949) [6] .
Results and Discussion
The analysis of variance revealed highly significant differences among the entries for all characters except sex ratio which indicated the presence of considerable amount of diversity in the material selected. The magnitude of variation was maximum for yield per vine and sex ratio (Table 1). Higher estimates of these components indicated wider diversity for the traits. Further, narrow difference between PCV and GCV was observed for the traits as it implied that they were less influenced by the environment. Similar results were reported by Sendurkumaran et al. (1977). Mohanty (2000) [7] and Lakshmi et al. (2002) [5] in pumpkin. Moderate GCV and PCV values were recorded for number of seeds per fruit, number of fruits per vine, vine length, number of branches per vine and fruit weight. While low GCV and PCV values were recorded for days to first male and female flowers opening which indicated less variation in the material and less scope for improvement of this trait. The PCV value was higher with the corresponding GCV for all the traits due to partly interaction of genotypes with the environment or other environmental factors influencing the expression of these characters (Choudhury et al. 1991) [6] . Narrow differences between PCV and GCV for all the characters except in case of sex ratio indicated that they were comparatively stable to environmental variations. However, the coefficient of variation indicated only the extent of variability existed for different characters and did not indicate heritable portion of the character. The relative amount of heritable portion of variation is assessed with the help of heritability estimates and genetic advance expressed as percentage of mean. Johnson et al. (1955) [4] reported that heritability and genetic advance as percent mean together were more useful for predicting the resultant effect of selected genotypes than heritability or genetic advance as percent of mean alone. Among the traits, fruit weight, yield per vine, vine length, number of seed per fruit, number of branches and number of fruits per vine recorded high heritability coupled with high genetic advance as per percent of mean. While the traits, fruit girth, fruit fresh thickness, fruit length, node at which first male flower appeared and hundred seed weight showed high heritability coupled with moderate genetic advance as percent of mean. This indicated that the additive genes govern these characters and selection will be effective for improvement of such traits. High heritability with low genetic advance was recorded for node at first female appeared, days to first male and female flower opening. This may be due to non-additive gene effect and simple selection will not be effective to improve these characters. Those results are inconformity with Gopalakrishnan et al. (1980) [3] and Sendurkumaran et al (1997) [8] in pumpkin. Among 10 F3 crosses, two F3 (CM-14 X CM-12 and CM-12 X CM-64) exceeded the overall general mean number of fruits per vine (1.77). The crosses CM-14 X CM-12 recorded the highest mean number of fruits per vine (2.4 Kg) with parental means of 1.97 and 2.33 Kg respectively (Table 1). Five out of 10 F3 crosses exceeded the general mean fruit weight (3.41 Kg) (Table -3). The highest mean fruit weight was recorded by CM-14 X CM-12 (4.03 kg) with parental means of 3.61 and 3.58 kgs respectively. Among the F3 crosses, five F3 crosses exceeded the overall general mean yield per vine (8.96 kg). The cross CM-15 X CM-12 recorded the highest mean yield per vine of 12.62 kg with parental means of 5.60 and 10.66 kg respectively. The crosses CM-14 X CM-12 showed better segregation pattern for highest number fruits and fruit weight per vine, while the cross CM-45 X CM-12 recorded the better segregation pattern and highest mean yield per vine. (Table 2, 3, &4). The total transgressive segregants (TTS) of for number of fruits per vine ranged from 38.16 to 49.32 per cent while significantly transgressive segregants (STS) ranged from 39.34 to 50.37 per cent. The cross CM-14CM-12 showed more percentage of TTS and STS with respect to fruit weight (Table 5). The TTS and STS in fruit weight was ranged from 38.13 to 50.33 and 36.69 to 49.92 respectively. While TTS and STS for yield per vine ranged from 39.98 to 49.67 and 33.14 to 48.13 respectively. The cross CM-45 x CM-12 depicted more percentage of TTS and STS for both fruit weight and yield per vine (Table 5).Based on segregation pattern it can be deduced that the crosses CM-14 X CM-12 in respect of fruits per vine and CM-45 X CM-12 in respect of yield per vine are highly desirable and can be utilized to obtain high yielding genotypes in future generations.
| S. No | Crosses | Fruits per vine | — | — | Fruit weight | — | Fruit yield per vine | — |
|---|---|---|---|---|---|---|---|---|
| TTS | STS | TTS | STS | TTS | STS | |||
| 1 | CM-45 X CM-14 | 40.12 | 42.34 | 42.34 | 40.71 | 39.23 | 43.84 | |
| 2 | CM-45 X CM-12 | 39.16 | 44.13 | 44.13 | 37.22 | 50.33 | 49.92 | |
| 3 | CM-45 XTPT- Local | 43.13 | 41.14 | 41.14 | 36.24 | 41.29 | 36.39 | |
| 4 | CM-45 X CM-64 | 40.22 | 41.14 | 41.14 | 33.14 | 47.84 | 43.82 | |
| 5 | CM-14 X CM-12 | 49.32 | 50.37 | 50.37 | 48.13 | 46.33 | 39.92 | |
| 6 | CM-14 XTPT- Local | 42.66 | 42.34 | 42.34 | 41.14 | 42.83 | 45.44 | |
| 7 | CM-14 X CM-64 | 38.16 | 43.29 | 43.29 | 43.34 | 43.10 | 39.23 | |
| 8 | CM-12 XTPT- Local | 40.09 | 45.67 | 45.67 | 39.38 | 38.13 | 44.12 | |
| 9 | CM-12 X CM-64 | 42.38 | 44.13 | 44.13 | 41.69 | 46.34 | 41.33 | |
| 10 | TPT- Local X CM-64 | 39.82 | 45,14 | 45,14 | 39.23 | 43.98 | 46.38 |
Table text extracted from the original PDF; superscript letters are shown inline. The original table image is below.
View original table image
| S. No | Crosses | Percent population in different class intervals | — | — | — | — | — | Mean | — | — |
|---|---|---|---|---|---|---|---|---|---|---|
| 0-1 | 1.1-2 | 2.1-3 | 3.1-4 | 4.1-5 | 5.1-6 | P1 | P2 | P3 | ||
| 1 | CM-45 X CM-14 | 0 | 38.39 | 30.47 | 21.34 | 7.9 | 1.90 | 1.40 | 1.97 | 1.66 |
| 2 | CM-45 X CM-12 | 3.12 | 39.45 | 29.34 | 22.45 | 6.1 | 0 | 1.40 | 2.33 | 1.67 |
| 3 | CM-45 XTPT- Local | 0 | 40.21 | 27.51 | 23.4 | 8.7 | 0 | 1.40 | 1.73 | 1.70 |
| 4 | CM-45 X CM-64 | 0 | 39.75 | 30.34 | 20.01 | 9.9 | 0 | 1.40 | 1.7 | 1.67 |
| 5 | CM-14 X CM-12 | 0 | 28.33 | 41.59 | 21.22 | 6.84 | 2.02 | 1.97 | 2.33 | 2.40 |
| 6 | CM-14 XTPT- Local | 0 | 42.54 | 32.54 | 20.5 | 4.42 | 0 | 1.97 | 1.73 | 1.53 |
| 7 | CM-14 X CM-64 | 0 | 41.59 | 29.52 | 19.54 | 7.7 | 0 | 1.97 | 1.70 | 1.73 |
| 8 | CM-12 XTPT- Local | 2.34 | 41.66 | 28.01 | 21.59 | 6.4 | 1.65 | 2.33 | 1.73 | 1.57 |
| 9 | CM-12 X CM-64 | 0 | 39.45 | 31.01 | 22.5 | 7.04 | 0 | 2.33 | 1.70 | 1.77 |
| 10 | TPT- Local X CM-64 | 0 | 38.77 | 33.22 | 21.51 | 6.5 | 0 | 1.73 | 1.70 | 1.80 |
Table text extracted from the original PDF; superscript letters are shown inline. The original table image is below.
View original table image
| S. No. | Character | General Mean | Variance | — | Co-efficient of variation | — | Heritability broad sense (%) | Genetic Advance | Genetic advance as percent of mean (%) |
|---|---|---|---|---|---|---|---|---|---|
| Genotypic (r) g | Phenotypic (r) p | Genotypic (r) g | Phenotypic (r) p | ||||||
| 1 | Vine length (m) | 7.895 | 1 283 | 1.338 | 14.35 | 14.65 | 95.9 | 2.29 | 29.005 |
| 2 | Branches per vine | 9.504 | 1.466 | 1.683 | 12.74 | 13.65 | 87.1 | 2.33 | 24.515 |
| 3 | Node at which first male flower appeared | 5.509 | 0.225 | 0.247 | 8.61 | 9.02 | 91.0 | 0.93 | 16.881 |
| 4 | Node at which first female flower appeared | 18.36 | 0.374 | 0.523 | 3.33 | 3.94 | 71.6 | 1.07 | 5.82 |
| 5 | Days to first male flower opening | 56.389 | 1.71 1 | 1.909 | 2.32 | 2.45 | 89.5 | 2.55 | 4.52 |
| 6 | Days to first female flower opening | 63.184 | 0.886 | 1.209 | 1.49 | 1.74 | 5.4 | 1.57 | 2.64 |
| 7 | Sex ratio | 0.138 | 0.001 | 0.0185 | 23 | 98.82 | 74.3 | 0.02 | 14.49 |
| 8 | Fruits per vine | 1.778 | 0.662 | 0.089 | 14.47 | 16.78 | 97.2 | 0.46 | 25.87 |
| 9 | Fruit weight (Kg) | 3.4093 | 0.132 | 0.135 | 10.64 | 10.79 | 91.4 | 0.74 | 21.70 |
| 10 | Fruit length (cm) | 24.5051 | 4.483 | 4.897 | 8.64 | 9.03 | 94.4 | 4.17 | 17.02 |
| 11 | Fruit girth (cm) | 24.276 | 4.05 | 4.288 | 8.29 | 8.53 | 91.8 | 4.03 | 16.601 |
| 12 | Fruit flesh thickness(cm) | 3.519 | 0.063 | 0.069 | 7.15 | 7.46 | 96.6 | 0.5 | 14.209 |
| 13 | Yield per vine (kg) | 8.967 | 3.71 | 3.839 | 21.48 | 21.85 | 93.2 | 3.9 | 43.493 |
| 14 | Number of seeds per fruit | 553.673 | 11289.030 | 12115.45 | 19.19 | 19.88 | 75.0 | 21 1.38 | 38.169 |
| 15 | Hundred seed weight(g) | 20.493 | 2.471 | 3.29 | 7.67 | 8.85 | 2.8 | 13.663 |
Table text extracted from the original PDF; superscript letters are shown inline. The original table image is below.
View original table image
Figures and tables from the paper
| S. No | Crosses | Percent population in different class intervals | — | — | — | — | — | Mean | — | — |
|---|---|---|---|---|---|---|---|---|---|---|
| 0-1 | 1.1-2 | 2.1-3 | 3.1-4 | 4.1-5 | 5.1-6 | P1 | P2 | P3 | ||
| 1 | CM-45 X CM-14 | 0 | 15 | 28.30 | 54.45 | 2.25 | 0 | 2.54 | 3.16 | 3.30 |
| 2 | CM-45 X CM-12 | 0 | 18.21 | 24.03 | 52.67 | 5.09 | 0 | 2.54 | 3.58 | 3.40 |
| 3 | CM-45 XTPT- Local | 0 | 14.34 | 39.34 | 44.66 | 1.66 | 0 | 5.54 | 3.18 | 3.73 |
| 4 | CM-45 X CM-64 | 2.0 | 14.32 | 32.44 | 46.78 | 2.36 | 2.1 | 2.54 | 3.23 | 3.79 |
| 5 | CM-14 X CM-12 | 0 | 6.12 | 21.62 | 29.33 | 36.43 | 6.5 | 3.16 | 3.58 | 4.03 |
| 6 | CM-14 XTPT- Local | 0 | 7.24 | 25.35 | 48.49 | 17.02 | 1.9 | 3.16 | 3.18 | 3.38 |
| 7 | CM-14 X CM-64 | 2.04 | 6.2 | 23.14 | 50.3 | 17.02 | 1.6 | 3.16 | 3.23 | 3.76 |
| 8 | CM-12 XTPT- Local | 0 | 7.10 | 24.12 | 52.11 | 16.52 | 0 | 3.58 | 3.18 | 3.28 |
| 9 | CM-12 X CM-64 | 1.6 | 6.72 | 17.30 | 52.6 | 20.1 | 1.6 | 3.58 | 3.23 | 3.89 |
| 10 | TPT- Local X CM-64 | 0 | 9.75 | 20.9 | 49.35 | 18.51 | 1.4 | 3.18 | 3.23 | 3.35 |
Table text extracted from the original PDF; superscript letters are shown inline. The original table image is below.
View original table image
| S. No | Crosses | Percent population in different class intervals | — | — | — | — | — | Mean | — | — |
|---|---|---|---|---|---|---|---|---|---|---|
| 0-3 | 3.1-6 | 6.1-9 | 9.1-12 | 12.1-15 | 15.1-18 | P1 | P2 | P3 | ||
| 1 | CM-45 X CM-14 | 0 | 5.5 | 34.83 | 52.67 | 4.3 | 2.7 | 5.6 | 6.67 | 9.97 |
| 2 | CM-45 X CM-12 | 0 | 2.1 | 12.17 | 37.39 | 43.24 | 5.1 | 5.6 | 10.66 | 12.62 |
| 3 | CM-45 XTPT- Local | 2.1 | 8.1 | 66.58 | 15.21 | 6.3 | 1.8 | 5.6 | 6.59 | 8.34 |
| 4 | CM-45 X CM-64 | 0 | 5.01 | 60.16 | 25.3 | 7.51 | 2.02 | 5.6 | 9.4 | 10.96 |
| 5 | CM-14 X CM-12 | 2.14 | 6.02 | 55.32 | 30.41 | 6.11 | 0 | 6.67 | 10.66 | 8.53 |
| 6 | CM-14 XTPT- Local | 1.99 | 8.07 | 51.67 | 25.45 | 10.81 | 2.01 | 6.67 | 9.4 | 8.73 |
| 7 | CM-14 X CM-64 | 10.99 | 7.06 | 48.83 | 30.47 | 8.45 | 1.6 | 6.67 | 6.59 | 7.26 |
| 8 | CM-12 XTPT- Local | 2.01 | 10.8 | 54.66 | 23.33 | 7.1 | 2.10 | 10.66 | 6.59 | 9.00 |
| 9 | CM-12 X CM-64 | 2.23 | 4.79 | 6.03 | 54.59 | 30.3 | 2.08 | 10.66 | 9.4 | 11.26 |
| 10 | TPT- Local X CM-64 | 2.03 | 6.03 | 40.03 | 48.6 | 3.04 | 0 | 6.59 | 9.4 | 8.91 |
Table text extracted from the original PDF; superscript letters are shown inline. The original table image is below.
View original table image
References
8 in the original paper- Burton GW. Quantitative inheritance in grasses. Proc., 6 0th International Congress, 1952, 277-283.
- Choudhary SM, Kalc PN, Desai UT. Variability studies and scope of improvement in fruit yield in bittergourd. J Maharashtra Agril. Univ. 1991;16:15-17.
- Gopalakrishnanan TR, Gopalakrishnan PK, Peter KV. Variability. heritability and correlation among some polygenic characters in pumpkin. Ind. J Agril. Sci. 1980;50(12):925-930.
- Johnson HW, Rabinson HF, Comstock RE. Genetic and Phenotypic correlations in Soyabean and their implications in selections. Agronomy J 1955;47(10):477-483.
- Lakshmi LM, Haribabu K, Reddy GLK. Genetic variability studies in pumpkin (Cucumbitam oschataduchex. poit) J Res. A.N.G.R.A.U. 2002;30(1):82-86.
- Lush JL. Interasire correlations and suggestion of off spring on dams as a method of estimating heritability of characters. Proc. Amer. Soc. Animal Production. 1940;33:293-301.
- Mohanty BK. Quantitative inheritance in pumpkin -A combining ability analysis. Ind. J Hort. 2000;57(2):160-163.
- Senthurkumaran S, Natarajan S, Thanburaj S. Genetic variability in pumpkin. South Ind. ILORT. 1997;45:10-12.