
Research article · 2024 · Full text
International Journal of Research in AgronomyImpact of organic, inorganic, and integrated production systems on growth and yield of rice (Oryza sativa L)
Volume 7(1) · Pages 183–187 · DOI: 10.33545/2618060x.2024.v7.i1c.205 ↗
Research areasRice Cultivation and Yield Improvement
Abstract
Author-writtenA field experiment was conducted during the Kharif season of 2022 at the Modern Agricultural Experiment Farm, Regional Agricultural Research Station in Karjat, Dist. Raigad, to investigate the influence of organic, inorganic, and integrated production systems on the growth and yield of rice (Oryza sativa L). The experiment was laid out with randomized block design with six treatments, including T1-100% Organic N, T2-50% Organic N + Beejamrit, Jeevamrit, and Ghanajeevamrit, T3-100% Inorganic N, P2O5, and K2O, T4-Farmers practice, T5-50% organic N + 50% Inorganic N, P2O5, and K2O, andT6- 25% Organic N + 25% Inorganic N, P2O5, and K2O + Beejamrit, Jeevamrit, and Beejamrit, each replicated four times. The application of fertilizers and other agricultural practices for rice was tailored to each treatment. The experimental results indicated a significant impact of various nutrient sources on the growth and yield of rice. Treatment T5 (50% organic N + 50% Inorganic N, P2O5, and K2O) exhibited significantly higher growth attributes, including plant height (cm), number of functional leaves hill-1, number of functional tillers hill-1, and dry matter accumulation (g) hill-1. Notably, T5 also recorded a superior yield of rice. However, treatment T3 (100% Inorganic N, P2O5, and K2O) demonstrated comparable results to T5, emphasizing its effectiveness in enhancing rice yield. The integrated approach of T5, combining organic and inorganic components, demonstrated significant advantages in promoting both the growth and yield of rice under the specified experimental conditions.
Summary
Source-checkedPlain-language reading of the full paper, prepared with AI and checked against the text. Each point links to the authors' own words.
Why it matters
- In at least 33 developing nations, rice provides 27% of dietary calories, 20% of dietary protein, and 3% of dietary fat. View evidence ↗
- Rice is a vital income source for rural Indian communities, accounting for 46% of cereal and 43% of total food grain production in the country. View evidence ↗
The question
- The study aimed to investigate how organic, inorganic, and integrated production systems affect the growth and yield of rice. View evidence ↗
What they did
- The research used a randomized block design with four replicates across six treatments: 100% organic N (T1), 50% organic N with bio-stimulants (T2), 100% inorganic NPK (T3), farmers' practice (T4), 50% organic and 50% inorganic NPK (T5), and 25% organic and 25% inorganic NPK with bio-stimulants (T6). View evidence ↗
- The field experiment took place during the 2022 Kharif season at the Modern Agricultural Experiment Farm in Karjat, District Raigad, Maharashtra. View evidence ↗
- The experimental soil had a pH of 6.8, organic carbon content of 11.4 g kg-1, and electrical conductivity of 0.125 dSm-1. View evidence ↗
What they found
- The integrated treatment T5 (50% organic and 50% inorganic NPK) produced the tallest plants, reaching 80.03 cm at harvest. View evidence ↗
- Treatment T5 resulted in the highest number of functional leaves per hill, peaking at 44.43 leaves at 90 days after transplanting (DAT). View evidence ↗
- The highest number of functional tillers per hill was observed in treatment T5, reaching 13.85 tillers at 90 DAT. View evidence ↗
- The highest grain yield was recorded for treatment T5 at 3360.00 kg ha-1, which was superior to all other treatments except T3. View evidence ↗
- Treatment T5 also produced the highest straw yield at 3997.65 kg ha-1. View evidence ↗
- The numerically highest harvest index of 45.66% was observed in treatment T5. View evidence ↗
- The lowest grain yield of 2847 kg ha-1 was recorded under the farmers' practice (T4). View evidence ↗
What it means
- The authors conclude that a blend of 50% organic and 50% inorganic NPK significantly improves growth parameters and dry matter accumulation in rice. View evidence ↗
- The authors state that the 50% organic and 50% inorganic NPK treatment recorded the highest rice yield, followed by the 100% inorganic treatment. View evidence ↗
Visual summary
2 visualsIllustrations explain the paper; charts are replotted from the paper's own table values.
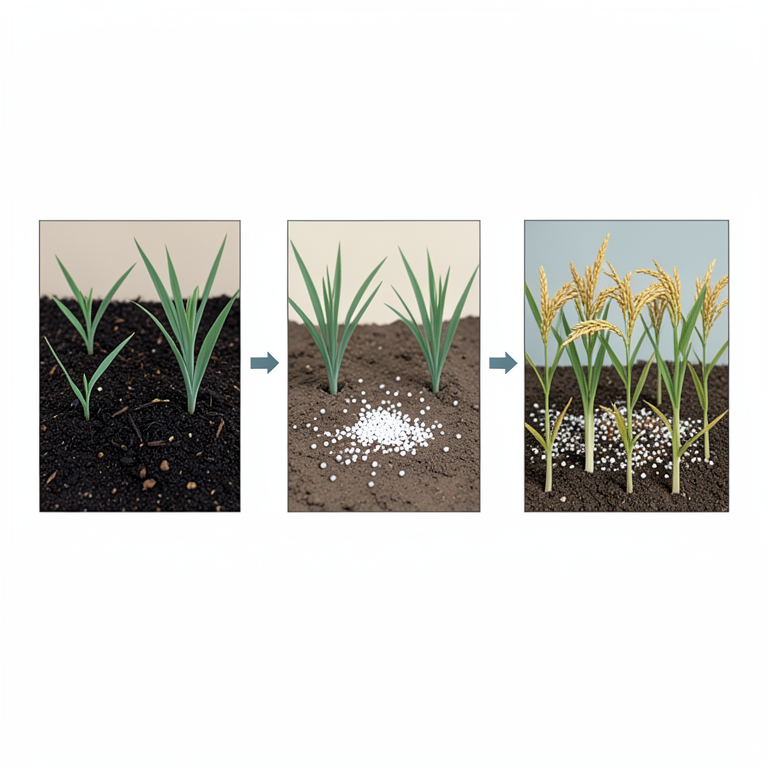
Experimental Treatment Layout
AI-generated conceptual illustration (rice plants (Oryza sativa L)). It explains the idea and does not show study data.
View source evidence ↗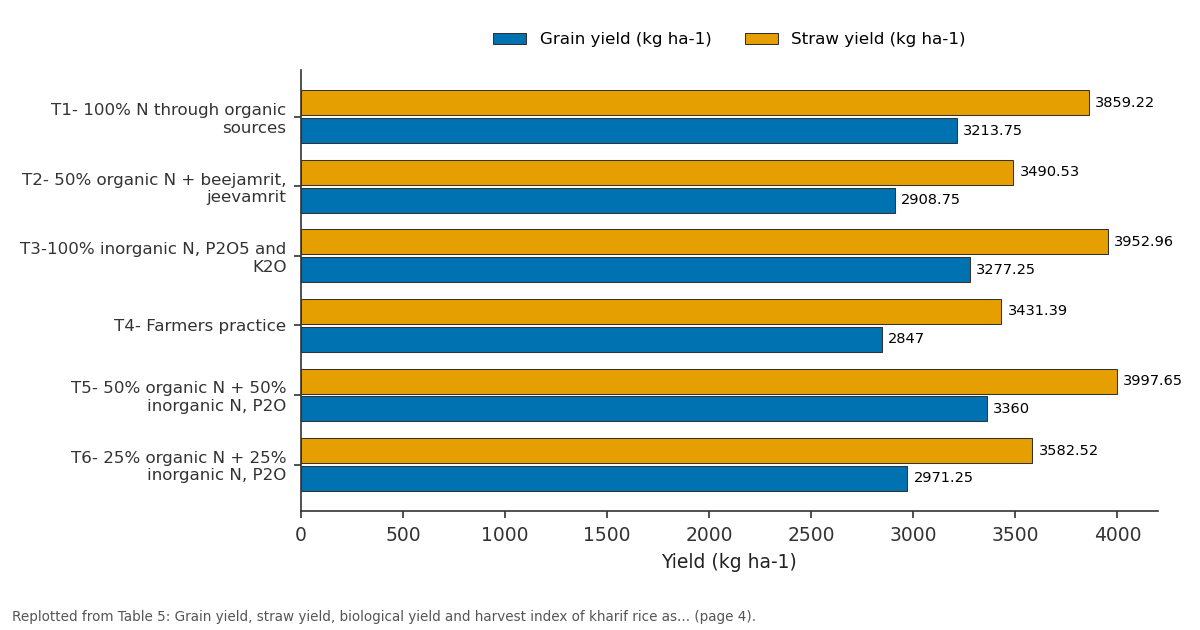
Grain yield (kg ha-1) and Straw yield (kg ha-1): T1- 100% N through... vs T2- 50% organic N +... vs T3-100% inorganic N... vs T4- Farmers practice vs T5- 50% organic N + 50%...
Replotted from Table 5 (page 4) of the original paper. Every bar is the paper's own table value.
View source evidence ↗Figures & tables
From the original paper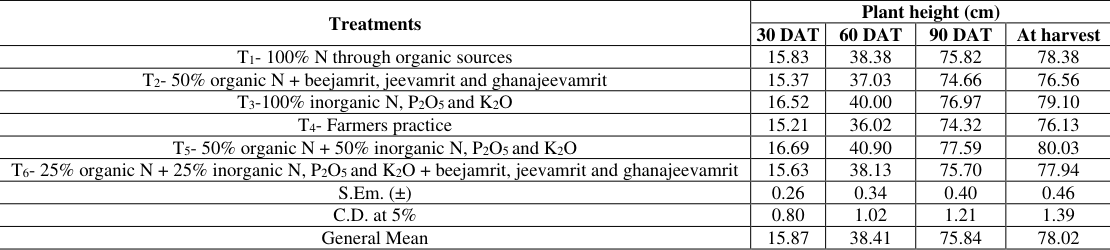 Table 1
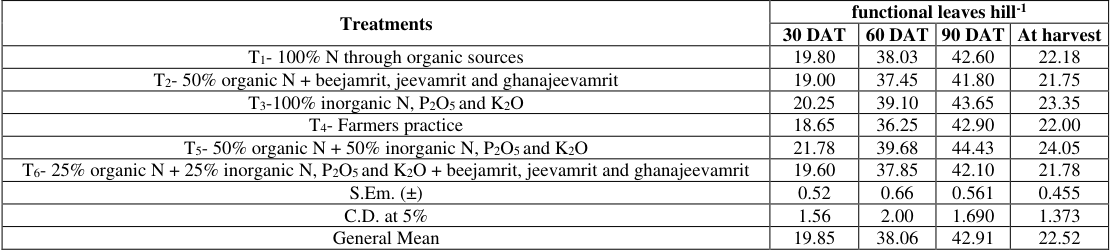 Table 2
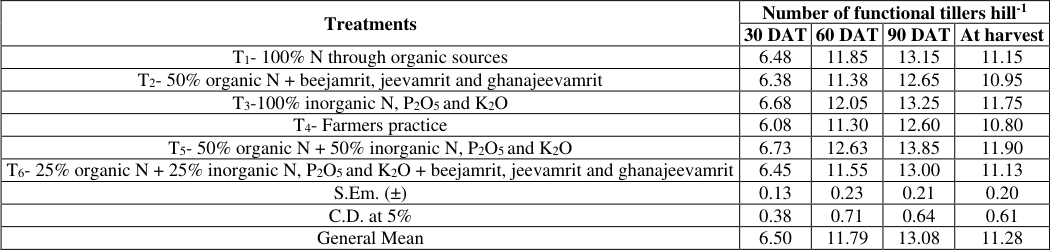 Table 3
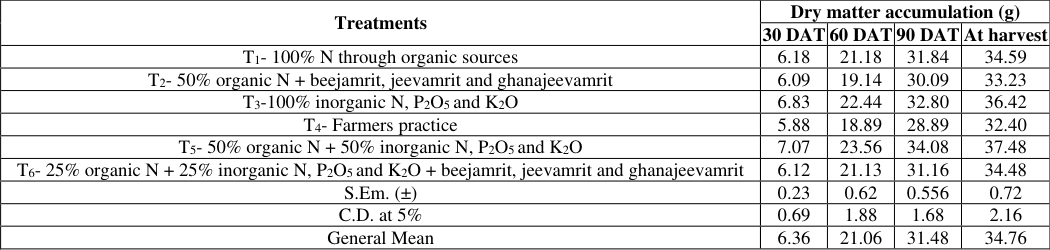 Table 4
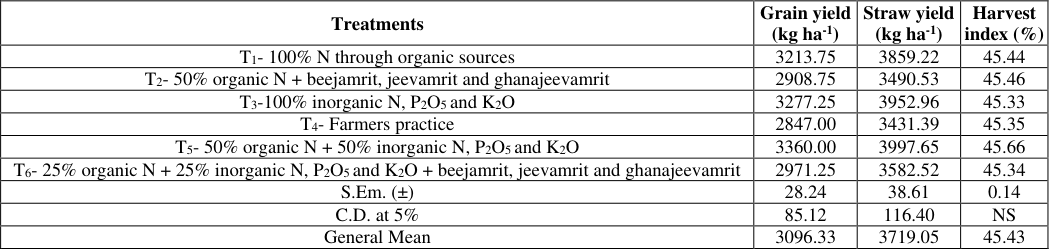 Table 5
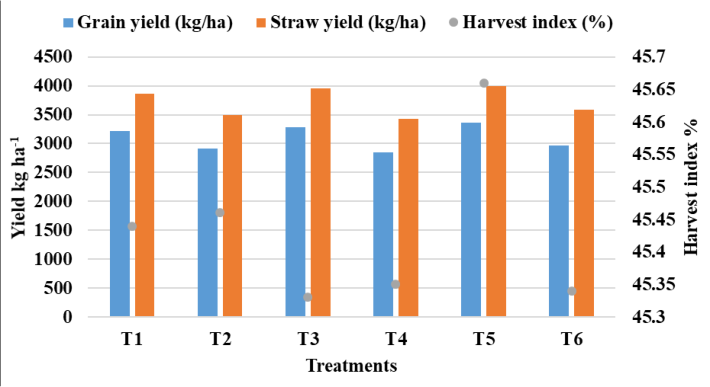 Figure 1
Introduction
Rice, scientifically known as Oryza sativa L., originates from Asia and is predominantly cultivated in South East Asia and India. Often considered as the "global grain," it holds a pivotal position as a fundamental food source for humanity. Notably, rice has received two United Nations awards, recognizing its unparalleled contribution to global food security. Despite its non-tropical origins, rice thrives in moist and humid climates. This versatile crop assumes a crucial role in the diets of at least 33 developing nations, constituting 27% of dietary calories, 20% of dietary protein, and 3% of dietary fat (Kennedy et al., 2020) [6] . Following maize, rice stands as the world's second most vital cereal. The Asia-Pacific region serves as the epicenter for rice production and consumption, accounting for over 90% of the global output. China, topping the charts, contributed 147 million tons to the global production of approximately 503.27 million tons. India follows closely, producing 124 million tons annually (Anonymous, 2022a) [1] . India, a cornerstone of rice cultivation, holds this grain as one of its most critical cereal crops, serving as a primary dietary staple for over half its population and wielding significant influence in the country's economy. Its adaptability allows cultivation across various climatic zones, covering an extensive 49.706 million hectares in India. Uttar Pradesh claims the largest area under cultivation at 0.57 million hectares, trailed by West Bengal and Chhattisgarh (Anonymous, 2022b) [2] . Constituting 46% of all cereal production and 43% of total food grain production in India, rice emerges as a key income source for rural communities.
Beyond its nutritional value, rice boasts therapeutic benefits and serves as a raw material for various byproducts, including beverages, snacks, and oils (Mahajan et al., 2017) [9] .
Material and Methods
A present study was conducted during the kharif season of 2022 at the Modern Agricultural Experiment Farm within the Regional Agricultural Research Station situated at Karjat, District Raigad (M.S.). Geographically, experimental plot no. 6 at Modern Agricultural Experiment farm, Karjat is situated in the subtropical region at 18 0 54'49.1'' N latitude and 73 0 19'31'' E longitude having elevation of about 52 m above mean sea level. The experiment was laid out in a randomized block design with six treatments which were replicated four times viz. T 1 : 100% Organic N, T 2 : 50% Organic N + Beejamrit, Jeevamrit and Ghanajeevamrit, T 3 : 100% Inorganic N, P 2 O 5 and K 2 O, T 4 : Farmers practice, T 5 : 50% organic N + 50% Inorganic N, P 2 O 5 and K 2 O, T 6 : 25% Organic N + 25% Inorganic N, P 2 O 5 and K 2 O + Beejamrit, Jeevamrit and Beejamrit. A substantial rainfall of 3754.2 mm was recorded throughout the rice crop's growth period. The average daily sunshine duration stood at 2.67 hours. The crop was grown in soil with an organic carbon content of 11.4 g kg -1 , a pH level of 6.8, and an electrical conductivity measuring 0.125 dSm -1 .
Result and Discussion
Result and Discussion
The information presented in Table 1 indicates a direct relation between plant height and the crop's age, reaching its maximum at the time of harvest. The increase in plant height exhibited a consistent pattern during the early vegetative growth phase, up to 30 DAT, after which it experienced a significant surge from 30 DAT to 90 DAT. Subsequently, the rate of increase slowed down until the final harvest. Specifically, the mean plant height recorded at 30 DAT, 60 DAT, 90 DAT, and harvest for the rice crop were 15.87 cm, 38.41 cm, 75.84 cm, and 78.02 cm, respectively.
| Treatments | Plant height (cm) | — | — | — |
|---|---|---|---|---|
| 30 DAT | 60 DAT | 90 DAT | At harvest | |
| T1- 100% N through organic sources | 15.83 | 38.38 | 75.82 | 78.38 |
| T2- 50% organic N + beejamrit, jeevamrit and ghanajeevamrit | 15.37 | 37.03 | 74.66 | 76.56 |
| T3-100% inorganic N, P2O5 and K2O | 16.52 | 40.00 | 76.97 | 79.10 |
| T4- Farmers practice | 15.21 | 36.02 | 74.32 | 76.13 |
| T5- 50% organic N + 50% inorganic N, P2O5 and K2O | 16.69 | 40.90 | 77.59 | 80.03 |
| T6- 25% organic N + 25% inorganic N, P2O5 and K2O + beejamrit, jeevamrit and ghanajeevamrit | 15.63 | 38.13 | 75.70 | 77.94 |
| S.Em. (±) | 0.26 | 0.34 | 0.40 | 0.46 |
| C.D. at 5% | 0.80 | 1.02 | 1.21 | 1.39 |
| General Mean | 15.87 | 38.41 | 75.84 | 78.02 |
Table text extracted from the original PDF; superscript letters are shown inline. The original table image is below.
View original table image
The plant height exhibited significant variations due to the application of different nutrient sources. Notably, treatment T 5 (50% organic N + 50% inorganic N, P 2 O 5 and K 2 O) demonstrated the highest plant height, registering values of 16.69 cm, 40.90 cm, 77.59 cm, and 80.03 cm at 30 DAT, 60 DAT, 90 DAT, and harvest, respectively. Following closely, treatment T 3 (100% inorganic N, P 2 O 5 and K 2 O) recorded plant heights of 16.52 cm, 40.00 cm, 76.97 cm, and 79.10 cm at the corresponding stages. The favorable impact on plant height can be attributed to the balanced supply of essential nutrients from both organic and inorganic sources. This observation aligns with the findings of Yadav et al. (2019) [17] , Panwar et al. (2022) [11] , and Sonamati et al. (2022) [14] . Integrated nutrient management practices, as highlighted by Mangaraj et al. (2022) [10] , play a pivotal role in enhancing nutrient availability, thereby contributing to increased plant height.
Number of functional leaves hill -1
The information presented in Table 2 highlights that the application of 50% organic N + 50% inorganic N, P 2 O 5 and K 2 O (T 5 ) resulted in a significantly higher number of leaves per hill, with values of 21.78, 39.68, 44.43, and 24.05 at 30 DAT, 60 DAT, 90 DAT, and harvest, respectively. Interestingly, the treatment T 3 (100% inorganic N, P 2 O 5 and K 2 O) demonstrated a similar leaf count and was on par with T 5 . Conversely, the remaining treatments did not reach a level of statistical significance. This consistent trend was observed across the various stages of 30 DAT, 60 DAT, 90 DAT, and harvest for the rice crop. The number of functional leaves per hill was significantly influenced by various treatments. As the crop ages, it is expected that the number of productive tillers stabilizes. The simultaneous application of multiple nutrients, particularly nitrogen, plays a crucial role in promoting vegetative growth, resulting in an augmentation of both functional tillers per hill and functional leaves per hill. This phenomenon aligns with observations made by Jiban et al. (2020) [4] and Singh et al. (2021) [13] . [4] and Singh et al. (2021) [13] . [5] postulated that elevated dry matter production could be attributed to an increased availability of major nutrients facilitated by the mineralized nutrients from both organic and inorganic sources throughout the cropping period. Similar observations were reported by Kumar et al. (2017) [7] , Singh et al. (2018) [12] , and Takhellambam et al. (2019) [16] .
| Treatments | functional leaves hill-1 | — | — | — |
|---|---|---|---|---|
| 30 DAT | 60 DAT | 90 DAT | At harvest | |
| T1- 100% N through organic sources | 19.80 | 38.03 | 42.60 | 22.18 |
| T2- 50% organic N + beejamrit, jeevamrit and ghanajeevamrit | 19.00 | 37.45 | 41.80 | 21.75 |
| T3-100% inorganic N, P2O5 and K2O | 20.25 | 39.10 | 43.65 | 23.35 |
| T4- Farmers practice | 18.65 | 36.25 | 42.90 | 22.00 |
| T5- 50% organic N + 50% inorganic N, P2O5 and K2O | 21.78 | 39.68 | 44.43 | 24.05 |
| T6- 25% organic N + 25% inorganic N, P2O5 and K2O + beejamrit, jeevamrit and ghanajeevamrit | 19.60 | 37.85 | 42.10 | 21.78 |
| S.Em. (±) | 0.52 | 0.66 | 0.561 | 0.455 |
| C.D. at 5% | 1.56 | 2.00 | 1.690 | 1.373 |
| General Mean | 19.85 | 38.06 | 42.91 | 22.52 |
Table text extracted from the original PDF; superscript letters are shown inline. The original table image is below.
View original table image
Effect on yield of rice
Table 5 presents data on the grain yield (kg ha -1 ), straw yield (kg ha -1 ), and harvest index (%) of the rice crop under the influence of different treatments.
| Treatments | Grain yield (kg ha-1) | Straw yield (kg ha-1) | Harvest index (%) |
|---|---|---|---|
| T1- 100% N through organic sources | 3213.75 | 3859.22 | 45.44 |
| T2- 50% organic N + beejamrit, jeevamrit and ghanajeevamrit | 2908.75 | 3490.53 | 45.46 |
| T3-100% inorganic N, P2O5 and K2O | 3277.25 | 3952.96 | 45.33 |
| T4- Farmers practice | 2847.00 | 3431.39 | 45.35 |
| T5- 50% organic N + 50% inorganic N, P2O5 and K2O | 3360.00 | 3997.65 | 45.66 |
| T6- 25% organic N + 25% inorganic N, P2O5 and K2O + beejamrit, jeevamrit and ghanajeevamrit | 2971.25 | 3582.52 | 45.34 |
| S.Em. (±) | 28.24 | 38.61 | 0.14 |
| C.D. at 5% | 85.12 | 116.40 | NS |
| General Mean | 3096.33 | 3719.05 | 45.43 |
Table text extracted from the original PDF; superscript letters are shown inline. The original table image is below.
View original table image
Throughout the study, it became evident that the application of various nutrient sources had a significant impact on the grain yield (kg ha -1 ). Specifically, the treatment involving 50% organic N + 50% inorganic N, P 2 O 5 and K 2 O (T 5 ) yielded the highest grain output, measuring 3360.00 kg ha -1 , surpassing T 1 , T 2 , T 4 , and T 6 treatments. Treatment T 3 (3277.25 kg ha -1 ) was comparable to T 5 , while the lowest grain yield (2847 kg ha -1 ) was recorded under treatment T 4 . The data indicates a significant impact of various nutrient sources on straw yield (kg ha -1 ). Specifically, the application of 50% organic N + 50% inorganic [12] reported improved rice yield with the combination of organic and inorganic nutrient sources. The consistent and gradual supply of the appropriate quantity of nutrients during various growth phases allowed for optimal absorption by the plants, leading to increased grain and straw yields. These findings align with research by Lamichhane et al.
(2019) [8] , Takhellambam et al. (2019) [16] , Sonamati et al. (2022) [14] , and Tahmina et al. (2022) [15] .
Conclusion
The application of a fertilizer blend comprising 50% organic N and 50% inorganic recommended doses of N, P 2 O 5 and K 2 O resulted in significantly improved growth parameters such as plant height (cm), number of functional leaves hill -1 , and number of functional tillers hill -1 , as well as enhanced accumulation of dry matter hill -1 in rice crops. This was observed to be superior to the application of the full recommended dose of inorganic N, P 2 O 5 , and K 2 O. Furthermore, the use of the 50% organic N + 50% inorganic N, P 2 O 5 and K 2 O recorded the higher rice yield which was followed by 100% recommended dose of N, P 2 O 5 and K 2 O through inorganic fertilizers.
Figures and tables from the paper
| Treatments | Number of functional tillers hill-1 | — | — | — |
|---|---|---|---|---|
| 30 DAT | 60 DAT | 90 DAT | At harvest | |
| T1- 100% N through organic sources | 6.48 | 11.85 | 13.15 | 11.15 |
| T2- 50% organic N + beejamrit, jeevamrit and ghanajeevamrit | 6.38 | 11.38 | 12.65 | 10.95 |
| T3-100% inorganic N, P2O5 and K2O | 6.68 | 12.05 | 13.25 | 11.75 |
| T4- Farmers practice | 6.08 | 11.30 | 12.60 | 10.80 |
| T5- 50% organic N + 50% inorganic N, P2O5 and K2O | 6.73 | 12.63 | 13.85 | 11.90 |
| T6- 25% organic N + 25% inorganic N, P2O5 and K2O + beejamrit, jeevamrit and ghanajeevamrit | 6.45 | 11.55 | 13.00 | 11.13 |
| S.Em. (±) | 0.13 | 0.23 | 0.21 | 0.20 |
| C.D. at 5% | 0.38 | 0.71 | 0.64 | 0.61 |
| General Mean | 6.50 | 11.79 | 13.08 | 11.28 |
Table text extracted from the original PDF; superscript letters are shown inline. The original table image is below.
View original table image
| Treatments | Dry matter accumulation (g) | — | — | — |
|---|---|---|---|---|
| 30 DAT | 60 DAT | 90 DAT | At harvest | |
| T1- 100% N through organic sources | 6.18 | 21.18 | 31.84 | 34.59 |
| T2- 50% organic N + beejamrit, jeevamrit and ghanajeevamrit | 6.09 | 19.14 | 30.09 | 33.23 |
| T3-100% inorganic N, P2O5 and K2O | 6.83 | 22.44 | 32.80 | 36.42 |
| T4- Farmers practice | 5.88 | 18.89 | 28.89 | 32.40 |
| T5- 50% organic N + 50% inorganic N, P2O5 and K2O | 7.07 | 23.56 | 34.08 | 37.48 |
| T6- 25% organic N + 25% inorganic N, P2O5 and K2O + beejamrit, jeevamrit and ghanajeevamrit | 6.12 | 21.13 | 31.16 | 34.48 |
| S.Em. (±) | 0.23 | 0.62 | 0.556 | 0.72 |
| C.D. at 5% | 0.69 | 1.88 | 1.68 | 2.16 |
| General Mean | 6.36 | 21.06 | 31.48 | 34.76 |
Table text extracted from the original PDF; superscript letters are shown inline. The original table image is below.
View original table image
References
16 in the original paper- Anonymous. Third advance estimates of area, production and productivity of Maharashtra state for year 2022-23. Krishi.maharashtra.gov.in 2022-23. 2022b.
- Dahiphale AV, Giri DG, Thakre GV, Giri MD. Effect of integrated nutrient management on yield and yield contributing parameters of scented rice. Annals of Plant Physiology. 2003;17(1):24-26.
- Jiban S, Kabita Kumari S, Krishna Prasad T. Effect of different fertilizers on growth and productivity of rice (Oryza sativa L.). International Journal of Global Sciences Research. 2020;7(1):1291-1301.
- Jeyajothi, Durairaj. Influence of integrated nutrient management practices on dry matter production, yield and NPK uptake of transplanted rice (Oryza sativa). Journal of Applied Natural Science. 2016;8(2):574-578.
- Kennedy E, Burlingame B, Nguyen N. Review article on nutrient impact assessment of rice in major rice-consuming countries. Articulos generalas. 2020;51:33-42.
- Kumar V, Kumar T, Singh G, Singh RA. Effect of integrated nutrient management on yield of rice and its residual effect on wheat in rice-wheat system under lowland. Annals of Plant and Soil Research. 2017;19(4):360-365.
- Lamichhane S, Khanal BR, Jayshi A, Bhatta S. Effect of Integrated Use of Farmyard Manure and Chemical Fertilizers on Soil Properties and Productivity of Rice in Chitwan. Agronomy Journal of Nepal. 2019;6(1):200-212.
- Mahajan, Kumar G, Chauhan V, Bhagirath. Rice Production in India. Rice Production Worldwide. 2017;53-91.
- Mangaraj S, Paikaray RK, Maitra S, Pradhan SR, Garnayak LM, Sathapathy M, et al. Integrated Nutrient Management Improves the Growth and Yield of Rice-Greengram Cropping System under the Coastal Plain Agro-Cliamatic Condition. Plants. 2022;11(1):142.
- Panwar AS, Ansari MA, Ravisankar N, Babu S, Prusty AK, Ghasal PC, et al. Effect of organic farming on restoration of soil, And productivity in rice-wheat agro-ecosystems. Front. Environ. Sci. 2022;10:1-16.
- Singh NP, Singh MK, Tyagi S, Singh SS. Effect of Integrated Nutrient Management on Growth and Yield of Rice (Oryza sativa L.) International Journal of Current Microbiology and Applied Sciences. 2018;7:3671-3681.
- Singh RD, Sayed AH, Paulpandi VK, Nandhini R, Lavanya A, Prema M. Effect of integrated nutrient management on the growth, phyllochorn tillering and yield of rice (Oryza sativa L). Academia. 2021;281-286.
- Sonamati N, Sidar RS, Singh VK, Yadav D. Effect of Integrated Nutrient Management on Rice (Oryza sativa L.) under Surguja District. Pharma Innovation. 2022;11(7):3474-3476.
- Tahmina MU, Rahman Mm, Islam M, Islam A, Jahan NA, Mia AB, Akhter S, Siddiqi MH, Kalaji HM. Integrated Nutrient Management for Rice Yield, Soil Fertility, and Carbon Sequestration. Plants Basel. 2022;11(1):1-17.
- Takhellambam SD, Herojit SA, Nandini DK, Surbala DN, Singh G. Integrated nutrient management practices on dry matter production, yield and NPK content of transplanted rice. International Journal of Chemical Studies. 2019;8:1618-1622.
- Yadav S, Lal M, Naresh RK, Yadav RB, Yadav AK, Yadav KG, Kumar R, Chandra MS, Rajput P. Effect of Organic and Inorganic Nutrient Sources on Productivity, Grain Quality of Rice and Soil Health in North-West IGP. International Journal of Current Microbiology and Applied Sciences. 2019;8:2488-94.